Reading Fundamentals With TradingView – Reliance EditionWhen you look at a giant like Reliance, the price chart doesn’t tell the whole story.
But TradingView has a few simple fundamentals that help you understand what the company is actually doing behind the scenes.
You don’t need finance knowledge. Just a few basic ideas.
Below is a simple way to read each metric, and what Reliance’s chart is telling us right now.
1. Total Revenue — “How much money did the company make?”
What it means:
Revenue is the total money a company earns from all its businesses.
If it goes up → the company sold more.
If it goes down → business slowed.
Good side:
Growing revenue means customers are buying more.
It usually means demand is strong.
Bad side:
Falling revenue means something is not working — maybe prices dropped, or there was less demand.
What Reliance shows:
Reliance’s revenue jumps sharply in 2022 because oil prices were high and retail was growing fast.
In 2023 it dips — global petrochem prices cooled.
By 2024–25 it stabilizes again, showing that its telecom and retail arms are balancing out the ups and downs of the oil business.
2. Free Cash Flow — “How much cash is left after paying all bills?”
What it means:
If a company earns money but spends even more, free cash flow becomes negative.
If it earns more than it spends, free cash flow is positive.
Good side:
Positive FCF means the company can expand safely and pay debt.
Bad side:
Negative FCF means the company is spending heavily — sometimes for expansion, sometimes because of trouble.
What Reliance shows:
Reliance had deep negative FCF in 2021–23.
Not because it was in trouble — but because it was building things: Jio towers, fiber, retail stores, warehouses.
By 2024–25, FCF turns strong again.
That means: “Expansion phase slowing. Collection phase starting.”
3. Long-Term Debt — “How much money did the company borrow?”
What it means:
Companies borrow when they want to build something big.
Debt rising is not always bad — it depends on what they built.
Good side:
Debt used for growth is healthy.
If the company earns more than the interest it pays, it’s fine.
Bad side:
Debt becomes risky if profits fall or the company stops growing.
What Reliance shows:
Debt fell when Reliance sold stakes in Jio and Retail (Facebook, Google, etc.).
Then debt started rising again as new projects came in.
But margins and revenue stayed stable — so this is “growth borrowing,” not “trouble borrowing.”
4. Market Cap — “What is the company worth in the market?”
What it means:
This is simply the stock price × number of shares.
It shows what investors think the whole company is worth.
Good side:
Market cap rising usually means investors believe the company has a strong future.
Bad side:
If market cap falls even when revenue rises, investors are unsure or waiting.
What Reliance shows:
Market cap went sideways for a long period — not crashing, not flying.
This usually means investors are waiting for the next big chapter (like green energy or retail listing).
5. P/E Ratio — “How much are people willing to pay for ₹1 of profit?”
What it means:
A high P/E means investors expect big growth.
A low P/E means investors are cautious.
Good side:
High P/E = people believe in the company.
Bad side:
Too high P/E = expectations are unrealistic.
What Reliance shows:
P/E around 24 means Reliance is no longer being valued like an oil company.
Oil companies usually have single-digit P/E.
This P/E shows that the market sees Reliance as multiple businesses — telecom, retail, and energy — not just oil.
6. Operating Margin — “How much profit the company keeps after running the business?”
What it means:
This shows efficiency.
Higher margin = better.
Lower margin = costs are rising or competition is tough.
Good side:
Rising margins mean the business is getting stronger.
Bad side:
Falling margins mean costs are eating into profits.
What Reliance shows:
Margins stay around 11–12%.
That’s normal for Reliance because retail has lower margins, telecom has stable margins, and oil has volatile margins.
This mix keeps margins steady, not extreme.
7. ROCE — “Is the company using its money wisely?”
What it means:
ROCE tells you how well the company turns investments into profit.
Higher ROCE = efficient use of money.
Lower ROCE = new projects still warming up.
Good side:
Rising ROCE means the business is entering a stronger phase.
Bad side:
Falling ROCE may mean too much money is stuck in early-stage projects.
What Reliance shows:
ROCE around ~9–10% means Reliance is midway — not booming, not struggling.
As retail and Jio mature further, ROCE usually goes up.
Final thoughts
When you put all these together, Reliance becomes very easy to read:
Revenue shows the size of the engine
Free Cash Flow shows how much fuel is left
Debt shows how fast they’re expanding
Market cap shows what people believe
P/E shows expectations
Margins show efficiency
ROCE shows long-term strength
None of this is complicated.
TradingView already gives you everything — you just need to see each line for what it is.
Disclaimer
This analysis is for educational purposes only and does not constitute investment advice. Please do your own research (DYOR) before making any trading decisions.
Trade ideas

RELIANCE @ 1546 ON WEEKLY GAVE BREAKOUT FROM CUP AND HANDLE. Please note I am not a SEBI REGISTERED , Its mere idea and chart reading analysis. RELIANCE @ 1546, On weekly time frame gave breakout from cup & handle pattern. If it sustain above 1545 for a week, then it can move towards 2000-2200 in 7-9 month.

Unlock Stock Market Gains1. The Foundation: Market Structure Is Everything
Before trying to earn profits, a trader must understand how markets move.
Market structure shows the journey of price through phases—accumulation, markup, distribution, and markdown.
1. Accumulation Phase
Institutions slowly build positions at discounted prices.
Volume is low but stable.
Retail traders usually ignore this zone because nothing exciting happens.
Signs:
Tight range movements
Higher lows on volume spikes
Long consolidation after a fall
This is where smart traders quietly prepare.
2. Markup Phase
A strong breakout happens as demand increases.
Prices rise faster than before.
Signs:
Breakout above resistance
Volume expansion
Strong bullish candles
This is the best phase for trend traders.
3. Distribution Phase
Institutions start selling while retail investors keep buying.
Signs:
Flat top structure
Divergence in volume
High volatility
Many retail traders get trapped here, believing the trend will never end.
4. Markdown Phase
Strong downtrend begins after supply overwhelms demand.
Signs:
Breakdown of support
Series of lower highs
Panic selling
To unlock gains, a trader must learn:
Buy during accumulation and early markup
Exit during distribution
Avoid trading during markdown (unless shorting)
This alone can transform trading performance.
2. Volume Profile: The Secret Tool for Spotting Smart Money
Volume Profile shows where big players are interested—not just how much they buy, but at which price they build positions.
Key levels:
1. Value Area High (VAH)
Upper boundary of heavy-volume zone.
Price above VAH = breakout potential.
Price below VAH = selling pressure.
2. Value Area Low (VAL)
Lower boundary of heavy-interest zone.
Price bouncing from VAL often triggers rallies.
3. Point of Control (POC)
The single most traded price level.
Acts like a magnet—price often revisits it.
Volume Profile tells you:
Where institutions accumulate
Where stop losses of retailers sit
Where breakouts have real conviction
Mastering volume adds huge clarity to entries and exits.
3. Sector Leadership: The Engine Behind Big Market Moves
Stock market gains come fastest when you ride the strongest sectors.
Every market cycle has sector rotation:
When the economy expands → Banks, Autos, Capital Goods rise
When global liquidity improves → IT, Pharma, FMCG move
When government spending rises → Infra, Defence, PSU stocks rally
When risk appetite increases → Smallcaps, Midcaps explode
To unlock gains, always ask:
Which sector is leading right now?
If Bank Nifty is strong, choose financial stocks.
If Nifty Metal is strong, choose steel/aluminum stocks.
If Nifty IT is strong, choose large-cap tech stocks.
Following sector momentum gives you:
Faster returns
Stronger trends
Higher breakout success rate
4. Institutional Behavior: Follow the Big Money
Retailers react to news.
Institutions plan months ahead.
The stock market moves according to:
FII flows (Foreign Institutional Investors)
DII flows (Domestic institutions & mutual funds)
Proprietary desk positions
HNI activity
When big money enters a stock:
Breakouts become cleaner
Trends sustain longer
Pullbacks are shallow
You unlock gains by aligning with big investors, not fighting them.
How to track this?
Look at volume during breakouts
Observe bulk deals and block deals
Track FII and DII daily inflow/outflow
Watch open interest built during consolidation
This creates confidence in your trades.
5. Chart Patterns & Candlestick Mastery: Timing Your Entries Perfectly
A trader with poor entries struggles even in trending markets.
A trader with perfect entries can outperform even in sideways markets.
The best patterns for unlocking gains are:
Cup and Handle
Bull Flag
Ascending Triangle
Double Bottom
Rounding Bottom
Breakout + Retest
Candles that strengthen your confidence:
Bullish Engulfing
Hammer
Marubozu
Inside Bar breakout
Doji at support
Patterns + volume = high conviction trades.
6. Risk Management: The Real Key to Unlocking Gains
Most traders lose money not because of bad trades, but because of:
Oversized positions
No stop loss
Emotional trading
Chasing breakouts
Averaging down
Revenge trading
To consistently unlock gains:
Risk 1–2% of capital per trade
Use stop losses religiously
Maintain good risk-reward ratios (1:2 or 1:3)
Book profits partially on strength
Avoid trading during high-volatility events (Fed, RBI, Budget)
Without risk control, no strategy works.
7. Psychology: The Missing Piece in Most Traders’ Journey
The stock market tests emotions more than intelligence.
The top psychological rules:
Trade plans > Emotional reactions
Patience during consolidation
Discipline during entries
Zero attachment to stocks
No fear during breakout opportunities
No greed during profitable trades
A calm mind sees opportunities clearly.
A stressed mind sees risks everywhere.
8. Position Sizing & Capital Allocation: Multiply Gains Safely
Smart position sizing ensures long-term growth.
Allocation blueprint:
50% in strong trending stocks
20% in sector leaders
20% in high-risk high-reward smallcaps
10% in hedge or defensive stocks
Diversification protects you, but over-diversification kills gains.
Position sizing rules:
Add to winners, not losers
Pyramid only after confirmation
Scale out on signs of distribution
9. Following Market Sentiment & Global Cues
Modern markets are globally interconnected.
Sentiment drivers:
GIFT Nifty
US indices (Dow, Nasdaq, S&P 500)
Dollar index (DXY)
Crude oil prices
India VIX
Bond yields
Geopolitical news
Positive sentiment = higher accuracy in long trades.
Negative sentiment = better opportunities for short trades.
10. Building a Consistent Trading System
A profitable trader uses a structured approach:
Your system should include:
Setup – what pattern/structure you trade
Trigger – the exact candle or signal
Entry – breakout/POC bounce/sector strength
Stop Loss – technical, volatility-based, or structural
Target – R:R-based or trailing stop methodology
Exit signals – rejection, distribution, divergence
A consistent system = consistent gains.

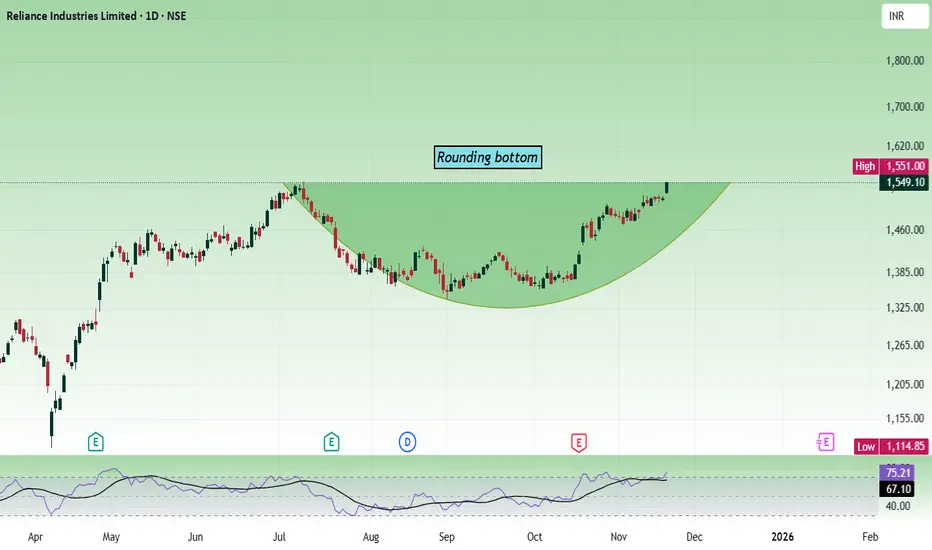
Reliance - Multi time frame analysis...We are going to see the daily and weekly charts. It's beautiful to see how the patterns are aligning.
The daily chart shows, the price has formed a rounding bottom, and right now it is testing the rounding bottom resistance/high.
The weekly chart shows, the price is nearing the cup and handle pattern resistance, which is around the zone 1600. Support is at 1350.
Any dip can be used as a buying opportunity as long as the price is above 1350.
As per the daily chart, we can enter above 1520 with the stop loss of 1470 for the targets 1560, 1590, 1615, 1640, 1676 and 1712. If the price has enough bullish strength, it can test the 1800 and then the 2000 zone.
Always do your analysis before taking any trade.
Reliance- Breakout- Retest- New HighsHello Traders! May today bring clarity, clean setups, and confident execution.
Stay patient and stay profitable.
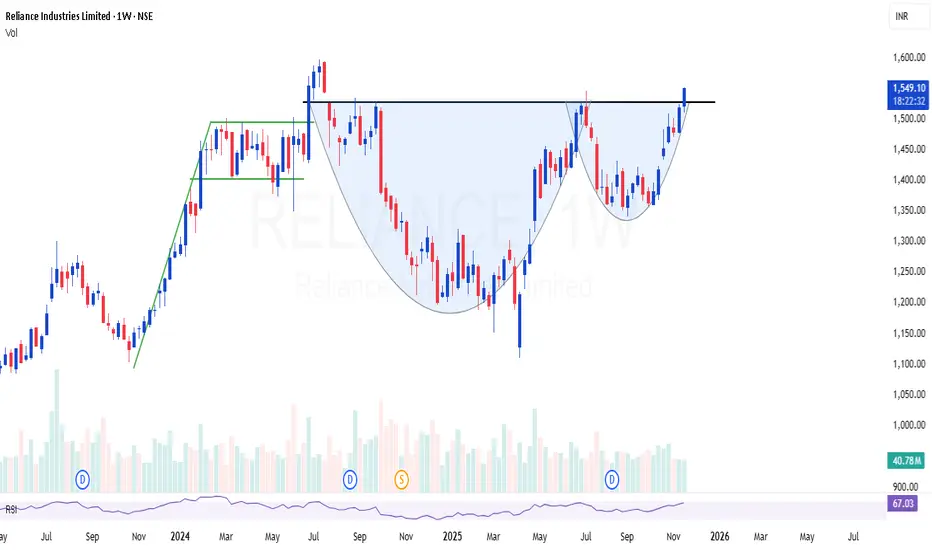
Reliance has delivered a clean weekly breakout above its horizontal swing resistance, a level that acted as a strong barrier for many weeks.
With this resistance now broken, the price can move towards the upper All-Time High Resistance zone.
Once this all-time high level is tested, the chart suggests a possible pullback towards the same swing resistance it has just broken. This move will also act as a breakout retest, which is healthy and common in a strong trend.
If the retest holds and buyers regain control, Reliance may attempt to break its All-Time High Resistance as well. A successful breakout there opens the path toward the upper Trendline Resistance, which is the next major long-term target in this rising channel.
Overall, the structure remains strongly bullish with a breakout, a potential retest, and then a possible larger move towards the trendline resistance.
Will update publication accordingly, Stay tuned!
Regards-- Amit

RELIANCE | Perfect cup & handle setup - Looks very strong 30%RELIANCE | Perfect cup & handle setup - Looks very strong for 30% short term
Last time the flag breakout disappointed, but this time Cup & handle will restore the faith i believe
Looks like 2026 is going to be a large cap year !
KOTAKBANK
RELIANCE
TCS
INFY
index heavy weights are super bullish
Part 1 Master Candle Stick Patterns Why Option Buyers Lose More Frequently
Option buyers lose mainly due to:
Time decay
Wrong direction
Lack of momentum
Low probability bets
Emotional trading
Most buyers attempt lottery-like trades in weekly expiries.
This is why professional traders prefer selling strategies.

RELIANCE INDUSTRIES LTD:Likely Cup&Saucer Break OutRELIANCE: Trading at 1530-1540.
Trading above all its Critical moving averages even in weekly chart .
Moreover DEMA has given a golden cross over of 20DEMA in weekly chart shows the strength in the stock.
Reliance has for med a Cup& Handle pattern in weekly chart and RIL holding above 1540-1550 on closing basis likely to test 1650+(For educational purpose only)

Best buying Opprtunity in Reliance stock Reliance Industries Announces ₹20,000 Crore Green Energy Joint Venture
Reliance Industries Limited (RIL) has partnered with a leading European firm to invest ₹20,000 crore in India’s renewable energy sector.
The joint venture aims to accelerate the development of solar power, wind energy, and green hydrogen production.
As part of this collaboration, advanced gigafactories will be established to manufacture solar photovoltaic (PV) modules, wind turbines, and electrolyzers, promoting indigenous production under the ‘Make in India’ initiative.
The project is expected to generate thousands of direct and indirect employment opportunities, particularly for engineers, technicians, and skilled professionals.
This strategic partnership will contribute significantly to reducing carbon emissions, aligning with India’s Net Zero Emission targets.
Additionally, the venture will enhance India’s position in the global renewable energy market by integrating next-generation energy solutions, smart grid technology, and AI-driven energy management systems.
Support Levels:
Current Support Zone: ₹1,205 - ₹1,214
Extended Support Level: ₹1,150
Major Support Zone: ₹999 - ₹1,019
Resistance Levels:
Immediate Resistance Zone: ₹1,298 - ₹1,316
First Short-term Target: ₹1,450
Second Short-term Target: ₹1,650
Major Resistance Zone: ₹1,578 - ₹1,611 (near all-time high)
The stock is currently testing the support zone of ₹1,205 - ₹1,214, and if this level breaks, the next downside level to watch is ₹1,150. On the upside, the ₹1,298 - ₹1,316 zone acts as resistance, with potential for further movement towards ₹1,450 and ₹1,650 if strength builds.
LIKE & SHARE , Comment For More Stock Analysis

Part 2 Support and ResistanceOption Premium Breakdown – Intrinsic vs Extrinsic
1. Intrinsic Value
Actual value if exercised TODAY.
For Call: Spot – Strike (if positive)
For Put: Strike – Spot (if positive)
2. Extrinsic (Time + Volatility)
Value due to time left + expectations.
This is where traders either make or lose money.

Introduction to DivergenceShould You Trade Options?
Options are powerful tools, but they require:
Understanding of market structure
Technical or quantitative edge
Patience and discipline
Clear strategy
Risk management
If you want leverage and flexibility, options are excellent.
If you want consistency and low risk, focus on credit spreads or hedged selling.

Candle Patterns Candlestick patterns are visual signals created by price movement. Each candle shows open, high, low, and close, but certain shapes reveal strong buying or selling pressure.
✅ 1. Single Candlestick Patterns
✅ 2. Bullish Candlestick Patterns (Reversal)
✅ 3. Bearish Candlestick Patterns (Reversal)
✅ 4. Continuation Patterns

Cup & Handle Breakout Opportunity in Reliance IndustriesReliance Industries, currently trading near ₹1518 on the weekly charts, is showing signs of a cup & handle breakout at the top of a consolidation zone. This pattern, combined with strong Relative Strength Index (RSI) readings across multiple timeframes, highlights a potential bullish opportunity.
🔍 What is a Cup & Handle Pattern?
Cup Formation:
Price declines, then gradually recovers, forming a rounded bottom resembling a “cup.”
Handle Formation:
A short consolidation or pullback after the cup, forming the “handle.”
Breakout Point:
When price breaks above the handle’s resistance, it signals continuation of the uptrend.
Reliance Industries Case:
Cup & handle is forming/completing at the top of consolidation.
Price is now ready to break out of the handle’s endpoint, suggesting bullish momentum.
📊 RSI Confirmation
The Relative Strength Index (RSI) is a momentum indicator that measures strength of price movements.
Key Levels:
Above 50 → Indicates bullish momentum.
Moving toward 70 → Signals strong upside strength.
Reliance Industries RSI:
Daily RSI trending above 50 and preparing to cross 70.
Monthly, weekly, and daily RSI all above 50, showing broad-based momentum.
This alignment across timeframes adds conviction to the breakout.
🎯 Learning Points for Traders
Pattern Recognition:
Cup & handle is a continuation pattern often seen before strong rallies.
Breakout above the handle confirms bullish intent.
Multi-Timeframe Analysis:
RSI above 50 across monthly, weekly, and daily charts strengthens the setup.
Multiple timeframe confirmation reduces false signals.
Momentum + Pattern Combination:
Chart patterns show structure, RSI confirms strength.
Together, they create a high-probability trading opportunity.
Risk Management:
Stop-loss can be placed below the handle’s low.
Avoid entering before breakout confirmation.
📝 Conclusion
Reliance Industries’ cup & handle breakout, supported by RSI strength across all timeframes, is a textbook example of how price patterns and momentum indicators work together. For learners, this case highlights the importance of combining technical structures with RSI confirmation to identify reliable breakout opportunities.

RELIANCE 15MININTRADAY TRADE
- EARN WITH ME DAILY 10K-20K –
RELIANCE Looking good for upside..
When it break level 1520 and sustain.. it will go upside...
BUY@ 1520
Target
1st 1536
2nd 1552
FNO
RELIANCE NOV FUT – LOT 7 (Qty-3500)
RELIANCE NOV 1490 CE – LOT 7 (Qty-3500)
Enjoy trading traders.. Keep add this STOCK in your watch list..
Big Investor are welcome to join the ride ..
Like this Post??? Hit like button..!!!
Follow me for FREE Educational Post and Alert..

India’s IPO System:Securities and Exchange Board of India (SEBI)1. Understanding an IPO
An Initial Public Offering (IPO) is the process by which a privately held company offers its shares to the general public for the first time. Through an IPO, a company becomes publicly listed on a stock exchange, such as the National Stock Exchange (NSE) or the Bombay Stock Exchange (BSE). The primary goal of an IPO is to raise capital for expansion, reduce debt, fund research, or provide an exit opportunity for early investors and promoters.
An IPO marks a significant milestone in a company’s journey because it transitions from a private entity with limited ownership to a public entity with diverse shareholders. It also enhances the company’s visibility, credibility, and valuation in the market.
2. Regulatory Framework of the Indian IPO System
The IPO process in India is governed by SEBI, established in 1992, which regulates and ensures that companies follow strict norms before going public. SEBI’s guidelines protect investors’ interests and maintain transparency. Other regulatory bodies involved include:
Ministry of Corporate Affairs (MCA) – Oversees company law compliance.
Stock Exchanges (NSE/BSE) – Approve listing applications and trading permissions.
Registrar of Companies (ROC) – Records and validates company documents.
Depositories (NSDL/CDSL) – Facilitate electronic shareholding and transactions.
SEBI’s (Issue of Capital and Disclosure Requirements) Regulations, 2018 (ICDR) lay down the specific rules for disclosures, eligibility, and allotment in an IPO.
3. Types of IPO Issues in India
There are primarily two types of IPO issues based on pricing methods:
Fixed Price Issue:
The company sets a fixed price for each share in advance.
Investors know the share price before applying.
After closure, demand is revealed, and shares are allotted accordingly.
Book Building Issue:
The company sets a price band (e.g., ₹100–₹120).
Investors bid within the range, specifying the quantity and price they are willing to pay.
The final issue price is determined based on demand (cut-off price).
Most modern IPOs in India use this method due to market efficiency.
4. Eligibility Criteria for Companies
For a company to launch an IPO in India, SEBI mandates certain eligibility conditions:
Net Tangible Assets: Minimum of ₹3 crore in the preceding three years.
Net Worth: Minimum of ₹1 crore in the last three years.
Track Record: Positive operating profit for at least three out of the last five years.
Post-Issue Capital: Minimum ₹10 crore paid-up capital.
Promoter Contribution: Promoters must hold at least 20% of post-issue capital for one year.
If companies do not meet these conditions, they can still approach the market through alternative routes like the SME (Small and Medium Enterprises) Platform or offer for sale (OFS) mechanisms.
5. IPO Process in India
The IPO process involves several well-defined steps:
a. Appointment of Intermediaries
Companies hire financial and legal advisors, including:
Merchant bankers (lead managers)
Underwriters
Registrars to the issue
Auditors and legal consultants
These intermediaries help structure, price, and execute the IPO.
b. Due Diligence and Draft Red Herring Prospectus (DRHP)
The merchant banker prepares a Draft Red Herring Prospectus (DRHP), containing details like company background, financial statements, management, risks, and objectives of the issue.
SEBI reviews the DRHP to ensure full disclosure. After approval, it becomes the Red Herring Prospectus (RHP).
c. Marketing and Roadshows
Companies conduct roadshows to attract institutional and retail investors. The management team presents the company’s growth story, business potential, and financial performance.
d. Bidding and Allotment
In a book-building issue, bidding remains open for 3–5 working days.
Investors can bid through the Application Supported by Blocked Amount (ASBA) system, where funds remain blocked in their bank account until allotment.
Post-closure, the company determines the cut-off price and allots shares to investors.
e. Listing on the Stock Exchange
Once shares are allotted, they are credited to investors’ demat accounts.
The company’s shares are then listed on the NSE and/or BSE within six working days from the issue closure date (known as the T+6 timeline).
6. Categories of Investors in an IPO
SEBI divides investors into three main categories to ensure fair participation:
Qualified Institutional Buyers (QIBs):
Includes mutual funds, insurance companies, foreign portfolio investors (FPIs), and banks. They are allotted 50% of the issue size in book-built issues.
Non-Institutional Investors (NIIs):
High-net-worth individuals investing more than ₹2 lakh. Reserved quota is 15%.
Retail Individual Investors (RIIs):
Small investors investing up to ₹2 lakh. Reserved quota is 35%.
In some cases, an additional portion may be reserved for employees or shareholders.
7. Post-Listing Performance and Compliance
Once listed, companies must adhere to continuous disclosure norms, including quarterly results, corporate governance standards, and insider trading rules. SEBI and the stock exchanges monitor compliance to protect investors and maintain transparency.
Post-listing, share prices fluctuate based on demand, supply, and market perception, reflecting the company’s fundamentals and investor sentiment.
8. Role of Technology in India’s IPO System
India’s IPO ecosystem has become increasingly digitalized. Key advancements include:
ASBA system – Simplifies payment and ensures investor protection.
UPI integration – Allows retail investors to apply easily through mobile apps.
T+6 listing timeline – Reduces settlement time and enhances liquidity.
Online bidding platforms – Brokers and exchanges now offer real-time IPO bidding services.
These innovations have significantly increased retail participation in IPOs, especially among young investors.
9. Benefits of IPOs
For companies:
Access to large-scale capital for expansion.
Improved brand visibility and credibility.
Liquidity for existing shareholders and employees.
Easier access to debt financing post-listing.
For investors:
Opportunity to invest early in growing companies.
Potential for short-term listing gains.
Long-term wealth creation through equity growth.
10. Challenges and Risks
Despite its success, India’s IPO market faces certain challenges:
Market volatility – Global events can affect investor sentiment and pricing.
Overvaluation risk – Some IPOs are priced aggressively, leading to post-listing declines.
Information asymmetry – Retail investors may lack access to in-depth financial analysis.
Regulatory delays – SEBI’s scrutiny, while essential, can prolong the process.
However, ongoing reforms and improved investor education have made the system more resilient and transparent.
11. Recent Trends in the Indian IPO Market
A surge in tech-based IPOs (e.g., Zomato, Nykaa, Paytm).
Growing participation from retail and foreign investors.
Introduction of SME and startup platforms to support smaller firms.
Shift toward sustainable and ESG-compliant companies.
Pre-IPO placements and anchor investors strengthening price discovery.
12. Conclusion
India’s IPO system is a well-structured, transparent, and dynamic framework that bridges the gap between private enterprise and public capital. With the rise of digital platforms, regulatory reforms, and investor awareness, IPOs have become a cornerstone of India’s financial growth story. As India’s economy expands and more companies seek global exposure, the IPO ecosystem will continue to evolve, fostering innovation, inclusion, and wealth creation for millions of investors.
How Businesses Can Grow in the Trading Market1. Understanding the Trading Market
The trading market encompasses multiple segments—stock trading, forex (foreign exchange), commodity trading, derivatives, and cryptocurrency trading. Each market functions under different regulatory, economic, and technological frameworks but shares a common goal: facilitating the exchange of value and risk between buyers and sellers.
For businesses entering trading, the first step to growth is a deep understanding of the market structure, participant behavior, and factors influencing price movements. Knowledge of supply-demand dynamics, macroeconomic indicators, and geopolitical influences helps in making informed trading decisions. Companies that invest in market intelligence and data analysis often find themselves ahead of competitors.
2. Building a Strong Trading Infrastructure
A key driver of growth in the trading market is technological infrastructure. In today’s environment, speed, accuracy, and connectivity define success. Businesses must invest in:
Trading Platforms: Using robust platforms like MetaTrader, Bloomberg Terminal, or proprietary systems ensures efficiency in execution.
Data Analytics Tools: Real-time data processing, AI-driven insights, and predictive analytics help in identifying opportunities early.
Connectivity and APIs: Fast internet connections and integration with exchanges through APIs enhance automation and scalability.
Cybersecurity: As trading becomes digital, safeguarding systems from cyber threats is essential for operational continuity and client trust.
A business that leverages advanced technology can scale operations globally while minimizing transaction errors and latency.
3. Strategic Diversification
One of the fundamental principles for business growth in the trading market is diversification. Relying on a single asset class or market exposes a company to unnecessary risk. Successful trading businesses diversify in several ways:
Asset Diversification: Engaging in equities, forex, commodities, and derivatives reduces dependence on one market.
Geographical Diversification: Expanding into international markets allows firms to capitalize on regional opportunities and time-zone differences.
Product Diversification: Offering products like ETFs, mutual funds, or structured products can attract a broader client base.
Diversification not only stabilizes revenue but also opens multiple income streams that cushion the impact of market volatility.
4. Leveraging Technology and Automation
Technology plays a transformative role in the trading market. Automated and algorithmic trading systems have revolutionized how businesses operate. Algorithms can execute large volumes of trades within milliseconds based on pre-set strategies, removing emotional bias and increasing efficiency.
Key technological advancements supporting business growth include:
Artificial Intelligence (AI) and Machine Learning (ML): AI helps forecast price movements using pattern recognition and big data analysis.
Blockchain Technology: It enhances transparency and reduces settlement times, especially in cryptocurrency and cross-border trading.
Cloud Computing: Enables real-time access to trading data and remote operation, allowing global teams to collaborate seamlessly.
Firms that embrace automation and digital transformation gain a competitive advantage through reduced costs, higher accuracy, and faster decision-making.
5. Developing a Risk Management Framework
Trading is inherently risky due to market fluctuations, leverage, and liquidity issues. Businesses can grow sustainably only when they balance risk and reward. A strong risk management strategy involves:
Position Sizing: Limiting exposure per trade to a fixed percentage of total capital.
Stop-Loss Orders: Automatically exiting losing trades to prevent large losses.
Hedging: Using derivatives like options and futures to protect against adverse price movements.
Stress Testing: Simulating different market scenarios to assess potential impacts on the portfolio.
Risk management not only safeguards capital but also builds confidence among investors and clients.
6. Regulatory Compliance and Transparency
Growth in the trading market depends heavily on maintaining regulatory compliance. Governments and financial authorities such as SEBI (India), SEC (USA), and FCA (UK) impose rules to ensure fair trading and investor protection. Businesses that adhere to these regulations gain credibility and attract institutional clients.
Transparency in reporting, accurate record-keeping, and ethical conduct are vital for long-term growth. A reputation for integrity can distinguish a trading firm in a competitive marketplace.
7. Building a Skilled Team
A successful trading business requires a mix of analytical, technical, and strategic expertise. Recruiting skilled professionals—traders, analysts, risk managers, and developers—creates a strong foundation for growth. Additionally, ongoing training ensures the team stays updated with market trends, tools, and compliance requirements.
Companies should encourage knowledge sharing, foster innovation, and provide performance-based incentives. Human capital remains one of the most valuable assets in trading operations.
8. Adopting Data-Driven Decision Making
Data has become the new currency of the trading world. Businesses that leverage data effectively can identify trends, forecast market behavior, and optimize trading strategies. Using big data analytics allows traders to process massive volumes of historical and real-time information for better decision-making.
Predictive analytics tools can detect early signs of market shifts, while sentiment analysis (e.g., through news or social media data) provides insights into investor psychology. Data-driven approaches minimize guesswork and enhance precision.
9. Strategic Partnerships and Networking
Collaborations with financial institutions, liquidity providers, and technology vendors can accelerate growth. For instance, partnering with brokers or fintech platforms enables access to liquidity pools and advanced market tools. Networking at global financial conferences or online forums also helps in building relationships that open doors to new opportunities and insights.
Strategic alliances expand reach, enhance credibility, and reduce operational costs through shared resources.
10. Marketing and Branding in the Trading Sector
In a competitive trading environment, marketing and brand differentiation are crucial. Businesses must position themselves as reliable, transparent, and technologically advanced. Effective strategies include:
Content Marketing: Publishing insightful market analyses and trading education to attract clients.
Social Media Presence: Using platforms like LinkedIn, X (formerly Twitter), and YouTube to engage traders.
Client Support and Service Quality: Building trust through prompt assistance and transparent communication.
A strong brand helps attract both retail and institutional clients, fueling growth.
11. Expanding into New Markets
Globalization has made it easier for trading businesses to enter emerging markets where trading activity is growing rapidly. Markets in Asia, Africa, and Latin America offer rising participation and economic potential. Understanding local regulations and customizing products for regional demand helps in capturing new audiences.
Expanding internationally diversifies revenue and increases resilience against downturns in any single economy.
12. Continuous Innovation and Adaptability
The trading market evolves constantly with changing technologies, regulations, and investor preferences. To grow, businesses must remain adaptable—embracing new tools like decentralized finance (DeFi), sustainable investing, and tokenized assets.
Innovation in products, strategies, and services keeps a firm relevant and competitive. Regular review of trading models ensures alignment with current market realities.
Conclusion
Growth in the trading market is not achieved overnight—it results from a blend of strategic planning, technological investment, skilled management, and disciplined execution. Businesses that focus on diversification, automation, risk management, and compliance can build a robust foundation for sustainable expansion.
In a world where financial markets are interconnected and data-driven, success depends on how well a business can adapt to change, leverage technology, and maintain trust. By combining innovation with prudence, any trading enterprise can evolve from a small participant to a global leader in the dynamic world of trading.


Crypto Trading Guide1. Understanding Crypto Trading
Crypto trading involves buying and selling digital assets such as Bitcoin (BTC), Ethereum (ETH), and thousands of altcoins with the goal of earning profits. Traders analyze price movements, market sentiment, liquidity, and technical indicators to make buy or sell decisions.
Unlike stock markets, crypto exchanges are decentralized and global. This means prices can fluctuate rapidly based on fundamentals, macroeconomic factors, regulatory developments, or even social media trends. Knowing how these factors affect token value is the first step toward successful trading.
2. Types of Crypto Trading
There are several popular trading styles, each suited for different personality types and risk appetites.
a) Day Trading
Day traders enter and exit positions within a single day. They rely on short-term price movements, chart patterns, and volume spikes. This style requires high attention, quick decision-making, and consistent strategy execution.
b) Swing Trading
Swing traders hold assets for days or weeks. They aim to capture price “swings” driven by broader trends. This style offers a balance—less stress than day trading yet more opportunities than long-term investing.
c) Scalping
Scalpers make numerous small trades throughout the day, profiting from minor price differences. It demands precision, discipline, and fast execution.
d) Position Trading
Position traders take long-term positions based on macro trends, technological developments, or fundamental analysis. They are less affected by short-term volatility.
e) Automated or Algorithmic Trading
Bots execute trades automatically based on predefined rules. This reduces emotional bias and allows 24/7 trading. However, setup and strategy optimization require knowledge and testing.
3. Choosing the Right Crypto Exchange
Selecting a reliable exchange is vital for safety and smooth trading. Compare platforms based on:
Security features (2FA, cold storage, proof of reserves)
Trading fees (maker/taker charges)
Liquidity (higher liquidity ensures smoother trades)
Supported crypto pairs (BTC/USDT, ETH/USDT, etc.)
User interface and tools
Customer support quality
Global exchanges include Binance, Kraken, and Coinbase, while several regional exchanges also offer local currency support.
4. Building a Trading Plan
A trading plan acts as your roadmap. It should answer:
Which coins will you trade?
What is your entry strategy?
What is your exit strategy?
How much capital will you risk per trade?
What indicators will you use?
How will you control emotions?
A strong trading plan prevents impulsive decisions and keeps you aligned with your long-term goals.
5. Fundamental Analysis (FA)
Fundamental analysis evaluates a crypto asset’s underlying value. Unlike stocks, cryptocurrencies don't have earnings or balance sheets. Instead, traders rely on:
Project whitepaper
Technology and blockchain model
Token utility and real use cases
Team and advisors
Partnerships and community size
Supply metrics (circulating and max supply)
Roadmap progress
Market sentiment (news, social media trends)
Strong fundamentals help identify long-term winners.
6. Technical Analysis (TA)
Technical analysis uses chart data to predict price movements. Common tools include:
a) Candlestick Patterns
Doji, engulfing, hammer, shooting star—these show buying or selling strength.
b) Support and Resistance
Support acts as a floor for prices; resistance acts as a ceiling.
c) Moving Averages (MA)
Popular trends include:
50-day MA
100-day MA
200-day MA
Bullish when price stays above key MAs.
d) RSI (Relative Strength Index)
Indicates overbought (70+) or oversold (30-) conditions.
e) MACD (Moving Average Convergence Divergence)
Shows momentum and potential trend reversals.
f) Volume Analysis
A price move with strong volume is more reliable than one with low volume.
A combination of these indicators gives clearer trading signals.
7. Risk Management
Crypto’s volatility can wipe out profits quickly if risk is not controlled. Effective risk management includes:
a) Position Sizing
Never allocate your entire portfolio to one coin. Use fractional position sizes (1–5% per trade).
b) Stop-Loss Orders
Automatically exit losing trades before losses escalate.
c) Take-Profit Levels
Lock in profits instead of waiting for unsustainable peaks.
d) Avoid Over-Leveraging
Futures trading may amplify gains, but also magnifies losses. Beginners should avoid high leverage.
e) Diversification
Hold a mix of large caps (BTC, ETH), mid-caps, and small caps to balance risk.
f) Keep Emotions in Check
Fear and greed are the biggest threats. A calm, rule-based approach wins long term.
8. Psychology of Crypto Trading
Market psychology plays a major role in crypto. Traders should understand:
Fear of Missing Out (FOMO)
Chasing pumps leads to buying at peaks.
Fear, Uncertainty, and Doubt (FUD)
Negative news often triggers panic selling—even when fundamentals remain strong.
Overconfidence
Winning streaks can cause reckless decisions. Stick to your plan.
Patience and Discipline
Waiting for perfect setups is key. Avoid forcing trades.
A successful trader masters both the charts and their mindset.
9. Common Crypto Trading Mistakes
Avoid the pitfalls that trap many beginners:
Trading without a plan
Using high leverage early
Investing money you cannot afford to lose
Blindly following social media influencers
Ignoring security practices
Overtrading
Not keeping trading journals
Holding losing positions out of hope
Learn from mistakes and review trades regularly.
10. Securing Your Crypto
Security should always be a top priority. Follow best practices:
Use hardware wallets for long-term storage
Enable 2FA authentication
Keep strong, unique passwords
Avoid trading on public Wi-Fi
Beware of phishing and fake websites
Backup seed phrases offline
A secure setup ensures your profits remain yours.
Conclusion
Crypto trading offers enormous potential, but success depends on knowledge, discipline, and strategic execution. By understanding trading styles, applying both fundamental and technical analysis, managing risk effectively, and controlling emotions, you can navigate the volatility of crypto markets with confidence. The key is to start slow, stay consistent, and treat trading as a long-term skill-building journey. With the right approach, crypto trading becomes not just profitable but also an enriching experience in the rapidly evolving world of digital finance.

Reliance is breaking out for huge upside targetsReliance has made a Cup and Handle pattern
Recently Reliance has given the breakout and tragets of cup and handle is coming 1900-2000
Reliance is also in 3rd wave of elliott wave
Thank You !

Part 7 Trading Master Class With Experts 1. Delta
Measures how much the option premium changes with a ₹1 move in the underlying.
Call delta: +0.0 to +1.0
Put delta: –0.0 to –1.0
2. Theta (Time Decay)
Measures how much value the option loses each day.
Buyers suffer from Theta
Sellers benefit from Theta
3. Vega
Measures impact of volatility.
High volatility → higher premium
Low volatility → lower premium
4. Gamma
Measures how fast delta changes.
High gamma = high speed of price movement.

Part 4 Learn Institutional Trading Two Sides of an Option Trade
Every option contract involves two parties:
a. Option Buyer
Pays a premium (price of the option)
Limited risk (only the premium paid)
Unlimited profit potential in some cases
b. Option Seller (Writer)
Receives the premium
Limited profit potential
Higher risk (sometimes unlimited)
Option buyers purchase potential, while sellers sell that potential in exchange for premium income.

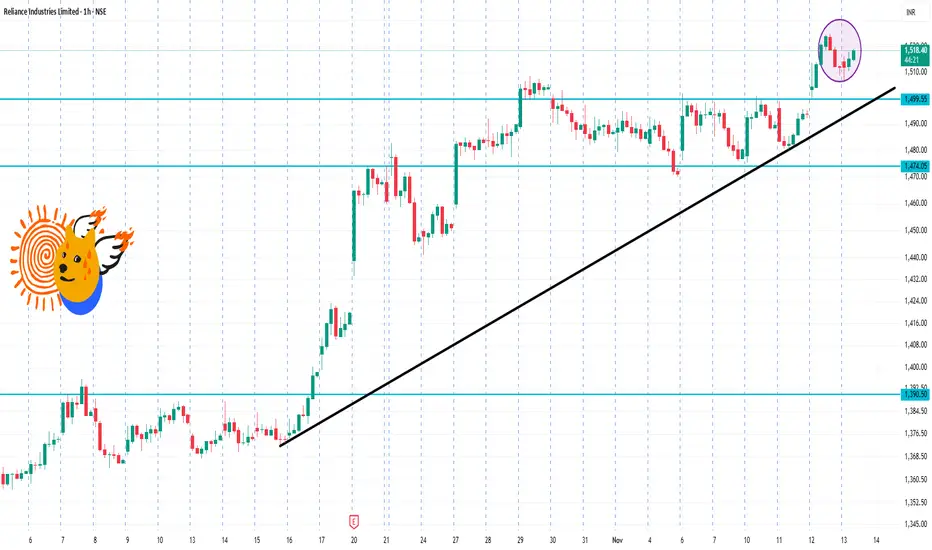
RIL 1 Hour Time Frame🔍 Current basics
Latest traded price: ~ ₹1,518 on NSE.
52-week range: Low ~ ₹1,114.85, High ~ ₹1,551.00.
Technical indicator summary (on 1-hour/higher timeframes) shows a “Strong Buy” bias.
⚠️ Risks / Caveats
Even though the technicals are bullish, the stock is close to its 52-week high (~ ₹1,551). Highs often mean less “room” for upside without some pullback.
Intraday patterns can change quickly with macro news or sector moves (eg: oil & gas, regulatory).
Support at ~₹1,500 is fairly close to current; a break could expose the ₹1,470–₹1,480 region.
Because this is a large-cap and widely held stock, institutional moves and volume matter a lot.
Part 3 Institutional Trading Uses of Option Trading
Hedging: Protecting an existing portfolio from adverse price movements.
Example: Buying a Put Option to hedge a long stock position.
Speculation: Betting on price movement direction with limited capital.
Example: Buying Call Options if expecting a stock to rise.
Income Generation: Selling options to collect premiums in range-bound markets.
Example: Covered Call Writing.
