Part 4 Learn Institutional Trading1. How Option Trading Works
Imagine two traders:
Rahul (Call buyer) thinks Infosys will go up.
Neha (Call seller) thinks Infosys will stay flat or fall.
Infosys spot = ₹1500. Rahul buys a Call option at 1520 strike for a premium of ₹20. Lot size = 100 shares.
If Infosys rises to ₹1600, Rahul gains (1600 – 1520 = ₹80 profit – ₹20 premium = ₹60 net profit per share × 100 = ₹6,000).
Neha loses ₹6,000.
If Infosys stays below 1520, Rahul’s option expires worthless, and his maximum loss is ₹2,000 (premium paid).
This shows how option trading is a zero-sum game: one’s profit is another’s loss.
2. Option Premium & Its Components
The premium you pay for an option has two parts:
Intrinsic Value (IV): Real profit if exercised now.
For Call = Spot Price – Strike Price.
For Put = Strike Price – Spot Price.
Time Value (TV): Extra value due to time left till expiry (uncertainty = potential).
As expiry nears, time value decays (Theta decay).
3. Moneyness in Options
Options are classified based on relation between spot price & strike price:
In the Money (ITM): Option has intrinsic value.
Example: Spot ₹1600, Call strike ₹1500 = ITM.
At the Money (ATM): Spot = Strike.
Example: Spot ₹1600, Call strike ₹1600.
Out of the Money (OTM): Option has no intrinsic value, only time value.
Example: Spot ₹1600, Call strike ₹1700.
4. Participants in Options Market
Hedgers – Reduce risk (e.g., an investor hedges stock portfolio with put options).
Speculators – Take directional bets for profit.
Arbitrageurs – Exploit price differences across markets.
Option Writers (Sellers) – Earn premium by selling options, often institutions.
5. Why Trade Options? Benefits & Uses
Leverage: Control large positions with small capital.
Hedging: Protect portfolio against adverse moves.
Flexibility: Multiple strategies for bullish, bearish, or neutral markets.
Income Generation: Selling options can provide steady income.
Risk Defined (for buyers): Maximum loss = premium paid.
6. Risks in Option Trading
Unlimited Loss (for sellers): Option writers can face huge losses.
Time Decay: Buyers lose money if market stays sideways.
Volatility Trap: Sudden volatility crush can wipe out premiums.
Complexity: Requires deep knowledge of Greeks & strategies.
Liquidity Risk: Some options have low trading volume.
Trade ideas

Intraday Scalping Tips: A Comprehensive Guide for Traders1. Understanding Intraday Scalping
Intraday scalping is a high-frequency trading strategy where traders aim to exploit minor price movements in highly liquid stocks, indices, or commodities. Scalpers typically hold positions for a few seconds to a few minutes, rarely longer than an hour, focusing on micro-trends.
Key Characteristics of Scalping:
Frequency: Multiple trades per day, often 20-50 or more.
Profit per trade: Small, usually 0.1% to 0.5% of the asset price.
Timeframe: Very short, typically 1-minute, 5-minute, or tick charts.
Tools: Technical indicators, Level 2 data, order books, and high-speed trading platforms.
Scalping is favored by traders who thrive on fast decision-making and have the discipline to follow strict risk management rules.
2. Choosing the Right Market and Instruments
Not all markets are suitable for scalping. The ideal instruments share characteristics like liquidity, volatility, and tight bid-ask spreads.
A. Liquidity
Highly liquid instruments allow traders to enter and exit positions quickly without significant slippage. Examples include:
Stocks: Large-cap equities such as Apple, Microsoft, or Reliance Industries.
Indices: Nifty 50, S&P 500, or Dow Jones futures.
Forex pairs: EUR/USD, GBP/USD, USD/JPY.
Commodities: Gold, crude oil futures.
B. Volatility
Scalpers thrive on small price fluctuations. Moderate volatility ensures there are enough trading opportunities without excessive risk. Instruments with too low volatility may not provide sufficient profit potential, while highly volatile ones can lead to rapid losses.
C. Spreads
Tighter bid-ask spreads reduce trading costs. Scalpers often trade instruments with minimal spreads to maximize net gains.
3. Technical Analysis for Scalping
Technical analysis is the backbone of scalping. Traders rely on charts, indicators, and patterns to make rapid decisions.
A. Timeframes
Scalpers primarily use:
1-Minute Charts: Ideal for ultra-short-term trades.
5-Minute Charts: Better for slightly larger moves and trend confirmation.
Tick Charts: Track each transaction for highly active markets.
B. Indicators
Common indicators for scalping include:
Moving Averages (MA):
Use short-term MAs (5, 10, 20 periods) to identify micro-trends.
Crossovers signal potential entry/exit points.
Relative Strength Index (RSI):
Helps spot overbought or oversold conditions.
RSI above 70 indicates overbought, below 30 indicates oversold.
Bollinger Bands:
Show volatility and potential reversal zones.
Price touching the upper or lower band may indicate a short-term reversal.
Volume Analysis:
Confirms the strength of price movements.
Increasing volume with price momentum strengthens trade signals.
C. Price Action Patterns
Scalpers also rely on candlestick patterns:
Pin Bars: Indicate quick reversals.
Doji: Signal market indecision.
Engulfing Patterns: Show strong directional shifts.
4. Scalping Strategies
A. Momentum Scalping
Momentum scalping involves entering trades in the direction of strong price movements. Traders look for:
Breakouts from consolidation zones.
High volume spikes confirming the trend.
Fast execution to ride the momentum.
Example: A stock breaking above a resistance level with heavy volume may provide a 1-2% intraday profit if timed correctly.
B. Range Trading
Some instruments trade within a defined price range during the day. Scalpers can:
Buy at support and sell at resistance.
Use tight stop-losses to minimize risk.
Confirm trades with oscillators like RSI or Stochastic.
C. News-Based Scalping
Economic reports, corporate announcements, or geopolitical news can trigger rapid price movements. Scalpers exploit this by:
Monitoring economic calendars.
Reacting quickly to breaking news.
Using platforms with low latency execution.
Caution: News-based scalping is high-risk due to unpredictable price swings.
D. Spread Scalping
This strategy is common in Forex or highly liquid markets:
Traders exploit tiny differences in bid-ask spreads.
Requires sophisticated software or a broker offering minimal latency.
5. Risk Management in Scalping
Effective risk management is non-negotiable in scalping. High trade frequency increases exposure, making small losses potentially catastrophic.
A. Position Sizing
Use small position sizes relative to your total capital.
Limit risk to 0.5%-1% per trade.
B. Stop-Loss and Take-Profit
Set tight stop-losses to avoid large losses.
Use risk-reward ratios around 1:1 or 1:1.5 due to the small profit target per trade.
C. Avoid Overtrading
Stick to your strategy, even if tempted to chase small gains.
Overtrading can erode profits and increase emotional stress.
D. Monitor Transaction Costs
Frequent trades mean higher brokerage and fees.
Opt for brokers with low commissions and tight spreads.
6. Common Mistakes to Avoid
Overleveraging: Increases risk of large losses.
Ignoring Transaction Costs: High fees can nullify gains.
Chasing the Market: Jumping into trades without setup leads to losses.
Neglecting Stop-Losses: Can transform small losses into significant drawdowns.
Emotional Trading: Fear and greed are the biggest enemies of scalpers.
Conclusion
Intraday scalping is a high-speed, high-discipline trading strategy that can yield consistent profits if executed correctly. The key to success lies in:
Choosing the right instruments.
Mastering technical analysis and chart patterns.
Implementing strict risk management.
Maintaining emotional control and mental focus.
Leveraging technology to improve speed and efficiency.
Scalping is not for everyone. It requires patience, precision, and resilience. However, for traders willing to invest time in learning and practicing, it can be a highly rewarding strategy in the world of financial markets.
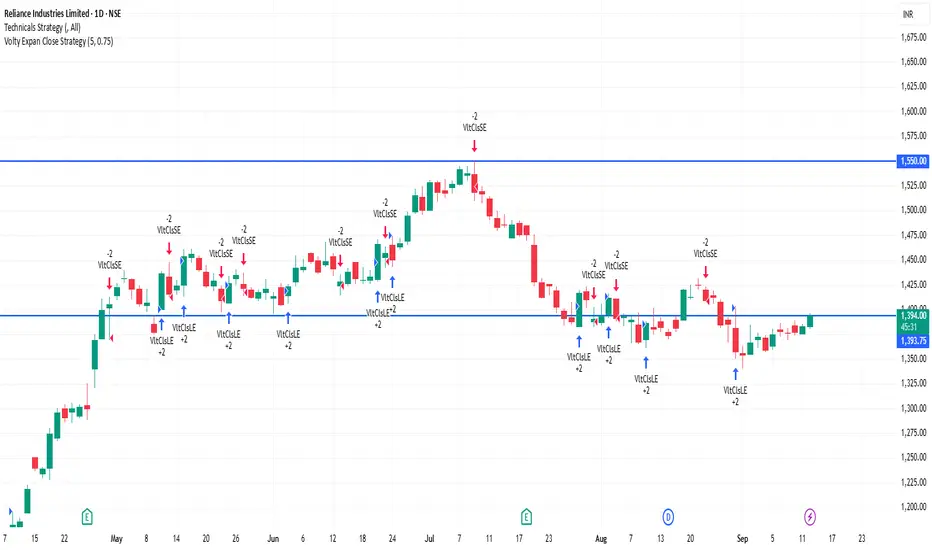
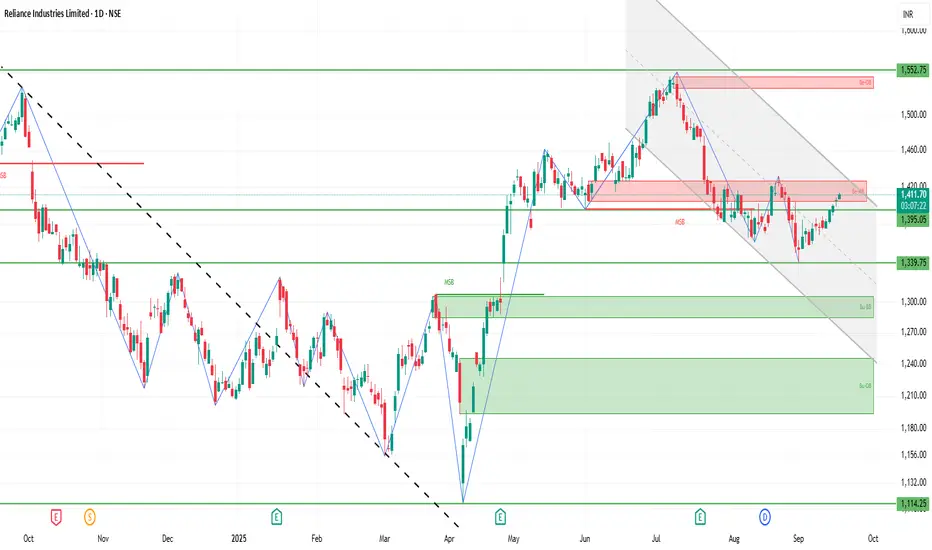
Reliance in Parallel ChannelReliance moving inside the parallel channel in the upper band.
A rising channel (also called an ascending channel) is formed by drawing two parallel trendlines—one connecting higher lows (support) and the other connecting higher highs (resistance).
Divergence Secrets1. Basic Option Trading Strategies
These are simple, beginner-friendly strategies where risks are limited and easy to understand.
1.1 Covered Call
How it Works: You own 100 shares of a stock and sell a call option against it.
Goal: Earn income (premium) while holding stock.
Best When: You expect the stock to stay flat or slightly rise.
Risk: If stock rises too much, you must sell at the strike price.
Example: You own Infosys at ₹1,500. You sell a call at strike ₹1,600 for premium ₹20. If Infosys stays below ₹1,600, you keep the premium.
1.2 Protective Put
How it Works: You buy a put option to protect a stock you own.
Goal: Hedge downside risk.
Best When: You fear a market drop but don’t want to sell.
Example: You own TCS at ₹3,500. You buy a put with strike ₹3,400. If TCS falls to ₹3,200, your stock loses ₹300, but the put gains.
1.3 Cash-Secured Put
How it Works: You sell a put option while holding enough cash to buy the stock if assigned.
Goal: Earn premium and possibly buy stock at a discount.
Best When: You’re okay owning the stock at a lower price.
2. Intermediate Strategies
Now we step into strategies combining multiple options.
2.1 Vertical Spreads
These involve buying one option and selling another of the same type (call/put) with different strikes but same expiry.
(a) Bull Call Spread
Buy lower strike call, sell higher strike call.
Limited risk, limited profit.
Best when moderately bullish.
(b) Bear Put Spread
Buy higher strike put, sell lower strike put.
Best when moderately bearish.
2.2 Calendar Spread
Buy a long-term option and sell a short-term option at the same strike.
Profits if stock stays near strike as short-term option loses value faster.
2.3 Diagonal Spread
Like a calendar, but strikes are different.
Offers flexibility in adjusting for trend + time.
3. Advanced Option Trading Strategies
These are for experienced traders who understand volatility and time decay deeply.
3.1 Straddle
Buy one call and one put at same strike, same expiry.
Profits if the stock makes a big move in either direction.
Best before major events (earnings, policy announcements).
Risk: If stock stays flat, you lose premium.
3.2 Strangle
Similar to straddle, but strike prices are different.
Cheaper, but requires larger move.
3.3 Iron Condor
Sell an out-of-the-money call spread and put spread.
Profits if stock stays within a range.
Great for low-volatility environments.
3.4 Butterfly Spread
Combination of calls (or puts) where profit peaks at a middle strike.
Limited risk, limited reward.
Best when expecting very little movement.
3.5 Ratio Spreads
Sell more options than you buy (like 2 short calls, 1 long call).
Higher potential reward, but can be risky if stock trends too far.

long term bullish view on reliancedaily tf is +ve for short its -ve
I have marked important levels based on co relation
I used factors like ema , fibonacci, and resistance becomes support concepts

Market Reform Fallout: Opportunities Hidden in UncertaintyIntroduction
In the ever-evolving landscape of global finance, market reforms—whether initiated by governments, central banks, or supranational entities—often usher in periods of heightened uncertainty. While such reforms aim to enhance economic stability, competitiveness, and growth, they can also lead to market volatility and investor apprehension. However, history has shown that amidst this uncertainty lie opportunities for those with the acumen to identify and capitalize on them.
This article delves into the multifaceted impacts of market reforms, exploring both the challenges they present and the avenues they open for astute investors and policymakers.
The Nature of Market Reforms
Market reforms encompass a broad spectrum of policy changes, including:
Deregulation: Reducing government intervention in markets to foster competition.
Privatization: Transferring state-owned enterprises to private ownership.
Trade Liberalization: Lowering tariffs and non-tariff barriers to encourage international trade.
Monetary and Fiscal Adjustments: Altering interest rates, taxation, and government spending to influence economic activity.
While these reforms are designed to stimulate economic growth and efficiency, their implementation can lead to short-term disruptions as markets adjust to new realities.
Fallout from Market Reforms
The immediate aftermath of market reforms often includes:
Market Volatility: Sudden policy shifts can lead to sharp market reactions, affecting asset prices and investor sentiment.
Sectoral Disruptions: Industries that were previously protected may face increased competition, leading to restructuring or closures.
Regulatory Uncertainty: Ambiguities in new policies can create a challenging environment for businesses and investors.
For instance, the European Union's ongoing review of merger policies has created uncertainty in the corporate sector, as companies await clearer guidelines before pursuing consolidation strategies
Identifying Opportunities Amidst Uncertainty
Despite the challenges, periods of uncertainty following market reforms can present unique opportunities:
Emerging Market Investments: Countries undergoing reforms often experience growth in sectors like infrastructure, technology, and consumer goods. For example, South Africa's financial markets have soared despite weak economic data and slow reforms, indicating potential in emerging markets
Strategic Mergers and Acquisitions: Regulatory changes can lead to consolidation in certain industries, presenting opportunities for mergers and acquisitions. BNP Paribas anticipates future opportunities in European investment banking driven by expected restructuring and refinancing
Policy-Driven Sectors: Reforms in areas like renewable energy, healthcare, and education can create investment opportunities in companies aligned with new policy directions.
Diversification Strategies: Investors can mitigate risks by diversifying portfolios across regions and sectors that are less affected by the reforms.
Case Studies of Reform-Induced Opportunities
South Africa: Despite slow economic growth and high unemployment, South Africa's financial markets have performed strongly, with the Johannesburg Stock Exchange reaching record highs. Analysts attribute this optimism to strong commodity prices and perceived political stability
European Union: The EU's review of merger policies has created uncertainty, but also potential for consolidation in industries like technology and manufacturing. Companies that can navigate the regulatory landscape may find opportunities for growth.
United States: The Federal Reserve's balancing act in a politically volatile landscape presents both risks and opportunities. Sectors sensitive to interest rates, such as real estate and high-yield bonds, remain vulnerable, while defensive assets like Treasury securities and gold may gain allure as hedging tools
Strategies for Navigating Reform-Induced Uncertainty
Investors and policymakers can adopt several strategies to navigate the uncertainties arising from market reforms:
Scenario Planning: Developing multiple scenarios to anticipate potential outcomes and prepare accordingly.
Stakeholder Engagement: Engaging with policymakers to influence the design and implementation of reforms.
Risk Management: Employing hedging techniques and diversifying investments to mitigate potential losses.
Monitoring Indicators: Keeping an eye on key economic and political indicators that signal changes in the reform trajectory.
Conclusion
While market reforms can lead to periods of uncertainty, they also create avenues for growth and innovation. By adopting a proactive and informed approach, investors and policymakers can turn potential challenges into opportunities, driving progress and prosperity in the evolving global market landscape.
Part 1 Trading Master Class With Experts1. Introduction to Options
Financial markets give investors multiple tools to manage money, speculate on price movements, or hedge risks. Among these tools, options stand out as one of the most powerful instruments. Options are a type of derivative contract, which means their value is derived from an underlying asset—such as stocks, indices, commodities, or currencies.
Think of an option like a ticket. A movie ticket gives you the right to enter a cinema hall at a fixed time, but you don’t have to go if you don’t want to. Similarly, an option contract gives you the right, but not the obligation, to buy or sell an asset at a pre-decided price before or on a fixed date.
This flexibility is what makes options both exciting and risky. For beginners, it can feel confusing, but once you grasp the basics, option trading becomes a fascinating world of opportunities.
2. Basic Concepts of Option Trading
At its core, option trading revolves around three elements:
The Buyer (Holder): Pays money (premium) to buy the option contract. They have rights but no obligations.
The Seller (Writer): Receives the premium for selling the option but must fulfill the obligation if the buyer exercises it.
The Contract: Specifies the underlying asset, strike price, expiry date, and type of option (Call or Put).
Unlike stocks, where you directly buy shares of a company, in options you are buying a right to trade shares at a fixed price. This difference is what gives options their unique power.
3. Types of Options
There are mainly two types of options:
3.1 Call Option
A Call Option gives the buyer the right (but not obligation) to buy an underlying asset at a fixed price before expiry.
👉 Example: You buy a call option on Reliance at ₹2,500 strike price. If Reliance rises to ₹2,700, you can buy it at ₹2,500 and immediately gain profit.
3.2 Put Option
A Put Option gives the buyer the right (but not obligation) to sell an asset at a fixed price before expiry.
👉 Example: You buy a put option on Infosys at ₹1,500. If Infosys falls to ₹1,300, you can sell it at ₹1,500, making profit.
These two simple instruments form the foundation of all option strategies.
4. Key Option Terminology
Before trading, you must understand the language of options.
Strike Price: The fixed price at which the option can be exercised.
Premium: The cost of buying an option. Paid upfront by the buyer.
Expiry Date: The last date until the option is valid. In India, stock options usually expire monthly, while index options may expire weekly.
In-the-Money (ITM): Option that already has intrinsic value (profitable if exercised).
Out-of-the-Money (OTM): Option that currently has no intrinsic value (not profitable if exercised).
At-the-Money (ATM): Strike price is very close to the market price.
Option Chain: A list of all available call and put options for a given asset, strike, and expiry.
Knowing these terms is like learning alphabets before writing sentences.

RELIANCE 1D Time frameCurrent Stock Price
Current Price: ₹1,411.60
Day’s Range: ₹1,406.90 – ₹1,412.50
52-Week Range: ₹1,114.85 – ₹1,551.00
Market Cap: ₹19.09 lakh crore
P/E Ratio: 23.43 (lower than sector average)
Dividend Yield: 0.39%
Book Value: ₹605.55
TTM EPS: ₹60.23 (+18.56% YoY)
📈 Trend & Outlook
Short-Term Trend: Mildly bullish; the stock has risen for five consecutive sessions.
Resistance Levels: ₹1,412.50 (day’s high), ₹1,551.00 (52-week high).
Support Levels: ₹1,406.90 (day’s low), ₹1,375.00 (recent low).
Investor Sentiment: Positive, with expectations around upcoming IPOs for Jio and Retail in 2026 and 2027, respectively.
🧭 Analyst Insights
Citi Group has a target price of ₹2,020, citing improved sentiment post-SEBI’s new listing norms for Jio and Retail.
Quant Mutual Fund increased its stake in Reliance Industries in August, indicating institutional confidence.
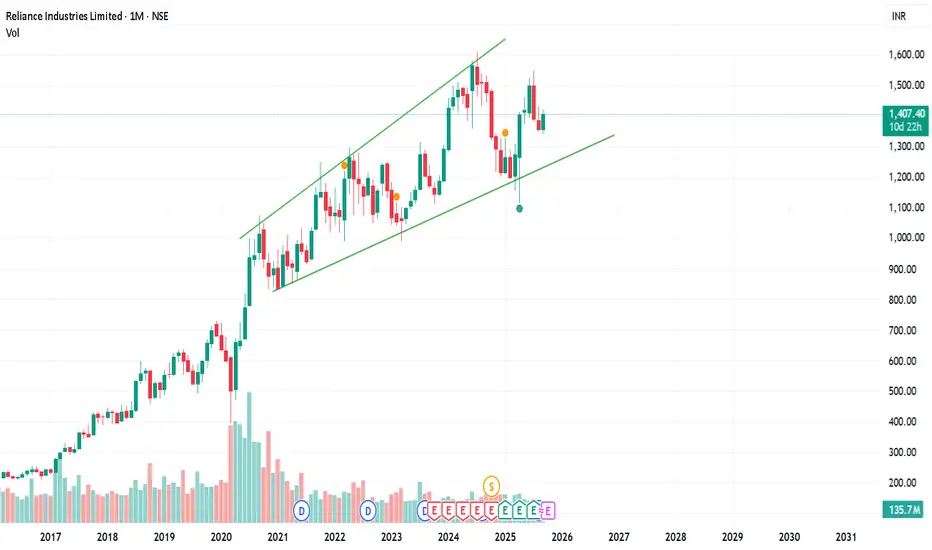
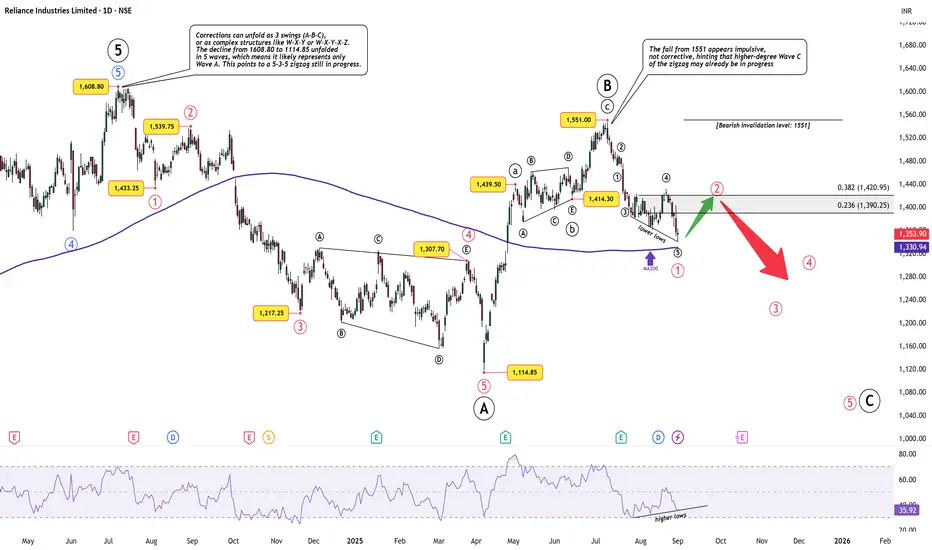
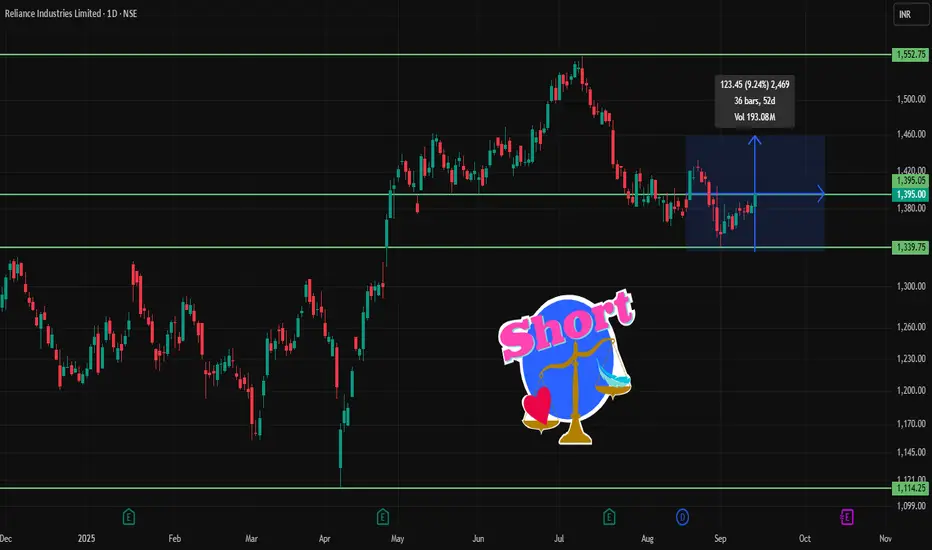
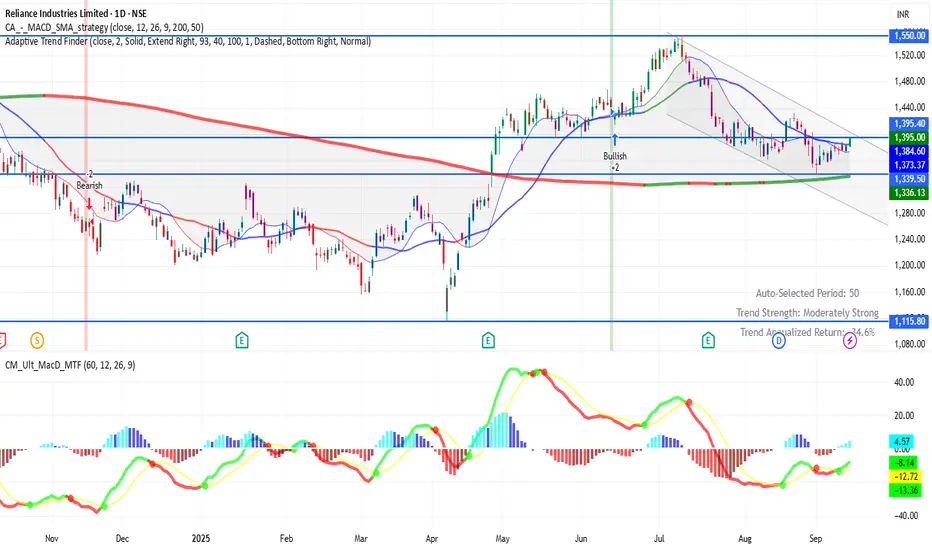
Reliance Industries – Short-Term Bounce, Bigger Zigzag UnfoldingWave Structure
The decline from the all-time high at 1608.80 to 1114.85 unfolded in a clean 5-wave impulse. Rather than a completed W–X–Y correction, this is best viewed as Wave A of a higher-degree zigzag (5-3-5).
The subsequent rally into 1551 was a clear 3-wave move, marking Wave B . With this structure, the larger Wave C is now favored to be unfolding to the downside.
Current Setup
The drop from 1551 is impulsive, not corrective, which supports the case that Wave C is already in progress.
Price is testing the MA200 and printed bullish RSI divergence (higher lows on RSI vs. lower lows on price), suggesting near-term exhaustion.
This favors a short-term Wave 2 bounce before further downside unfolds.
Outlook
Short-term (bullish): Relief rally toward 1390–1420 possible as Wave 2 plays out.
Medium-to-long term (bearish): Once Wave 2 completes, downside is expected in Wave 3–4–5 of C, with potential targets revisiting 1100 or lower.
Invalidation: A sustained break above 1551 negates the bearish outlook and would suggest the correction has already ended.
Summary
Short-term: Bounce likely.
Big picture: Bearish zigzag not yet complete.
Disclaimer: This analysis is for educational purposes only and does not constitute investment advice. Please do your own research (DYOR) before making any trading decisions.
How to Build Multiple Income Streams in Trading1. Why Multiple Income Streams Matter in Trading
1.1 Protection Against Market Cycles
No trading strategy works in every market condition. For instance, trend-following strategies thrive in strong trends but fail in sideways markets. By diversifying income streams (e.g., options selling, intraday scalping, swing trading), traders ensure they’re not left idle during unfavorable conditions.
1.2 Reducing Dependence on a Single Strategy
If you rely only on intraday trading, one bad month can severely impact your finances. Having multiple sources—such as long-term investing, dividend income, or mentoring—can balance the risk.
1.3 Building Wealth Alongside Active Trading
Trading provides cash flow, but wealth is built by reinvesting profits. Multiple income streams allow traders to accumulate wealth while still maintaining liquidity.
1.4 Peace of Mind and Financial Freedom
When you know you have more than one stream of income, trading pressure reduces. You can focus on quality trades instead of overtrading out of desperation.
2. Core Trading Income Streams
These are the direct ways traders generate income through market participation.
2.1 Intraday Trading (Active Cash Flow)
Description: Buying and selling securities within the same day to capture small price moves.
Pros: Daily income, highly liquid, opportunities almost every day.
Cons: Requires skill, discipline, and constant screen time.
Role in multiple streams: Provides quick cash flow but should be balanced with slower strategies.
2.2 Swing Trading (Medium-Term Profits)
Description: Holding trades for days to weeks to capture short-term price swings.
Pros: Less stressful than intraday, fits part-time traders, fewer trades but higher reward-to-risk.
Cons: Exposure to overnight risks, requires patience.
Role: Acts as a bridge between intraday and long-term investments.
2.3 Positional / Trend Trading
Description: Capturing major price moves by holding positions for weeks or months.
Pros: High potential returns, less screen time.
Cons: Requires strong conviction, risk of large drawdowns.
Role: Generates lump-sum profits in trending markets.
2.4 Options Trading
Strategies to Create Income Streams:
Options Selling (Covered Calls, Credit Spreads): Generates steady premium income.
Options Buying (Speculation): High-risk but can deliver explosive returns.
Why it’s powerful: Options allow both hedging and income generation, making them a versatile addition to income streams.
2.5 Futures Trading
Description: Speculating or hedging using futures contracts in equities, commodities, or currencies.
Pros: Leverage, exposure to global assets, hedging benefits.
Cons: High risk due to leverage, requires strict money management.
Role: Can be used to hedge other trading streams.
2.6 Long-Term Investing
Description: Building a portfolio of stocks, ETFs, bonds, or commodities for years.
Pros: Wealth creation, passive dividend income.
Cons: Requires patience, not always liquid.
Role: Complements trading income with long-term wealth building.
3. Supplementary Trading-Related Income Streams
Beyond direct trading, many professionals create secondary income sources by leveraging their knowledge.
3.1 Mentorship & Training
Conduct workshops, webinars, or one-on-one mentorships.
Example: Charging fees for teaching beginners how to read charts or manage risk.
Stream Type: Active but highly rewarding once you establish credibility.
3.2 Writing & Content Creation
Blogging, YouTube channels, newsletters.
Why it works: Traders can monetize content via ads, sponsorships, or premium subscriptions.
Stream Type: Semi-passive over time.
3.3 Trading Systems & Algorithm Sales
If you develop profitable strategies, you can license or sell them.
Example: Creating a TradingView indicator and charging for access.
3.4 Prop Trading
Trade firm capital and share profits.
Stream Type: Directly tied to performance, but scales bigger with firm capital.
4. Passive Income Streams for Traders
4.1 Dividend Stocks & ETFs
Building a portfolio that pays regular dividends ensures cash flow without active trading.
4.2 Bonds & Fixed Income Instruments
While not glamorous, they provide stability and consistent passive returns.
4.3 Real Estate Investment (REITs)
Traders often allocate part of their profits into REITs for passive rental-like income.
4.4 Copy Trading / Signal Services
Traders can allow others to copy their trades (via broker platforms) and earn commissions.
4.5 Automated Bots & Algorithms
Once developed, bots can run with minimal supervision, creating income across multiple markets.
5. Building a Diversified Trading Ecosystem
5.1 Example of Multiple Streams
A professional trader may combine:
Intraday trading (daily income)
Options selling (weekly/monthly income)
Dividend investing (quarterly passive income)
Training/YouTube (content income)
Algorithm licensing (scalable income)
5.2 The Key is Balance
Not all income streams should demand full-time attention. A healthy mix includes active, semi-passive, and passive streams.
6. Risk Management and Sustainability
6.1 Don’t Over-Diversify
Too many income streams can dilute focus. Start with 2–3 and expand gradually.
6.2 Position Sizing
Allocate capital carefully:
50% trading strategies (intraday, swing, options)
30% long-term investing
20% passive or external ventures
6.3 Psychological Stability
More income streams reduce emotional stress and trading pressure.
6.4 Compounding Profits
Reinvest profits from one stream into another (e.g., use trading profits to build a dividend stock portfolio).
7. Step-by-Step Plan to Build Multiple Trading Income Streams
Step 1 – Master One Trading Stream First
Don’t try everything at once. Build expertise in one area (say intraday).
Step 2 – Add Complementary Streams
If you start with intraday, add swing trading or options selling next.
Step 3 – Create Passive Foundations
Use part of profits to invest in dividend stocks or ETFs.
Step 4 – Monetize Your Knowledge
Start a blog, YouTube channel, or mentorship program.
Step 5 – Scale & Automate
Explore prop trading, algorithmic systems, or copy trading for scalable income.
8. Real-Life Examples
Trader A: Makes daily income via scalping, builds wealth with long-term stocks, and earns extra through prop trading.
Trader B: Focuses on swing trading, sells covered calls for income, and runs a YouTube channel teaching beginners.
Trader C: Trades futures, invests in REITs for passive income, and licenses trading bots.
Conclusion
Building multiple income streams in trading is about resilience, balance, and sustainability. Active trading provides immediate cash flow, but supplementary and passive streams ensure long-term stability. The best traders treat trading like a business with diversified revenue, reducing risks from market cycles and creating lasting financial freedom.
By starting small, mastering one stream, and gradually adding more, traders can build a powerful ecosystem where money works in different ways—whether markets are trending, sideways, or volatile. Ultimately, multiple income streams in trading are not just about making more money, but about building financial security, independence, and peace of mind.
BUY RELIANCE14/9/25
Buy Price : 1362.15
SL : 1340.6
Target 1 : 1383.7
Target 2 : 1405.25
Target 3 : 1426.8

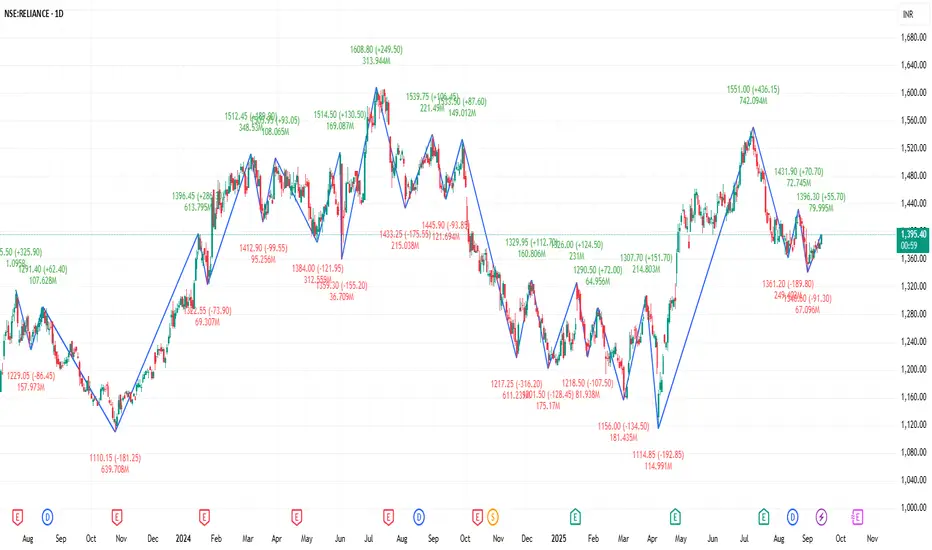
RELIANCE 1D Time framePrice Action
Current Price: ₹1,392 – ₹1,395 (approx)
Previous Close: ₹1,383.50
52-Week Range: ₹1,114.85 – ₹1,551.00
🔹 Support & Resistance
Immediate Support: ₹1,385 – ₹1,375
Next Support: ₹1,369
Immediate Resistance: ₹1,400 – ₹1,406
Next Resistance: ₹1,417
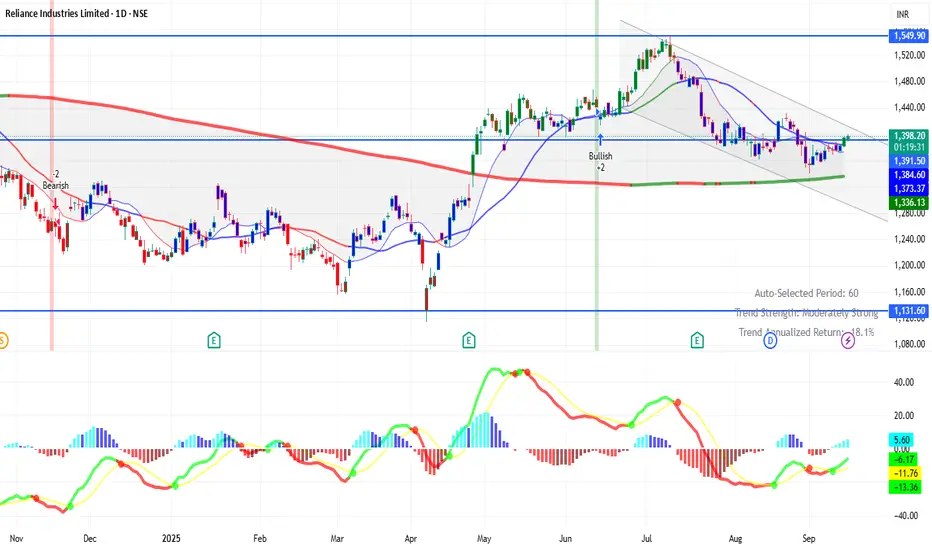
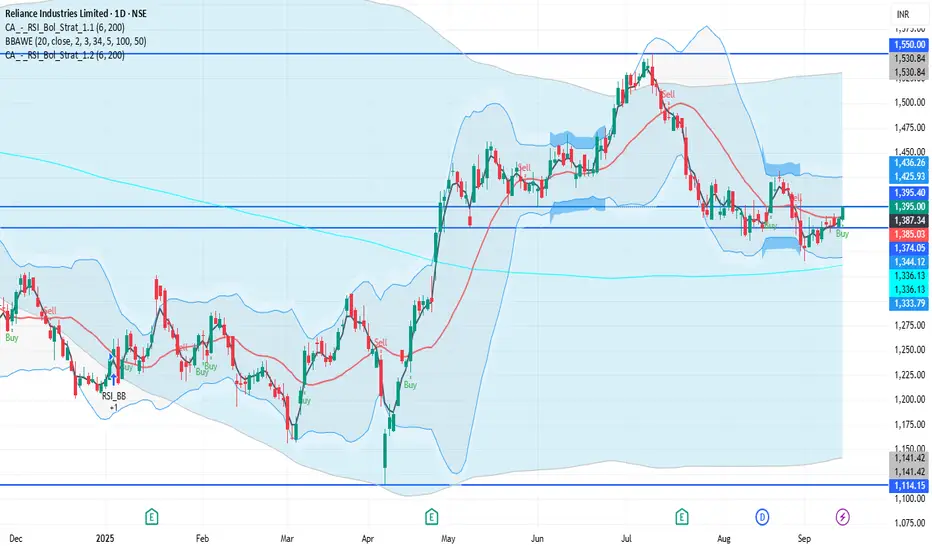
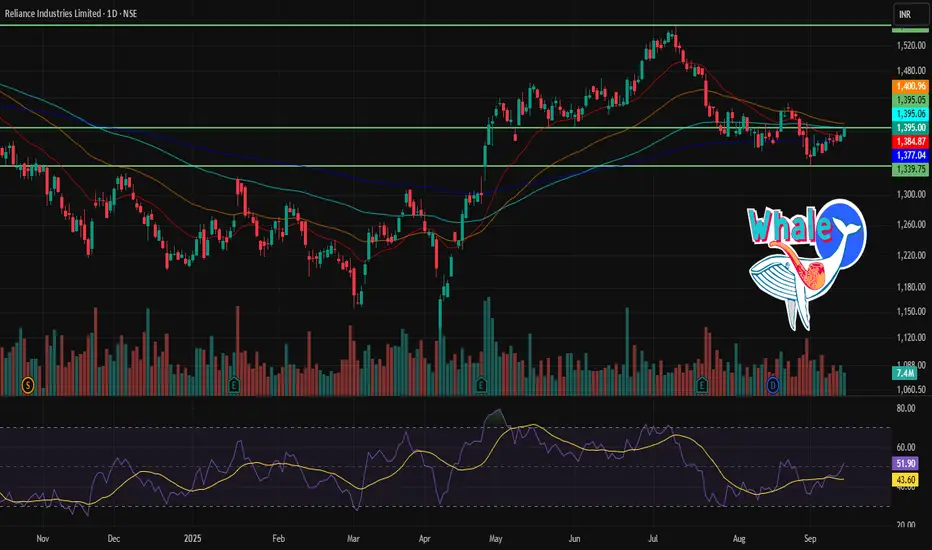
RELIANCE 1D Time frameCurrent Price & Trend
Trading around ₹1,395
Price is below many of its short- to medium-term moving averages (50-day, 100-day), suggesting resistance in that zone.
Indicators & Momentum
Relative Strength Index (RSI) is in mid-range → neither overbought nor oversold, leaning neutral.
MACD is weak to mildly bearish in daily view.
Volume has shown mixed behaviour; resistance zones are not being convincingly broken.
Trend strength indicators show some weakening or caution among buyers.
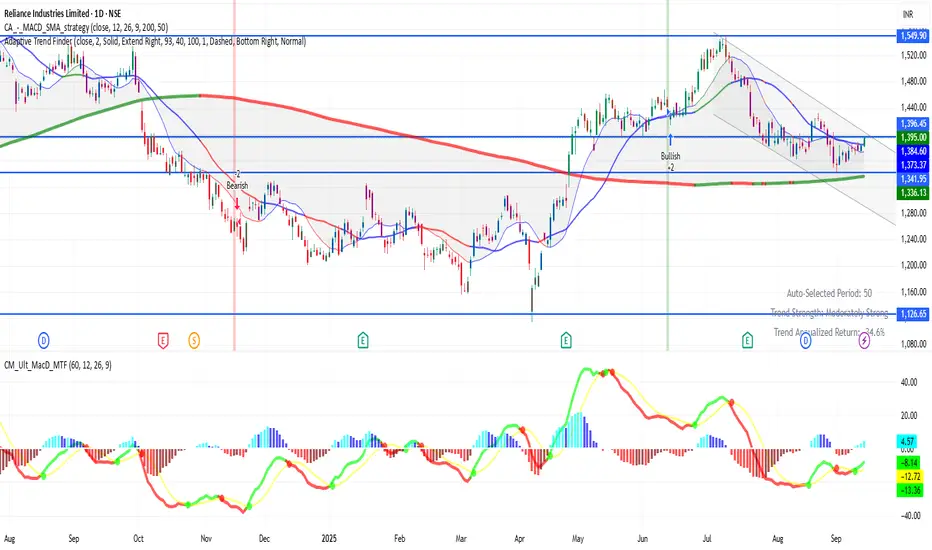
RELIANCE 1D Time frameCurrent Price & Trend
Price: ₹1,395.00
Trend: Neutral to mildly bullish; trading approximately 10.1% below its 52-week high of ₹1,551.00, achieved on July 9, 2025.
Momentum: Indicators suggest a neutral to slightly bullish outlook.
Bullish Scenario
Breakout Above ₹1,396: A sustained move above ₹1,396 could target ₹1,400 – ₹1,420 in the short term.
RELIANCE 1D Time frameCurrent Status
Price is around ₹715
The stock has been showing strength recently, with many of its moving averages (short- to long-term) supporting the rise.
Technical indicators like RSI, MACD, ADX etc. lean positive — buyers seem to have the upper hand.
There’s an inverted Head & Shoulders pattern forming, which is a bullish reversal signal if confirmed. Support zones are holding up so far.
Bullish Scenario
If Tata Motors stays above ₹700–705 support and breaks past ~₹720–725 with volume:
Possible upside to ~₹730-₹740
RELIANCE 1D Time frameClosing Price: ₹1,395.00
Day's Range: ₹1,380.50 – ₹1,396.30
52-Week High: ₹1,551.00
52-Week Low: ₹1,114.85
Market Cap: ₹18,87,780 crore
P/E Ratio (TTM): 25.30
Dividend Yield: 0.85%
Book Value: ₹1,100.00
EPS (TTM): ₹55.00
Face Value: ₹10.00
Volume: 7.4 million shares
VWAP: ₹1,388.40
Part 2 Support And ResistanceTypes of Options: Calls and Puts
There are only two fundamental types of options:
Call Option – Gives the right to buy the underlying asset at the strike price.
Example: Nifty is at 20,000. You buy a call option with a strike of 20,100. If Nifty rises to 20,400, you can buy at 20,100 and profit.
Put Option – Gives the right to sell the underlying asset at the strike price.
Example: Infosys is at ₹1,500. You buy a put option with a strike of ₹1,480. If Infosys falls to ₹1,400, you can sell at ₹1,480 and profit.
So, calls = bullish bets; puts = bearish bets.
Key Terminologies in Option Trading
To understand options, you must master the vocabulary:
Strike Price → Pre-decided price where option can be exercised.
Premium → Price paid by the option buyer to the seller.
Expiry Date → Last day the option can be exercised.
In-the-Money (ITM) → Option already has intrinsic value.
At-the-Money (ATM) → Strike price is equal to current market price.
Out-of-the-Money (OTM) → Option has no intrinsic value.
Lot Size → Options are traded in lots, not single shares. For example, Nifty lot = 50 units.
How Option Pricing Works
Options are not priced arbitrarily. The premium has two parts:
Intrinsic Value (IV)
The real value if exercised now.
Example: Nifty at 20,200, call strike 20,100 → IV = 100 points.
Time Value (TV)
Extra value due to remaining time before expiry.
Longer expiry = higher premium because of greater uncertainty.
Option pricing is influenced by:
Spot price of underlying
Strike price
Time to expiry
Volatility
Interest rates
Dividends
The famous Black-Scholes Model and Binomial Model are widely used to calculate theoretical prices.

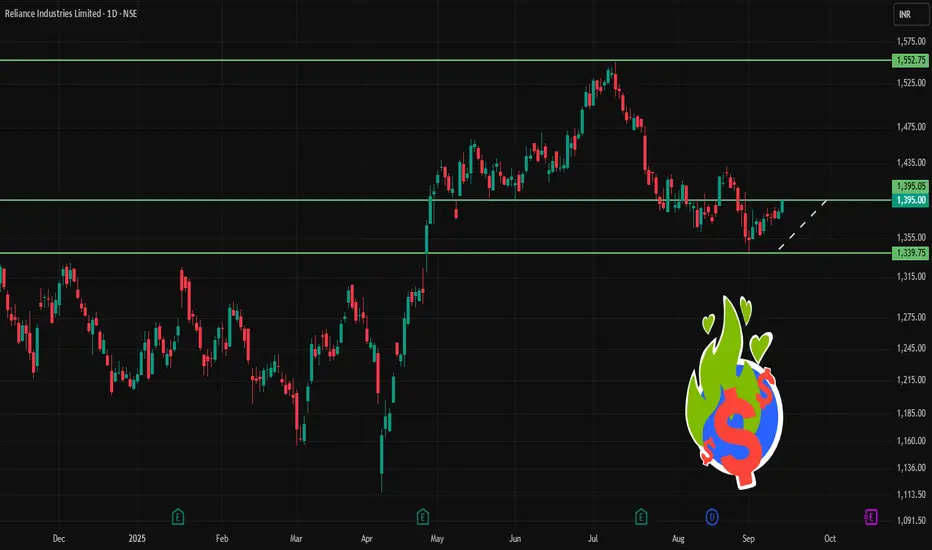
RELIANCE 1D Time frame📍 Current Price
₹1,395.00 (closing price)
Short-Term Outlook
Bullish Scenario: A sustained move above ₹1,400.00 could lead to a test of the 52-week high around ₹1,551.00.
Bearish Scenario: A drop below ₹1,375.00 may signal a potential pullback toward ₹1,350.00.

RELIANCE 1D Time frame Current Status
Price around ₹1395
Day range: ₹1380 – ₹1396
52-week range: ₹1115 – ₹1551
Key Levels
Support zones: ₹1380 → ₹1370 → ₹1350
Resistance zones: ₹1400 → ₹1410 → ₹1430
Private and Public Banks: Their Role in Trading1. Understanding Private and Public Banks
1.1 Public Banks
Definition: Banks owned or majorly controlled by governments.
Examples: State Bank of India (SBI), Bank of Baroda, Punjab National Bank, and international giants like China Development Bank or Germany’s KfW.
Role: Support trade finance, infrastructure, and developmental goals while also operating commercially.
Trust Factor: Often seen as safer due to government backing.
1.2 Private Banks
Definition: Banks owned by private individuals or institutions, focused on maximizing profits.
Examples: HDFC Bank, ICICI Bank, Axis Bank, JPMorgan Chase, Goldman Sachs, HSBC (though HSBC has mixed ownership).
Role: More aggressive in expanding into global markets, offering innovative trading products, and catering to high-net-worth individuals and corporates.
2. Banking as a Foundation for Trading
Both types of banks serve as pillars of the trading ecosystem. Their activities include:
Providing Liquidity: Banks buy and sell financial instruments, ensuring markets don’t dry up.
Market Making: Many large banks act as intermediaries in forex and derivatives trading.
Credit Access: Traders and corporations rely on bank credit to fund positions.
Clearing & Settlement: Banks ensure smooth processing of trades through clearinghouses.
Risk Management: Offering hedging tools, swaps, options, and forward contracts.
3. Role of Public Banks in Trading
Public banks play a dual role: stabilizing markets while also enabling participation in global trading.
3.1 Trade Finance
Provide letters of credit (LCs) and bank guarantees for exporters/importers.
Ensure trust in international trade transactions.
3.2 Forex Market Interventions
Act on behalf of central banks to stabilize currency markets.
Support importers by ensuring adequate foreign exchange availability.
3.3 Developmental Trading Role
Encourage financing of essential commodities (oil, wheat, fertilizers).
Maintain food and energy security through commodity trade funding.
3.4 Example: State Bank of India (SBI)
India’s largest public bank actively supports exporters through concessional finance.
Plays a key role in rupee-dollar trade settlement, enhancing India’s presence in global forex.
3.5 Strengths of Public Banks in Trading
Government backing ensures trust and credibility.
Ability to fund large-scale infrastructure trading projects.
Acts as a stabilizer during financial crises.
4. Role of Private Banks in Trading
Private banks are more aggressive and profit-oriented, often setting trends in trading innovations.
4.1 Active Participation in Global Markets
Private banks like JPMorgan, Goldman Sachs, Barclays are market leaders in forex, commodities, and equity trading.
Operate investment banking arms specializing in derivatives, structured products, and electronic trading platforms.
4.2 Wealth Management and Private Banking Services
Offer exclusive access to equity trading, hedge funds, and forex products for wealthy clients.
Provide advisory services to optimize portfolio exposure to global markets.
4.3 Technological Edge
Private banks are pioneers in algorithmic trading and high-frequency trading (HFT).
Platforms like HDFC Securities, ICICI Direct offer retail access to stock markets.
4.4 Example: Goldman Sachs
Dominates derivatives and commodities markets.
Provides structured financing deals for corporations to hedge against risks.
4.5 Strengths of Private Banks in Trading
Innovation-driven, offering sophisticated trading products.
Higher efficiency and faster adoption of fintech.
Wider global presence compared to many public banks.
5. Comparative Roles of Public vs Private Banks in Trading
Aspect Public Banks Private Banks
Ownership Government Private shareholders
Risk Appetite Conservative, stability-driven Aggressive, profit-driven
Innovation Moderate High (HFT, derivatives, fintech)
Global Trading Role Primarily support trade finance and forex Market leaders in derivatives, equities, commodities
Trust Factor Strong due to state backing Strong brand but vulnerable in crises
Client Base Mass market, corporates, governments High-net-worth individuals, institutions, corporates
6. Contribution to Different Types of Trading
6.1 Equity Trading
Public Banks: Generally less active in proprietary equity trading but support retail and institutional participation.
Private Banks: Major global equity traders, offering brokerage, research, and portfolio management.
6.2 Forex Trading
Public Banks: Assist central banks in intervention and stabilize exchange rates.
Private Banks: Global market makers, driving trillions of dollars in daily forex transactions.
6.3 Commodity Trading
Public Banks: Finance essential imports like crude oil and food grains.
Private Banks: Dominate speculative trading in oil, gold, and agricultural futures.
6.4 Derivatives & Structured Products
Public Banks: Use derivatives mainly for hedging national interests.
Private Banks: Innovate complex structured products, options, swaps, and exotic derivatives.
7. Challenges Faced by Public and Private Banks in Trading
7.1 Public Banks
Political interference in lending and trade financing.
Slower adoption of new technologies.
Higher burden of non-performing assets (NPAs).
7.2 Private Banks
Higher exposure to speculative risks.
Vulnerable to global financial shocks (e.g., Lehman Brothers collapse).
Criticism for prioritizing profit over public interest.
8. The Changing Landscape: Fintech and Digital Trading
Both public and private banks are facing disruption from fintechs:
Digital trading apps (Zerodha, Robinhood, Groww) are reducing dependency on banks for stock trading.
Still, banks remain indispensable for clearing, settlement, large-scale financing, and providing credibility.
Public banks are slowly catching up with digitization, while private banks continue to push boundaries with AI-driven trading systems.
Conclusion
The roles of public and private banks in trading are complementary rather than competitive. Public banks provide stability, credibility, and developmental support, while private banks bring innovation, speed, and global connectivity. Together, they form the backbone of the international trading ecosystem.
As trading becomes more globalized, technology-driven, and interconnected, both public and private banks will need to adapt rapidly. The future will likely see a hybrid financial system where state-backed security and private sector innovation coexist to shape the world of trading.
RELIANCE 1D Time frame🔢 Current Level
Trading around ₹1,395
🔑 Key Resistance & Support Levels
Resistance Zones:
~ ₹1,400 – ₹1,410 (near-term resistance)
~ ₹1,420 – ₹1,430 (stronger resistance above)
Support Zones:
~ ₹1,380 – ₹1,370 (first support)
~ ₹1,360 – ₹1,350 (secondary support)
📉 Outlook
Bullish Scenario: Holding above ₹1,400 could push price toward ₹1,420 – ₹1,430.
Bearish Scenario: A fall below ₹1,370 may drag it toward ₹1,350 or lower.
Neutral / Range: Likely to trade between ₹1,370 – ₹1,420 until a breakout or breakdown occurs.
RELIANCE 1D Time frame🔢 Current Level
Trading around ₹1,393 - ₹1,395
🔑 Key Resistance & Support Levels
Resistance Zones:
~ ₹1,400 – ₹1,431 (immediate resistance band)
~ ₹1,440 – ₹1,460 (higher resistance if momentum continues)
Support Zones:
~ ₹1,380 – ₹1,370 (short-term support)
~ ₹1,360 (important support below)
📉 Outlook
Bullish Scenario: Holding above ₹1,400 and breaking past ₹1,431 can open the path toward ₹1,440–₹1,460.
Bearish Scenario: A fall below ₹1,370–₹1,360 increases risk of deeper decline.
Neutral / Range: Between ₹1,360–₹1,431, Reliance may move sideways until a clear breakout happens.
RELIANCE 1D Time frame🔢 Current Level
Trading around ₹1,391.50 - ₹1,395.50
🔑 Key Resistance & Support Levels
Resistance Zones:
₹1,396 – ₹1,400 (recent highs; breakout above this may lead to further upside)
₹1,420 – ₹1,430 (stronger resistance above)
Support Zones:
₹1,380 – ₹1,385 (immediate support; failure to hold above this may lead to a decline)
₹1,370 – ₹1,375 (short-term support; a break below this could indicate weakness)
₹1,350 – ₹1,360 (deeper support zone if price dips further)
📉 Outlook
Bullish Scenario: If Reliance Industries holds above ₹1,385, upward momentum may continue. Break above ₹1,400 can open the way toward ₹1,420+.
Bearish Scenario: If it falls below ₹1,370, risk increases toward ₹1,350 – ₹1,360.
Neutral / Range: Between ₹1,385 – ₹1,400, Reliance Industries may consolidate before a directional move.