Hammer In RelianceEntry- 1380-1378
Support- 1360
Targets- 1395, 1400
Reason- In 1hr timeframe a perfect hammer candle has been made in Reliance Industries which is an indication of a reversal in the stock. One can look for an entry here with 1360 as a SL.
Disclaimer- This is just for educational purpose.
Jai Shree Ram.
Trade ideas

Basics of Technical Analysis1. Philosophy Behind Technical Analysis
The foundation of technical analysis is based on three key assumptions:
a. Market Discounts Everything
This principle states that all known information—economic, political, and psychological—is already reflected in the current price of a security. Prices react immediately to news and events, so there is no need to analyze each piece of information individually. For example, if a company reports a better-than-expected quarterly result, its stock price will immediately adjust to reflect this news.
b. Prices Move in Trends
Technical analysts believe that prices follow trends, whether upward (bullish), downward (bearish), or sideways (consolidation). Recognizing these trends is crucial because “the trend is your friend.” Traders aim to align their trades with the prevailing trend rather than against it.
c. History Tends to Repeat Itself
Human psychology drives market behavior, and patterns of fear, greed, and optimism often repeat over time. Technical analysis relies on identifying these recurring patterns to predict potential price movements.
2. Core Components of Technical Analysis
Technical analysis consists of several tools and techniques. Understanding these fundamentals is essential for building an effective trading strategy.
a. Price Charts
Price charts are the most basic tool for technical analysts. They visually display the historical price movements of a security over time.
Line Chart: Shows a simple line connecting closing prices over time. Useful for spotting long-term trends.
Bar Chart: Displays open, high, low, and close (OHLC) for each period. Useful for analyzing volatility.
Candlestick Chart: Uses colored bars (candles) to indicate price movement. Highly popular due to its visual clarity and ability to display market sentiment.
Example of a Candlestick
Bullish Candle: Close is higher than open, indicating buying pressure.
Bearish Candle: Close is lower than open, showing selling pressure.
b. Support and Resistance
These are price levels where buying or selling pressure tends to prevent further movement.
Support: A level where demand exceeds supply, preventing the price from falling further.
Resistance: A level where supply exceeds demand, preventing the price from rising further.
Traders watch these levels to make entry and exit decisions. A breakout above resistance signals potential bullish momentum, while a breakdown below support indicates bearish momentum.
c. Trendlines and Channels
Trendlines connect price highs or lows to define the direction of the market. Channels are formed by drawing parallel lines above and below the trendline.
Uptrend: Higher highs and higher lows.
Downtrend: Lower highs and lower lows.
Sideways Trend: Prices fluctuate within a horizontal range.
Channels help traders identify potential reversal points or continuation of trends.
d. Technical Indicators
Indicators are mathematical calculations based on price, volume, or both. They help confirm trends, measure momentum, and identify potential reversals.
Popular Indicators:
Moving Averages: Smooth out price data to identify trends.
Simple Moving Average (SMA)
Exponential Moving Average (EMA)
Relative Strength Index (RSI): Measures the speed and change of price movements. Values above 70 indicate overbought conditions; below 30 indicate oversold.
MACD (Moving Average Convergence Divergence): Shows the relationship between two moving averages. Helps identify trend changes and momentum.
Bollinger Bands: Measure volatility by plotting upper and lower bands around a moving average. Prices touching the bands often signal potential reversals.
e. Volume Analysis
Volume indicates the number of shares or contracts traded in a given period. It confirms the strength of a trend:
Rising price with increasing volume → strong trend
Rising price with decreasing volume → weak trend, potential reversal
Falling price with increasing volume → strong bearish trend
Volume is often analyzed alongside price patterns to validate breakouts or breakdowns.
f. Chart Patterns
Chart patterns are formations created by price movements. They signal potential continuation or reversal of trends.
Common Patterns:
Head and Shoulders: Trend reversal pattern.
Double Top and Double Bottom: Indicate potential reversals.
Triangles (Ascending, Descending, Symmetrical): Represent consolidation before breakout.
Flags and Pennants: Short-term continuation patterns.
These patterns help traders predict the market’s next move based on historical price behavior.
g. Candlestick Patterns
Candlestick patterns provide insight into market sentiment over a short period.
Doji: Indicates indecision.
Hammer: Bullish reversal at the bottom of a downtrend.
Shooting Star: Bearish reversal at the top of an uptrend.
Engulfing Patterns: Strong reversal signals.
By combining candlestick patterns with support/resistance and indicators, traders enhance their decision-making accuracy.
3. Timeframes in Technical Analysis
Technical analysis can be applied across various timeframes:
Intraday: 1-minute, 5-minute, 15-minute charts.
Short-Term: Daily or weekly charts.
Long-Term: Monthly or yearly charts.
Traders choose timeframes based on their strategy:
Day Traders: Focus on intraday charts for quick trades.
Swing Traders: Use daily or weekly charts for holding positions for days or weeks.
Investors: Rely on long-term charts for position trades.
4. Combining Technical Tools
A single tool rarely provides a perfect trading signal. Successful technical analysis combines multiple tools:
Trend Identification: Determine if the market is trending or ranging.
Support/Resistance: Identify key price levels for entry or exit.
Indicators: Confirm momentum, strength, and potential reversals.
Volume Analysis: Validate the trend or breakout.
Patterns: Spot opportunities using chart or candlestick formations.
For example, a trader may buy a stock when the price breaks above a resistance level, the RSI is rising but not overbought, and the breakout is accompanied by high volume.
5. Risk Management in Technical Analysis
Even the best technical analysis cannot guarantee profits. Risk management ensures traders protect their capital.
Stop-Loss Orders: Automatically exit losing trades at a predetermined level.
Position Sizing: Adjust trade size according to risk tolerance.
Risk-Reward Ratio: Ensure potential reward is higher than potential risk (e.g., 2:1 ratio).
Diversification: Avoid concentrating all trades in one instrument or sector.
Proper risk management is critical for long-term trading success.
6. Psychological Aspect
Markets are influenced by human emotions—fear, greed, hope, and panic. Technical analysis helps traders remain objective:
Follow predefined rules for entry and exit.
Avoid trading based on emotions or news hype.
Stick to trend direction and signals.
Emotional discipline combined with technical tools improves consistency.
7. Limitations of Technical Analysis
While technical analysis is powerful, it has limitations:
No Fundamental Insight: Ignores company performance, earnings, and economic factors.
Subjectivity: Interpretation of charts and patterns can vary between analysts.
False Signals: Breakouts or reversals can fail.
Market Manipulation: Large participants can influence price temporarily.
Traders often combine technical and fundamental analysis to mitigate these limitations.
8. Practical Application: How to Start
Choose a Market: Stocks, commodities, Forex, or cryptocurrencies.
Pick a Charting Platform: TradingView, Zerodha Kite, MetaTrader, etc.
Learn Price Patterns and Indicators: Begin with support/resistance, trendlines, and moving averages.
Paper Trade: Practice without risking real money.
Develop a Strategy: Include entry/exit rules, stop-loss, and position sizing.
Analyze Performance: Keep a trading journal to track successes and failures.
9. Advanced Concepts
After mastering the basics, traders can explore:
Fibonacci Retracement: Identify potential reversal levels.
Elliott Wave Theory: Predict market cycles using waves.
Market Profile & Volume Profile: Advanced volume-based analysis.
Algorithmic Trading: Automated execution using technical indicators.
10. Summary
Technical analysis is a toolkit that allows traders to forecast market movements based on price and volume data. Its foundation lies in understanding trends, support/resistance, chart patterns, and indicators, combined with disciplined risk management and psychological control. While it does not guarantee success, a structured approach increases the probability of making profitable trades.
By consistently applying technical analysis, traders can:
Identify opportunities in trending and range-bound markets.
Time entries and exits effectively.
Minimize losses through disciplined risk management.
Improve confidence in trading decisions.

Reliance Industries 1 Week ViewWeekly Pivot & Key Levels (via TopStockResearch)
Weekly Pivot: ₹1,406.03
Support Levels:
• S1: ₹1,380.17
• S2: ₹1,351.13
• S3: ₹1,325.27
Resistance Levels:
• R1: ₹1,435.07
• R2: ₹1,460.93
• R3: ₹1,489.97
Central Pivot Range (CPR): Bottom: ₹1,404.45 | Centre: ₹1,406.03 | Top: ₹1,407.62
Weekly Outlook Summary (via EquityPandit)
Immediate Support: ₹1,380.17
Major Support (if price breaks down): ₹1,351.13
Immediate Resistance: ₹1,435.07
Major Resistance (on breakout): ₹1,460.93
Full Trading Range Expectation: ₹1,325.27 – ₹1,489.97
Additional Chart-Based Technical Insights
TradingView Community (Weekly timeframe): Indicates a key support zone at ₹1,385–1,400. On the daily timeframe, there’s a short-term support channel around ₹1,400–1,410.
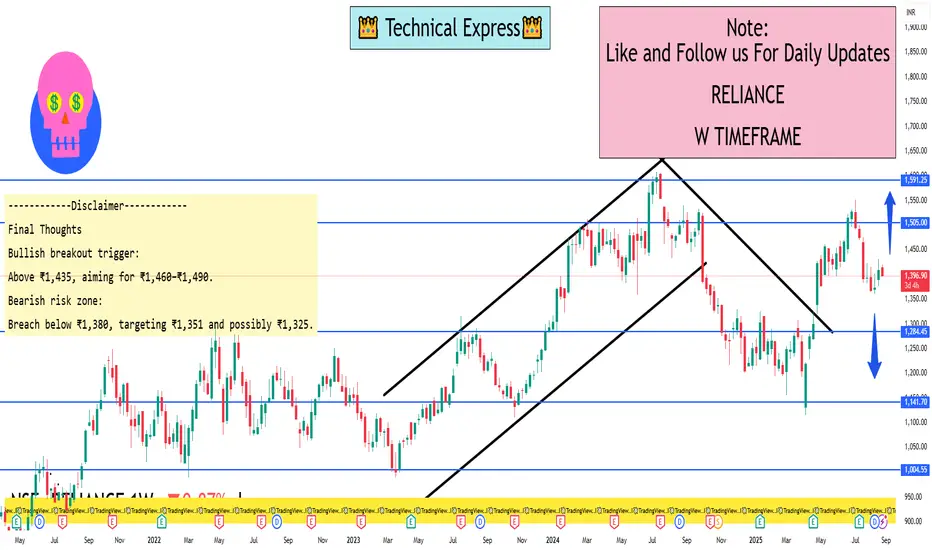
Can Reliance pull Nifty up in the coming week?Reliance seems to be completing its wave 4 and may see an upmove to complete its wave 5 in the coming week. Hoping it to be the leader for Nifty.

Part 1 Trading Master Class With ExpertsIntermediate Option Strategies
Straddle – Buy Call + Buy Put (same strike/expiry). Best for high volatility.
Strangle – Buy OTM Call + Buy OTM Put. Cheaper than straddle.
Bull Call Spread – Buy lower strike call + Sell higher strike call.
Bear Put Spread – Buy higher strike put + Sell lower strike put.
Advanced Option Strategies
Iron Condor – Sell OTM call + OTM put, hedge with farther strikes. Good for sideways market.
Butterfly Spread – Combination of multiple calls/puts to profit from low volatility.
Calendar Spread – Buy long-term option, sell short-term option (same strike).
Ratio Spread – Sell multiple options against fewer long options.
Hedging with Options
Options aren’t just for speculation; they’re powerful hedging tools.
Portfolio Hedge: If you own a basket of stocks, buying index puts protects against a market crash.
Currency Hedge: Importers/exporters use currency options to lock exchange rates.
Commodity Hedge: Farmers hedge crops using options to lock minimum prices.

Part 2 Master Candlestick PatternKey Terms in Options Trading
Before diving into strategies, let’s master some core concepts:
Underlying Asset: The stock/index/commodity on which the option is based.
Strike Price: The price at which the option can be exercised.
Expiration Date: The date on which the option contract ends.
Premium: The price paid by the option buyer to the seller (writer) for the contract.
In-the-Money (ITM): Option has intrinsic value (profitable if exercised).
At-the-Money (ATM): Underlying price = Strike price.
Out-of-the-Money (OTM): Option has no intrinsic value yet (not profitable to exercise).
Lot Size: Options are traded in lots (e.g., Nifty option has a fixed lot of 50 units).
Leverage: Options allow control of large positions with smaller capital.
How Options Work
Options are like insurance. Imagine you own a house worth ₹50 lakh and buy insurance. You pay a small premium so that if the house burns down, you can recover your value. Similarly:
A call option is like paying for the right to buy a stock cheaper later.
A put option is like insurance against stock prices falling.

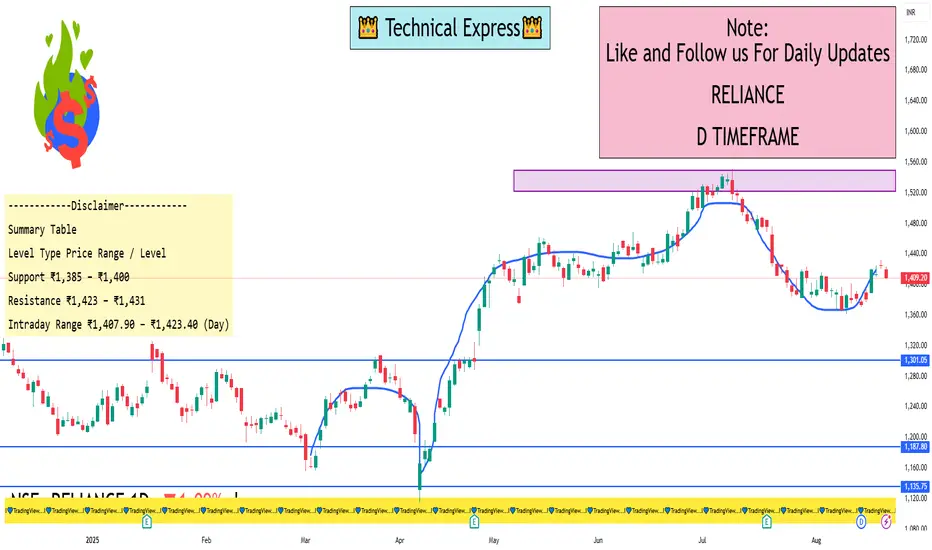
Reliance 1 Day View Key Levels (1-Day Time Frame)
Based on data from Investing.com and Moneycontrol:
Day’s Range: ₹1,407.90 – ₹1,423.40
Recent Daily High (Aug 21): ₹1,431.90
Recent Daily Low (Aug 11): ₹1,361.20
From chart commentary (TradingView):
Support Zone: ₹1,385–1,400
Resistance Level: Around ₹1,423–1,431
Interpretation & Notes
Intraday activity shows movement between roughly ₹1,408 to ₹1,423.
A daily low near ₹1,408 may serve as short-term support; breaking below could test the ₹1,385–1,400 zone.
On the upside, a close above ₹1,423–1,431 might open potential to push higher.
Remember: technical levels provide guidance, not guarantees—market dynamics and fundamentals can shift price action quickly. Always cross-check with live charts and broader analysis.
Global Events & Market ImpactIntroduction
Financial markets are like living organisms—sensitive, reactive, and constantly adapting to external influences. While company fundamentals, earnings, and investor psychology play a large role in stock price movements, global events often serve as the real catalysts for dramatic market swings.
A political decision in Washington, a sudden military conflict in the Middle East, a central bank announcement in Europe, or even a natural disaster in Asia can ripple across global financial markets within minutes. In today’s hyper-connected economy, where capital flows across borders instantly and news spreads in real time, no country or investor is fully insulated from worldwide developments.
This article explores in detail how different global events—ranging from geopolitical tensions, pandemics, and trade wars to central bank policies, technological revolutions, and climate change—affect financial markets. We’ll also study both short-term volatility and long-term structural shifts that such events trigger.
1. The Nature of Market Sensitivity to Global Events
Markets are essentially forward-looking. They do not simply react to present conditions but rather try to price in future risks and opportunities. This is why even rumors of a war, speculation about interest rate changes, or forecasts of a hurricane can cause markets to swing before the actual event occurs.
Three key characteristics define market responses to global events:
Speed – In the era of high-frequency trading and global media, reactions can happen within seconds.
Magnitude – The scale of reaction depends on how “systemic” the event is (for example, the 2008 financial crisis vs. a localized earthquake).
Duration – Some events cause short-term panic but markets recover quickly; others reshape the global economy for decades.
2. Categories of Global Events Affecting Markets
Global events can be broadly classified into several categories, each with distinct market impacts:
Geopolitical Events – wars, terrorism, political instability, sanctions, and diplomatic conflicts.
Economic Policies & Central Bank Decisions – interest rate changes, fiscal stimulus, tax reforms.
Global Trade & Supply Chain Disruptions – tariffs, trade wars, port blockages, shipping crises.
Natural Disasters & Climate Change – hurricanes, floods, wildfires, long-term climate risks.
Health Crises & Pandemics – global spread of diseases like COVID-19, SARS, Ebola.
Technological Disruptions – breakthroughs in AI, energy, and digital finance.
Commodity Shocks – sudden movements in oil, gold, or food prices.
Financial Crises & Systemic Shocks – banking collapses, currency devaluations, debt crises.
Let’s examine each in detail.
3. Geopolitical Events
Wars and Conflicts
Wars often cause energy and commodity prices to spike, especially when they involve major producers.
Example: The Russia-Ukraine war (2022) sent oil, gas, and wheat prices soaring, creating inflationary pressures worldwide.
Defense stocks usually rally, while riskier assets like emerging markets decline.
Political Instability
Elections, regime changes, and coups often create uncertainty.
Example: Brexit (2016) caused volatility in the pound sterling, reshaped European equity flows, and influenced global trade policy.
Terrorism
Major attacks (e.g., 9/11) often trigger immediate sell-offs in equity markets, with a flight to safe-haven assets like gold and US Treasury bonds.
4. Economic Policies & Central Banks
Interest Rate Decisions
Central banks like the US Federal Reserve, European Central Bank (ECB), and RBI (India) are powerful drivers of markets.
When rates rise, borrowing becomes expensive, which usually depresses stock markets but strengthens the currency.
Conversely, rate cuts often boost equities but weaken currencies.
Quantitative Easing (QE)
During crises (2008, COVID-19), central banks injected liquidity into markets, which drove asset prices upward.
Fiscal Stimulus & Taxation
Government spending plans, subsidies, or corporate tax cuts influence corporate earnings expectations and therefore stock valuations.
5. Global Trade & Supply Chains
Trade Wars
Example: The US-China trade war (2018–2019) disrupted global technology and manufacturing supply chains, causing volatility in stock markets and commodity markets.
Supply Chain Disruptions
COVID lockdowns in China created shortages in semiconductors and other goods, which impacted global auto and electronics industries.
Shipping & Logistics
Events like the Suez Canal blockage (2021) caused billions in losses and exposed how dependent markets are on smooth global logistics.
6. Natural Disasters & Climate Change
Natural Disasters
Hurricanes, tsunamis, or earthquakes often create localized stock market declines.
Example: The 2011 Japan earthquake & Fukushima nuclear disaster had global impacts on energy and auto supply chains.
Climate Change
Increasingly, investors are pricing climate risk into valuations.
Companies in fossil fuel industries face long-term risks, while renewable energy firms attract capital.
ESG (Environmental, Social, Governance) investing has emerged as a global trend.
7. Health Crises & Pandemics
COVID-19 (2020–2022)
One of the most impactful global events in modern history.
Stock markets initially crashed in March 2020 but rebounded sharply due to massive fiscal and monetary support.
Certain sectors like airlines, hotels, and oil were devastated, while tech and healthcare boomed.
Past Examples
SARS (2003) hit Asian markets temporarily.
Ebola (2014) affected African economies but had limited global effect compared to COVID.
8. Technological Disruptions
Innovations Driving Markets
The dot-com bubble (1999–2000) showed how technology hype can inflate markets.
More recently, AI and EV (Electric Vehicles) have created massive rallies in companies like Nvidia and Tesla.
Risks from Technology
Cyberattacks on financial institutions or major corporations can cause sudden market dips.
Example: Ransomware attacks or hacking of exchanges.
9. Commodity Shocks
Oil Price Volatility
Oil remains one of the most geopolitically sensitive commodities.
Example: The 1973 oil crisis caused stagflation globally.
In 2020, oil futures briefly turned negative due to demand collapse.
Gold as a Safe Haven
During uncertainty, gold prices usually rise.
Investors view it as a hedge against inflation, currency depreciation, and geopolitical risks.
Food Commodities
Droughts or export bans (e.g., India restricting rice exports) can push global food inflation higher.
10. Financial Crises & Systemic Shocks
Global Financial Crisis (2008)
Triggered by the collapse of Lehman Brothers, this event led to the worst global recession since the Great Depression.
Stock markets fell over 50%, but also created long-term changes in regulation and central bank behavior.
Asian Financial Crisis (1997)
Currency devaluations in Thailand, Indonesia, and South Korea triggered capital flight and market crashes.
European Debt Crisis (2010–2012)
Greece’s sovereign debt problems shook confidence in the Eurozone and created long-term structural reforms.
Conclusion
Global events are unavoidable in financial markets. While some are unpredictable “black swan” shocks, others evolve slowly, giving investors time to adjust. Understanding how markets react to wars, pandemics, central bank decisions, and technological disruptions can help investors navigate uncertainty more effectively.
In the short term, markets may appear chaotic. But history shows that crises often accelerate long-term transformations in economies and industries. The winners are those who maintain discipline, manage risk, and adapt strategies as global dynamics shift.

PCR Trading StrategyHow Options Work
Let’s break it down simply:
If you buy a call, you are betting that the price of the stock will go up.
If you buy a put, you are betting that the price of the stock will go down.
If you sell (write) a call, you are taking the opposite bet—that the stock won’t rise much.
If you sell (write) a put, you are betting that the stock won’t fall much.
Here’s a quick example:
Stock XYZ trades at ₹100.
You buy a 1-month call option with a strike price of ₹105 by paying a ₹5 premium.
If the stock rises to ₹120, your option is worth ₹15 (120 – 105). Since you paid ₹5, your profit = ₹10.
If the stock stays below ₹105, the option expires worthless, and you lose your premium of ₹5.
This example shows that options can magnify profits if you’re right, but they can also cause losses (limited to the premium paid for buyers, unlimited for sellers).
Types of Options
A. Call Options
Right to buy.
Used when you expect prices to rise.
Buyers have limited risk (premium) but unlimited upside.
Sellers (writers) have limited gain (premium received) but unlimited risk.
B. Put Options
Right to sell.
Used when you expect prices to fall.
Buyers have limited risk but big upside if stock falls sharply.
Sellers have limited gain (premium) but large risk if stock collapses.

Part 2 Ride The Big MovesBasics of Options
Before jumping into strategies, let’s revisit some fundamentals:
Call Option: Gives the buyer the right to buy the asset at a specific strike price.
Put Option: Gives the buyer the right to sell the asset at a specific strike price.
Option Premium: The price paid to buy an option.
Strike Price: The price at which the underlying can be bought/sold.
Expiry Date: The last date the option can be exercised.
ITM (In-the-Money): Option has intrinsic value (profitable if exercised).
OTM (Out-of-the-Money): Option has no intrinsic value (not profitable if exercised).
ATM (At-the-Money): Strike price is very close to current market price.
💡 Quick Example:
Nifty is at 22,000. You buy a 22,000 Call Option for ₹200 premium. If Nifty rises to 22,500, your option has value (ITM). If Nifty stays flat or goes down, you may lose the premium.
Now, depending on whether you buy or sell Calls/Puts, you can build hundreds of strategies.
Why Traders Use Options
Options are powerful because they can serve three main purposes:
Hedging – Protecting an existing portfolio from adverse price moves.
Example: A long-term investor holding Infosys shares may buy a Put option to protect against a fall.
Speculation – Betting on market direction with limited capital.
Example: Buying a Call if you expect bullish momentum.
Income Generation – Selling options to collect premium regularly.
Example: Writing Covered Calls on stocks you own.
The same instrument (options) can be used very differently by traders with different goals. That’s why strategies matter.

reliance viewreliance formed good bottom now time for reversal and all time high for nifty and reliance giant

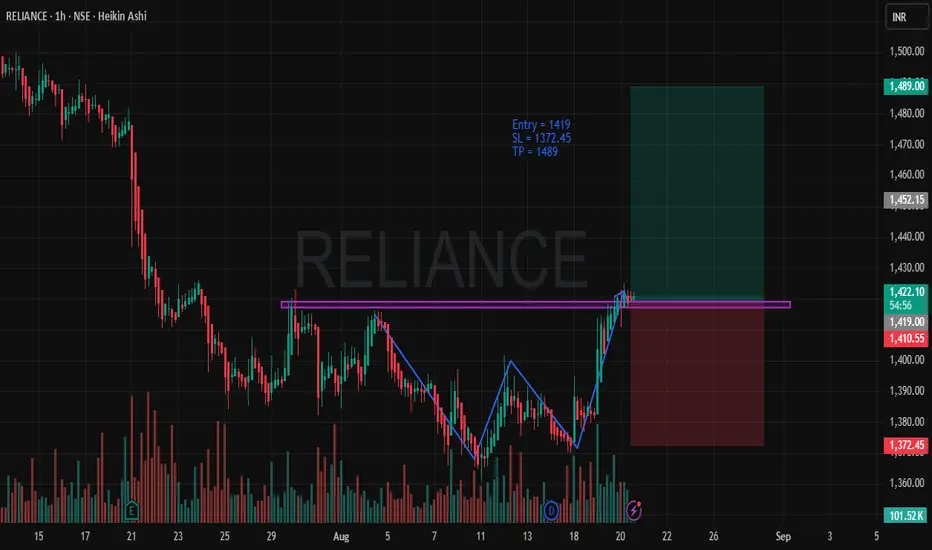
RELIANCE - Bullish SetupTimeframe: 1-Hour
Trade Type: Long Position
Entry Price: 1419
Stop Loss (SL): 1372.45
Take Profit (TP): 1489
Risk-to-Reward (RRR): 1:3.53
Trade Rationale
Bullish Trend Setup: The price action is showing a clear bullish momentum as RELIANCE has recently broken through a significant resistance level (indicated by the purple line). This breakout is a strong signal of potential upward movement.
Chart Pattern: The price forms a classic double bottom pattern (highlighted on the chart), which signifies a reversal from a downtrend to an uptrend. The pattern is confirmed with strong volume, showing the increased participation of buyers.
Entry Point: We are entering this position at 1419, right after the price breaks the resistance and starts moving upwards. This breakout marks the start of the potential rally.
Stop Loss: The SL is placed at 1372.45, just below the recent swing low, ensuring a safe exit if the market decides to reverse.
Take Profit: The TP is placed at 1489, a logical price target that accounts for a solid risk-to-reward ratio of 1:3.53. This is a reasonable expectation based on recent price action and volatility.
Volume Confirmation: Strong volume is observed, confirming the strength of the move. Typically, breakouts accompanied by high volume are more likely to continue in the breakout direction, supporting the bullish scenario.
Market Conditions: The broader market conditions appear favorable for long positions, with sentiment and technical indicators showing bullish signs across the broader market.
Risk Management
A tight Stop Loss ensures that we minimize risk in case of market retracement, while the Take Profit target allows us to ride the trend and maximize the potential return on this trade.
The Risk-to-Reward Ratio is set at 1:3.53, which aligns with sound risk management principles, allowing for substantial profits even with a lower win rate.
Day Trading Techniques1. Introduction to Day Trading
Day trading is one of the most exciting and challenging forms of trading in the financial markets. Unlike long-term investors who hold stocks for months or years, day traders aim to open and close trades within the same trading session. The idea is to capitalize on intraday price movements, whether they are tiny scalps of a few seconds or larger moves over a few hours.
Day trading requires speed, precision, and discipline. It’s not just about clicking buy and sell—it’s about having a structured approach, using the right techniques, and applying strict risk management rules.
Some of the biggest advantages of day trading include:
No overnight risk (you close positions the same day).
Frequent opportunities due to constant price fluctuations.
Ability to compound profits quickly.
But there are also challenges:
High stress and fast decision-making.
Need for strong technical knowledge.
Risk of large losses if discipline is weak.
Now, let’s dive into the core principles that govern successful day trading.
2. Core Principles of Day Trading
Before learning the techniques, every day trader must master these principles:
a) Liquidity
Choose highly liquid stocks or instruments (e.g., Nifty, Bank Nifty, top NSE stocks, S&P500, EUR/USD forex pair) so that you can enter and exit quickly without much slippage.
b) Volatility
Day traders thrive on price volatility. Without movement, there’s no profit. Stocks with daily volatility above 2-3% are ideal.
c) Timeframes
Most day traders use 1-minute, 5-minute, and 15-minute charts for entries, while higher timeframes (30-min, hourly) help in understanding the bigger trend.
d) Risk-Reward Ratio
A golden rule is never to risk more than 1-2% of capital on a single trade. Good setups should ideally have a risk-reward ratio of 1:2 or higher.
e) Discipline
Consistency matters more than one big win. Even professional traders lose trades daily, but their discipline helps them win over the long run.
3. Popular Day Trading Techniques
Now let’s discuss the main strategies and techniques used by day traders:
3.1 Scalping
Scalping is the fastest form of day trading, where traders take multiple trades within seconds or minutes. The goal is to profit from tiny price movements.
Example: Buying Nifty Futures at 24,500.50 and selling at 24,502.00 for a small 1.5-point gain, repeated multiple times.
Tools: 1-min chart, VWAP, Level 2 order book.
Best Suited For: Highly liquid markets (Bank Nifty, Nasdaq, EUR/USD).
Pros: High frequency, quick profits.
Cons: Stressful, requires excellent execution speed.
3.2 Momentum Trading
Momentum traders look for strong moves backed by high volume and ride the trend until momentum weakens.
Example: A stock breaking 5% up with strong volume after positive earnings, and you ride it for another 3-4%.
Tools: RSI, MACD, VWAP, Volume Profile.
Best Suited For: Trending markets.
Pros: Large profits in trending conditions.
Cons: Risk of sudden reversals.
3.3 Breakout Trading
Breakout traders wait for a key support/resistance level to break with volume. They enter in the direction of the breakout.
Example: Reliance stuck between ₹2,900–₹3,000 for hours, then breaking ₹3,000 with high volume → buy for upside momentum.
Tools: Bollinger Bands, Volume analysis, Price Action.
Best Suited For: Stocks consolidating before big moves.
Pros: High reward trades if trend follows through.
Cons: Fake breakouts (false signals).
3.4 Reversal Trading
Reversal trading involves spotting exhaustion in a trend and betting against it.
Example: Bank Nifty rallies from 50,000 → 50,800, forms a double top, RSI diverges → short for pullback to 50,500.
Tools: RSI divergence, Candlestick patterns (hammer, shooting star).
Best Suited For: Overextended moves.
Pros: Excellent risk-reward (small risk, large reward).
Cons: Dangerous if trend continues.
3.5 Range-Bound Trading
Some stocks don’t trend—they move sideways. Traders exploit this by buying at support and selling at resistance.
Example: HDFC Bank bouncing between ₹1,600–₹1,620. Buy near ₹1,600, sell at ₹1,620.
Tools: RSI, Bollinger Bands, Pivot Points.
Best Suited For: Low-volatility phases.
Pros: Works well in sideways markets.
Cons: Breakouts can cause losses.
3.6 News-Based Trading
Markets react violently to news—earnings, economic data, government policies, mergers. News traders take positions immediately after such events.
Example: RBI cuts repo rate unexpectedly → banking stocks rally → enter quickly for intraday gains.
Tools: Live news feeds, Economic calendar.
Best Suited For: High-impact events.
Pros: Big profits in minutes.
Cons: Extremely risky if market overreacts.
3.7 Tape Reading & Order Flow
This old-school technique uses the order book and time & sales data to judge buying/selling pressure.
Example: Sudden increase in bid size at support level → sign of accumulation → go long.
Tools: DOM (Depth of Market), Footprint charts.
Best Suited For: Professional scalpers.
3.8 Algorithmic & Quantitative Day Trading
Algo traders use automated systems and mathematical models to scalp or trade intraday moves.
Example: A mean-reversion algo that buys when RSI < 20 and sells when RSI > 80.
Tools: Python, TradingView Pine Script, MT5 bots.
Best Suited For: Traders with coding/quant skills.
4. Technical Tools for Day Trading
Some essential indicators and tools:
VWAP (Volume Weighted Average Price): Institutional benchmark, used for intraday trend bias.
Moving Averages (EMA 9/20/50): Short-term trend signals.
RSI & MACD: Momentum indicators.
Volume Profile: Shows price levels where heavy trading occurred.
Candlestick Patterns: Pin bars, engulfing candles for entries/exits.
Pivot Points & Fibonacci: Intraday support/resistance.
5. Risk Management & Position Sizing
Without risk control, even the best technique fails. Key rules:
Never risk more than 1-2% of total capital per trade.
Use stop-loss orders strictly.
Apply position sizing formulas based on account size.
Keep risk-reward ratio > 1:2.
6. Trading Psychology
Day trading success is 80% psychology, 20% strategy.
Control emotions—fear and greed kill traders.
Don’t overtrade after losses (revenge trading).
Accept that losses are part of the game.
Stay patient and wait for A+ setups.
7. Practical Example Walkthrough
Imagine you’re day trading Infosys on results day:
Stock opens at ₹1,500, rallies to ₹1,540 with strong volume.
You spot momentum buildup and enter long at ₹1,542.
Place stop-loss at ₹1,530 (12 points risk).
Target ₹1,566 (24 points reward).
Stock hits ₹1,566 → you book profits → 1:2 risk-reward achieved.
This is how disciplined execution works.
8. Common Mistakes in Day Trading
Over-leveraging with margins.
Ignoring stop-loss.
Trading low-volume illiquid stocks.
Following tips blindly.
Emotional decision-making.
9. Advanced Tips & Best Practices
Trade only 2–3 best setups per day.
Maintain a trading journal to track progress.
Specialize in a few instruments instead of chasing everything.
Use hotkeys and advanced charting software for speed.
Always review trades post-market.
10. Conclusion
Day trading is a thrilling but demanding profession. The right combination of techniques, discipline, risk management, and psychology is what separates winners from losers.
Whether you prefer scalping, momentum trading, or breakouts—the key lies in sticking to a plan, managing risk, and learning continuously. Success in day trading doesn’t come overnight—it’s a journey of skill, patience, and persistence.

Part 1 Ride The Big MovesIntroduction to Options Trading
In the world of financial markets, options trading is considered one of the most powerful and flexible forms of trading. Unlike simple stock buying and selling, options allow traders to control larger positions with less capital, hedge their risks, and design strategies that fit different market conditions — bullish, bearish, or even sideways.
An option is essentially a contract that gives the buyer the right, but not the obligation, to buy or sell an asset at a specific price (called the strike price) within a given period of time.
If you buy an option, you are purchasing a right.
If you sell (or write) an option, you are giving someone else that right and taking on an obligation.
Options are traded on stocks, indexes (like Nifty 50 or Bank Nifty in India), commodities, currencies, and even cryptocurrencies in some global markets.
They are widely used by:
Investors to hedge portfolios.
Speculators to make money from price moves.
Institutions to manage large exposures.

Reliance - A ReviewPrice opened with a gap up and moved up slowly. It crossed an important zone at 1400 and sustained above it. Price is bullish as long as it is sustaining above 1400.
The buying range is above 1415 - 1420. Observe how the price is reacting at this level.
Buy above 1415 with the stop loss of 1402 for the targets 1426, 1438, 1450, and 1466.
The daily chart shows price is breaking out of the consolidation zone.
Always do your analysis before taking any trade.

Reliance - LongThe stock is in a long-term uptrend (above the 200 EMA), has pulled back to a major support level around ₹1345), and has started to show signs of reversal with an increase in volume on the recent bounce.
Entry: A reasonable entry point would be in the current price zone around ₹1410-₹1420, as the stock has confirmed a bounce from support. A more aggressive entry could have been closer to the support level itself.
Stop Loss (SL): Place the stop loss just below the key support zone. A logical place is just below the low of the recent price action and the support box, around ₹1335. If the price drops below this level, it invalidates the support and the uptrend might be in jeopardy.
Target 1 (T1): The first target would be the area of the recent resistance, where the price began its decline. This is approximately ₹1460-₹1480.
Target 2 (T2): If the price breaks above Target 1 with good volume, the next target would be the all-time high of the current move, around ₹1560.
Risk/Reward: The potential risk (entry to SL) is about ₹75-₹85, while the potential reward (entry to T1) is about ₹50-₹70 and to T2 is about ₹150. This gives a favorable risk/reward ratio, especially when considering T2.
Disclaimer: This is a technical analysis based on the provided chart and is for educational purposes only. Market conditions can change, and this is not financial advice. All trades carry risks, and you should always conduct your own research and manage your risk accordingly.

Part 9 Trading Master Class Options in Indian Markets
Options are hugely popular in India, especially on NIFTY & Bank NIFTY.
Weekly expiries (every Thursday) attract massive trading.
Liquidity is high → easy to enter/exit.
Retail traders mostly buy options, institutions mostly sell options.
Example:
Bank NIFTY at 48,000.
Retail traders buy 48,500 CE or 47,500 PE hoping for movement.
Institutions sell far OTM options like 49,500 CE or 46,500 PE to collect premium.
Psychology & Discipline
Most beginners lose in options because:
They only buy OTM options (cheap but low probability).
They ignore time decay (premium melts fast).
They overtrade with leverage.
Success in options = discipline, risk control, strategy, patience.
Pro tips:
Never put all money in one trade.
Understand probability – 70% of options expire worthless.
Use stop-loss and position sizing.

Long-Term Position TradingIntroduction
In the world of financial markets, traders and investors often debate between short-term opportunities and long-term wealth-building strategies. One of the most reliable and time-tested methods for wealth creation is long-term position trading. Unlike day trading or swing trading that rely on short-term price movements, long-term position trading is about identifying strong trends, quality assets, and holding positions for months or even years.
This strategy is closer to investing but still falls within the discipline of trading because it involves market timing, entry/exit strategies, risk management, and portfolio adjustments. Long-term position traders often aim to ride big moves, benefit from compounding, and avoid the stress of daily market noise.
In this guide, we’ll break down long-term position trading in detail—covering its philosophy, strategies, tools, pros & cons, and practical approaches to mastering it in the Indian and global markets.
Chapter 1: What is Long-Term Position Trading?
Long-term position trading is a trading approach where positions are held for extended periods—usually six months to several years—to benefit from large market trends.
Key features:
Time Horizon: Longer than swing trading (days/weeks), shorter than buy-and-hold investing (decades).
Objective: Capture major price trends (secular uptrends, super cycles, sectoral booms).
Approach: Fundamental and technical analysis combined to filter strong assets.
Risk Appetite: Medium to high, since market volatility must be tolerated.
In simple terms: A position trader says, “Instead of fighting intraday noise, I’ll enter into a fundamentally strong stock or asset during accumulation phases, and hold it through the bigger move until the trend matures.”
Chapter 2: Why Long-Term Position Trading Works
Trend Follower Advantage
Markets move in cycles: accumulation → uptrend → distribution → downtrend.
Long-term position traders focus on catching the uptrend phase that can deliver 100%–500% returns.
Less Noise, More Clarity
Daily fluctuations, news-driven volatility, and short squeezes matter less.
Weekly/monthly charts filter out the noise and highlight the real trend.
Compounding Effect
Holding quality stocks allows dividends + capital appreciation to compound over time.
Psychological Relief
No constant monitoring like intraday traders.
Stress-free decision-making with focus on big picture.
Alignment with India’s Growth Story
For Indian traders, position trading aligns with the India Growth Supercycle—rising middle class, infrastructure push, financialization, and technology adoption.
Chapter 3: Difference Between Position Trading and Other Strategies
Feature Intraday Trading Swing Trading Long-Term Position Trading Investing
Time Horizon Minutes/Hours Days/Weeks Months/Years 5–20+ Years
Focus Volatility Short Swings Major Trends Business Growth
Analysis Used Technical Technical Both (Fundamental + Technical) Fundamental
Stress Level Very High Moderate Low-Moderate Very Low
Return Style Small but frequent Medium Large but fewer Large, steady
Capital Requirement High Margin Medium Medium-High Any
Chapter 4: Foundations of Long-Term Position Trading
1. Fundamental Analysis
Position traders give importance to fundamentals because weak companies rarely sustain long-term rallies. Some factors:
Revenue Growth (10–20% CAGR stocks outperform).
Profit Margins (expanding margins are bullish).
Debt Levels (low-debt, high cash-flow firms are stable).
Moats (brand, patents, market leadership).
Macro Tailwinds (sectors aligned with government policies, global demand).
Example: In India, IT services (Infosys, TCS), FMCG (HUL), banking (HDFC Bank), and pharma (Sun Pharma) have rewarded long-term position traders massively.
2. Technical Analysis
Even long-term players need technicals to time entries. Tools include:
Moving Averages (50, 200 DMA crossovers for long-term trend).
Volume Profile (identifies accumulation/distribution zones).
Support & Resistance (monthly/weekly zones matter most).
Breakouts (multi-year consolidation breakouts often lead to huge rallies).
3. Macro & Sectoral Analysis
Long-term traders follow sectoral rotation. Capital flows from one sector to another, and identifying the next booming sector is critical. Example:
2003–2008: Infra & Real Estate Boom.
2010–2014: Pharma Rally.
2014–2019: NBFC & Banking Growth.
2020–2023: IT, Specialty Chemicals, PSU Banks.
Chapter 5: Tools & Indicators for Position Traders
Weekly & Monthly Charts – To identify primary trends.
Fibonacci Retracements – Entry zones after corrections in long-term uptrend.
Relative Strength Index (RSI) – To avoid overbought long entries.
MACD on Weekly – Trend confirmation.
Volume Profile – Shows institutional accumulation zones.
Fundamental Screeners – Tools like Screener.in, Tickertape, Trendlyne for Indian stocks.
Chapter 6: Step-by-Step Process of Long-Term Position Trading
Step 1: Market Outlook
Study global and Indian macro trends.
Identify strong themes: EV, renewable energy, banking digitization, infrastructure, AI.
Step 2: Stock Selection
Filter fundamentally strong companies.
Look for leaders in high-growth sectors.
Step 3: Technical Entry
Wait for breakout above multi-year resistance.
Confirm with volume surge.
Step 4: Position Sizing
Invest gradually (SIP mode into position trades).
Allocate 10–20% per stock in portfolio.
Step 5: Holding Discipline
Avoid reacting to minor news.
Focus on quarterly results and sectoral momentum.
Step 6: Exit Strategy
Sell when trend weakens (break below 200 DMA, falling growth).
Book profits in stages during euphoric rallies.
Chapter 7: Psychology of Long-Term Position Trading
Patience is Everything: Multi-year rallies test your patience.
Control Over News-Driven Fear: Ignore daily market noise.
Conviction in Research: Confidence comes from solid analysis.
Avoid Overtrading: Stick to your selected few winners.
Chapter 8: Risk Management
Even long-term traders need strict risk management:
Stop-Loss (Mental/Trailing): Place it below major support.
Diversification: Don’t put all in one sector.
Portfolio Review: Quarterly recheck.
Avoid Leverage: Margin positions don’t suit long-term holding.
Exit During Structural Shifts: If sector fundamentals collapse (e.g., telecom price wars killed many stocks).
Chapter 9: Real Examples of Position Trading
Indian Market
Infosys (1995–2020): ₹100 → ₹15,000+ (split-adjusted).
HDFC Bank: A long-term compounding machine with consistent growth.
PSU Banks: From 2020 lows to 2023, gave 300–400% returns as a sectoral play.
Global Market
Apple: From $1 in early 2000s to $200+.
Tesla: From $17 IPO to $1200 peak before split.
Amazon: One of the greatest position trades in history.
Chapter 10: Pros & Cons of Long-Term Position Trading
Pros
Stress-free compared to intraday.
Big reward potential.
Aligned with economic cycles.
Better for working professionals.
Cons
Requires patience.
Drawdowns can be painful (20–40%).
Needs deep research (time-consuming).
Black Swan events (COVID, global crisis) can hit hard.
Conclusion
Long-term position trading is not just about buying and holding. It’s about selecting the right stocks, entering at the right time, and having the patience to sit through volatility until the big trend matures. It’s a strategy that bridges the gap between short-term trading and investing, offering both the thrill of trading and the wealth-building potential of investing.
For Indian markets, with the growth supercycle unfolding, long-term position trading can be one of the most rewarding approaches for the next decade. The key lies in discipline, patience, and the courage to ride trends while ignoring short-term noise.
Paer 4 Learn Institutional Trading Options Trading Strategies
Basic Strategies
Long Call → Buy call, bullish.
Long Put → Buy put, bearish.
Covered Call → Own stock + sell call for income.
Protective Put → Own stock + buy put for protection.
Intermediate Strategies
Straddle: Buy Call + Put at same strike (bet on volatility).
Strangle: Buy Call (higher strike) + Put (lower strike).
Bull Call Spread: Buy low strike call + sell higher strike call.
Bear Put Spread: Buy put + sell lower strike put.
Advanced Strategies
Iron Condor: Range-bound strategy selling OTM call + put spreads.
Butterfly Spread: Profit from low volatility near strike.
Ratio Spreads: Adjust risk/reward with multiple options.
Margin Requirements & Leverage
Option buyers: Pay only premium (small capital).
Option sellers (writers): Need large margin (higher risk).
NSE SPAN + Exposure margin system determines requirements.
For example, selling 1 lot of Bank Nifty option may require ₹1.5–2 lakh margin depending on volatility.

Part 1 Candle Sticks PatternIntroduction to Options Trading
Options trading is one of the most flexible and powerful tools in the financial markets. Unlike stocks, where you simply buy and sell ownership of a company, options are derivative contracts that give you the right, but not the obligation, to buy or sell an underlying asset at a predetermined price within a specified time frame.
The beauty of options lies in their strategic possibilities — they allow traders to make money in rising, falling, or even sideways markets, often with less capital than buying stocks outright. But with that flexibility comes complexity, so understanding strategies is crucial.
Key Terms in Options Trading
Before we jump into strategies, let’s understand the key terms:
Call Option – Gives the right to buy the underlying asset at a fixed price (strike price) before expiry.
Put Option – Gives the right to sell the underlying asset at a fixed price before expiry.
Strike Price – The price at which you can buy/sell the asset.
Premium – The price you pay to buy an option.
Expiry Date – The date the option contract ends.
ITM (In-the-Money) – When exercising the option would be profitable.
ATM (At-the-Money) – Strike price is close to the current market price.
OTM (Out-of-the-Money) – Option has no intrinsic value yet.
Lot Size – Minimum number of shares/contracts per option.
Intrinsic Value – The real value if exercised now.
Time Value – Extra premium based on time left to expiry.

Trading Discipline with Biofeedback1. Introduction: Why Trading Discipline is Hard
In the world of financial markets, traders are constantly balancing analysis with emotion. Charts and data may look purely rational, but the human brain does not operate like a spreadsheet. Instead, traders face fear, greed, overconfidence, hesitation, and impulse — all in rapid cycles during market hours.
Trading discipline is the ability to execute a trading plan consistently, without being swayed by emotional impulses or external noise. It’s what separates a professional who survives years in the market from someone who burns out after a few months.
The challenge? Even the best-prepared trader can watch their discipline crumble in moments of market stress. This is where biofeedback comes in — a method for measuring and controlling physiological responses to improve self-control and decision-making under pressure.
2. What is Biofeedback in the Context of Trading?
Biofeedback is a technique where you use electronic monitoring devices to measure physiological functions — like heart rate, breathing rate, muscle tension, skin conductance, and brainwave activity — and then use that real-time data to learn how to control them.
In trading, biofeedback can help you:
Recognize early signs of stress before they impact your judgment.
Maintain an optimal arousal level for peak performance.
Train your nervous system to remain calm in volatile situations.
Develop habits that strengthen mental resilience over time.
Example:
A trader using a heart rate variability (HRV) monitor might notice their HRV drops significantly before a losing trade — a sign of rising stress. With practice, they can use breathing techniques to restore calm and prevent impulsive decisions.
3. The Science Behind Biofeedback for Traders
3.1. The Stress-Performance Curve
This is based on the Yerkes–Dodson Law, which shows that performance improves with physiological arousal — but only up to a point. Too little arousal (low alertness) leads to sluggish reactions; too much (high anxiety) causes poor judgment.
Biofeedback helps traders stay in the optimal performance zone — alert but calm.
3.2. Physiological Markers in Trading
When you place a trade or watch a volatile market, your body activates the sympathetic nervous system ("fight-or-flight" mode):
Heart rate increases → decision-making becomes reactive.
Breathing shortens → oxygen supply to the brain decreases.
Skin conductance rises → higher sweat response from stress.
Muscle tension increases → physical discomfort, fatigue.
Brainwaves shift → from alpha/theta (calm focus) to high beta (stress).
This physiological shift can override logic. Biofeedback helps you detect these changes before they hijack your behavior.
3.3. Neuroplasticity and Habit Formation
Biofeedback training taps into neuroplasticity — the brain’s ability to rewire itself through repeated experience. By pairing specific mental states (calm focus) with trading activities, you strengthen neural pathways that make discipline more automatic.
4. Why Discipline Breaks in Trading
Even with a perfect trading plan, discipline often fails because:
Emotional Hijacking — The amygdala overrides rational thought under stress.
Overtrading — Dopamine-driven urge to "chase" trades after wins or losses.
Loss Aversion — The tendency to avoid losses at all costs, leading to holding losers too long.
Confirmation Bias — Seeking only information that supports your existing trade.
Fatigue — Poor sleep or extended screen time reduces impulse control.
Biofeedback directly addresses points 1 and 5, and indirectly helps with the rest by improving awareness and emotional regulation.
5. Types of Biofeedback Tools for Traders
5.1. Heart Rate Variability (HRV) Monitors
Function: Measures beat-to-beat variations in heart rate.
Why it’s useful: Higher HRV = greater resilience and adaptability to stress.
Popular devices: Polar H10, Whoop, Elite HRV, Oura Ring.
5.2. Electroencephalography (EEG) Headsets
Function: Measures brainwave activity (alpha, beta, theta, gamma).
Why it’s useful: Identifies mental states — e.g., focus, relaxation, distraction.
Popular devices: Muse, Emotiv Insight.
5.3. Skin Conductance Sensors
Function: Measures electrical conductance of skin (linked to sweat response).
Why it’s useful: Early indicator of stress before conscious awareness.
Popular devices: Empatica E4, GSR2.
5.4. Breathing Feedback Devices
Function: Tracks breathing rate and depth.
Why it’s useful: Calm, diaphragmatic breathing maintains optimal arousal levels.
Popular devices: Spire Stone, Breathbelt.
5.5. Multi-Sensor Platforms
Combine HRV, skin conductance, temperature, movement, and EEG for a full picture.
Often integrated with mobile apps that guide breathing, meditation, or cognitive training.
6. The Biofeedback-Discipline Loop for Traders
Here’s how biofeedback fits into a trader’s workflow:
Baseline Measurement
Monitor your physiological state during calm, non-trading hours.
Establish "normal" HRV, heart rate, and brainwave patterns.
Stress Mapping
Record your physiological data during live trading.
Identify patterns before, during, and after trades — especially losing streaks.
Intervention Training
Use breathing, mindfulness, or focus exercises to restore optimal state.
Repeat until the intervention becomes automatic.
Real-Time Application
Wear biofeedback devices during trading.
Take action the moment stress markers exceed thresholds.
Review and Adjust
Analyze post-trade logs for emotional triggers and physiological patterns.
Update your discipline strategy accordingly.
7. Biofeedback Training Protocol for Traders
Phase 1: Awareness (2–3 Weeks)
Goal: Understand your physiological reactions to market events.
Action Steps:
Wear HRV and skin conductance sensors during trading.
Log market conditions and emotional states alongside data.
Identify recurring "stress spikes" and the situations causing them.
Phase 2: Regulation (3–4 Weeks)
Goal: Learn to control physiological stress responses.
Techniques:
Coherent Breathing: Inhale for 5.5 seconds, exhale for 5.5 seconds.
Progressive Muscle Relaxation: Tense and release muscles from head to toe.
Alpha Wave Training: Use EEG feedback to enter calm, focused states.
Phase 3: Integration (Ongoing)
Goal: Make emotional regulation part of your trading routine.
Action Steps:
Pre-market: 5 minutes of HRV breathing.
During trading: Monitor stress markers, take breaks if needed.
Post-market: Review biofeedback logs and trade journal together.
8. Case Studies
Case Study 1: The Impulsive Scalper
Problem: A day trader entered trades too quickly after losses, leading to overtrading.
Biofeedback Insight: HRV dropped sharply after losing trades; breathing became shallow.
Solution: Implemented 3-minute breathing reset after each loss. Over 6 weeks, reduced revenge trades by 70%.
Case Study 2: The Swing Trader with Exit Anxiety
Problem: Took profits too early due to fear of reversals.
Biofeedback Insight: EEG showed increased beta waves when price approached target.
Solution: Practiced alpha-wave breathing before exit decisions. Result: Average holding time increased by 15%, boosting profits.
Case Study 3: The New Trader with Market Open Stress
Problem: Felt overwhelmed at the opening bell, making erratic trades.
Biofeedback Insight: Skin conductance spiked dramatically at market open.
Solution: Added 10 minutes of pre-market meditation and HRV training. Result: 40% fewer impulsive trades in the first 30 minutes.
9. Advantages of Biofeedback for Trading Discipline
Objective self-awareness: Replaces guesswork with measurable data.
Prevents emotional spirals: Stops small mistakes from snowballing.
Speeds up learning: Accelerates habit formation for calm decision-making.
Customizable: Can be adapted to each trader’s unique stress patterns.
Integrates with trading journal: Creates a full picture of both mental and market performance.
10. Limitations and Considerations
Cost: High-quality devices can be expensive.
Learning curve: Requires time to interpret data and apply techniques.
Over-reliance: Biofeedback should enhance, not replace, psychological skill-building.
Privacy: Data storage should be secure, especially with cloud-based apps.
Conclusion
Trading discipline is not just a mental skill — it’s a mind-body skill. Biofeedback bridges the gap between the psychological and physiological sides of trading performance. By learning to recognize and control your body’s stress responses, you can keep your decision-making sharp, your execution consistent, and your emotions balanced even in high-pressure market environments.
Over time, biofeedback training rewires your nervous system for resilience, turning discipline from a constant battle into a natural, automatic state. And in the competitive world of trading, that could be the difference between long-term success and early burnout.
Part 8 Trading Master ClassProtective Put
When to Use: To insure against downside.
Setup: Own stock + Buy put option.
Risk: Premium paid.
Reward: Stock can rise, but downside is protected.
Example: Own TCS at ₹3,000, buy 2,900 PE for ₹50.
Bull Call Spread
When to Use: Expect moderate rise.
Setup: Buy lower strike call + Sell higher strike call.
Risk: Limited.
Reward: Limited.
Example: Buy 20,000 CE @ ₹100, Sell 20,200 CE @ ₹50.
Bear Put Spread
When to Use: Expect moderate fall.
Setup: Buy higher strike put + Sell lower strike put.
Risk: Limited.
Reward: Limited.

Part 2 Master Candlesticks PatternHow Options Work in Trading
Imagine a stock is trading at ₹1,000.
You believe it will rise to ₹1,100 in a month. You could:
Buy the stock: You need ₹1,000 per share.
Buy a call option: You pay a small premium (say ₹50) for the right to buy at ₹1,000 later.
If the stock rises to ₹1,100:
Stock profit = ₹100
Call option profit = ₹100 (intrinsic value) - ₹50 (premium) = ₹50 net profit (but with much lower capital).
This leverage makes options attractive but also risky — if the stock doesn’t rise, your premium is lost.
Categories of Options Strategies
Options strategies can be divided into three main categories:
Directional Strategies – Profit from price movements.
Non-Directional (Neutral) Strategies – Profit from sideways markets.
Hedging Strategies – Protect existing positions.
