Wyckoff Accumulation Schematic Explained - Reliance IndustriesThe Wyckoff Method is a time-tested framework that helps traders understand how smart money accumulates shares before a major price rally. Let’s break down the key events using the marked chart of Reliance Industries Limited.
📉 Phase A – Stopping the Downtrend
1. PS (Preliminary Support):
This is where big players start showing interest after a long downtrend. You’ll notice volume picks up and the price starts slowing its fall.
➤ On the chart: PS shows the first signs of buyers stepping in.
2. SC (Selling Climax):
Panic selling reaches its peak. Weak hands exit, and professionals absorb the supply. A sharp bounce follows.
➤ Big red candle with huge volume followed by a reversal – classic SC behavior.
3. AR (Automatic Rally):
With selling exhausted, the price bounces up sharply. This defines the top of the trading range.
➤ You can see this strong bounce right after the SC.
4. ST (Secondary Test):
Price comes back to test the SC zone to check if selling pressure is still strong. Low volume here means the worst is over.
➤ ST on the chart dips near the SC area but doesn’t break it with force.
🌊 Phase B – Building the Cause (Sideways Movement)
This is where the stock moves sideways within a range. Institutions quietly accumulate more without alerting the market.
5. Creek:
A resistance trendline formed by the highs within the trading range. The price will eventually need to “jump the creek” to show strength.
➤ In the chart, the Creek forms a ceiling for price action.
🌱 Phase C – Testing the Market (Spring Time)
6. Spring / Shakeout:
A fake breakdown below support to trap weak hands. Smart money uses this dip to accumulate more.
➤ Two Springs are marked on the chart, with Spring 2 acting as the final test with low volume.
🚀 Phase D – The Markup Begins
7. JAC (Jump Across the Creek):
Price breaks through the Creek with strong volume and wide candles.
➤ Shown by the steep breakout after Spring 2.
8. SOS (Sign of Strength):
Price rises rapidly with strong volume. Confidence builds among traders.
➤ Seen as a clear upward rally with big green candles.
9. LPS (Last Point of Support):
Price pulls back slightly to test old resistance (now support) with lower volume.
➤ Seen as a mild dip after the SOS.
📈 Phase E – Price Markup
This is where the real trend begins. A series of higher highs and higher lows confirm that smart money has finished accumulating, and the public starts entering.
➤ The current uptrend with bullish candles and strong momentum reflects Phase E.
✅ Summary (In Simple Words)
Preliminary Support (PS): This is the first area where we see signs of buying after a strong downtrend. It indicates that some large players might be stepping in quietly.
Selling Climax (SC): This is the panic point. The price falls sharply, and retail investors sell in fear. But this is where professionals start buying aggressively.
Automatic Rally (AR): With the panic selling done, price bounces up quickly. This bounce sets the top boundary of the trading range.
Secondary Test (ST): Price comes back down to test the SC zone. If the volume is lower and price doesn’t fall much, it confirms that selling pressure has reduced.
Spring or Shakeout: A fake breakdown below the bottom of the range. It shakes out weak hands and gives professionals a chance to buy more at lower prices.
Sign of Strength (SOS): A strong breakout above resistance, with wide price bars and good volume. This shows that demand is now in control.
Last Point of Support (LPS): A pullback after SOS, where price retests the breakout level but on low volume. This is a low-risk entry point for long positions.
Many times exact labeling is difficult, so a trader should focus more on underlying concept instead of labeling.
🧠 Key Takeaway
This schematic shows how big players accumulate quietly before driving prices higher. Recognizing this pattern early can give traders a major edge in identifying low-risk, high-reward trades.
This post is a tutorial and not a trading advise.
Trade ideas

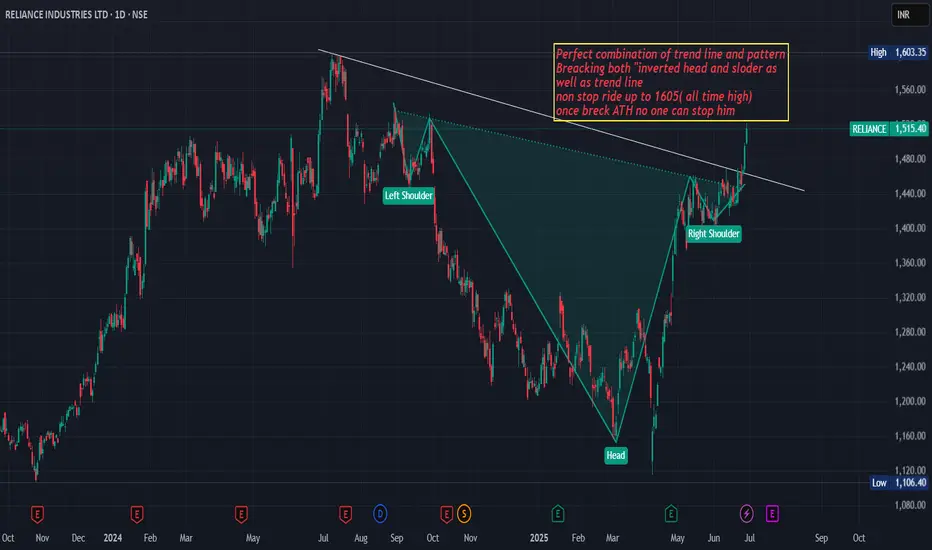
Realiance ind .Set to make now all time highPerfect combination of trend line and pattern
Breacking both "inverted head and sloder as
well as trend line
nonstop ride up to 1605(all time high)
once breck ATH no one can stop him
Reliance Long _ Bullish FlagReliance Long:
Breakout from Bullish Flag with decent volume.
tomorrow might be a pull back. Watch this space.
Enter long only when the price is favorable in the
lower timeframe

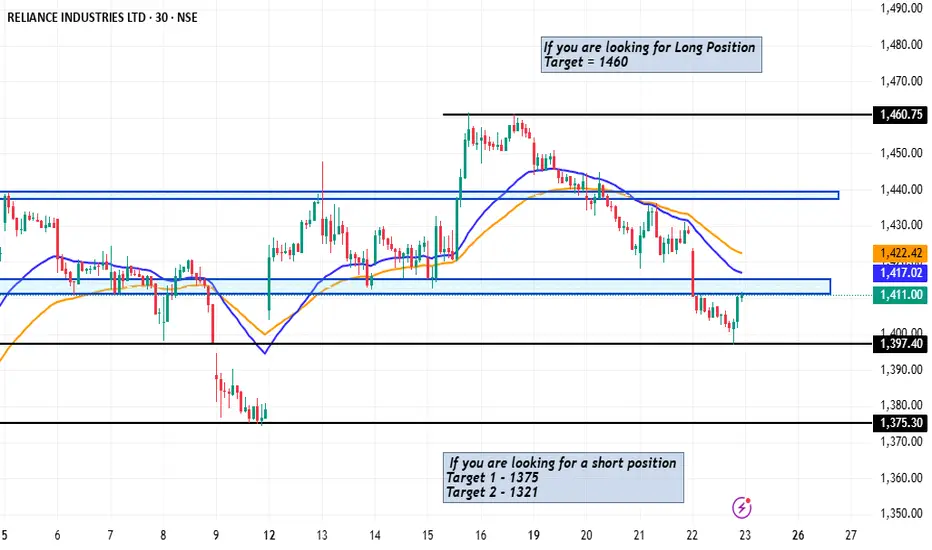
Reliance Industries View Both Long and Short positionHey Trader's and Investor's
Look the Pattern seen in Reliance Industries Here are some Chart pattern i share with you all guys
Note : I am not a SEBI Registered .. Please plan a trade or Investment based on your research and knowledge
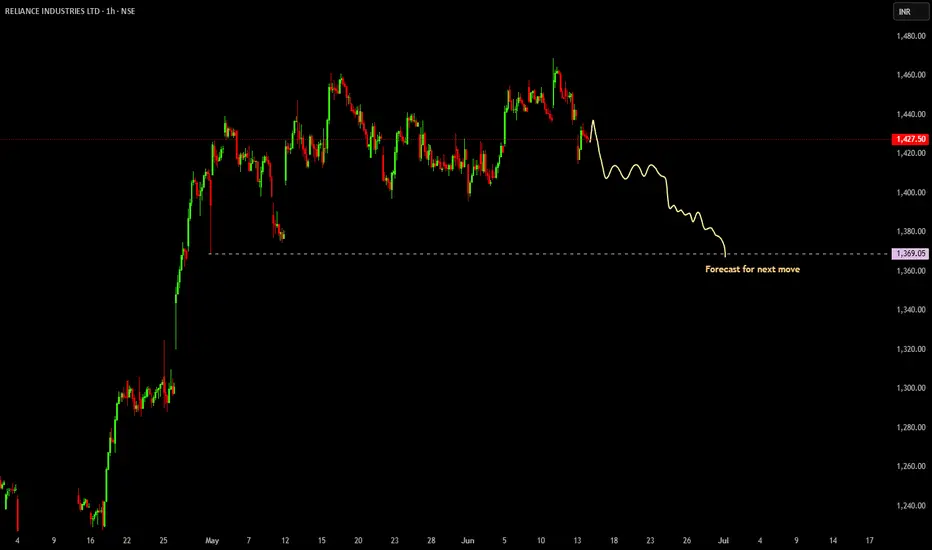
Reliance bearishReliance 1450 has completed distribution and has turned bearish.
We expect it will drop to 1421,1398,1305 in coming days.

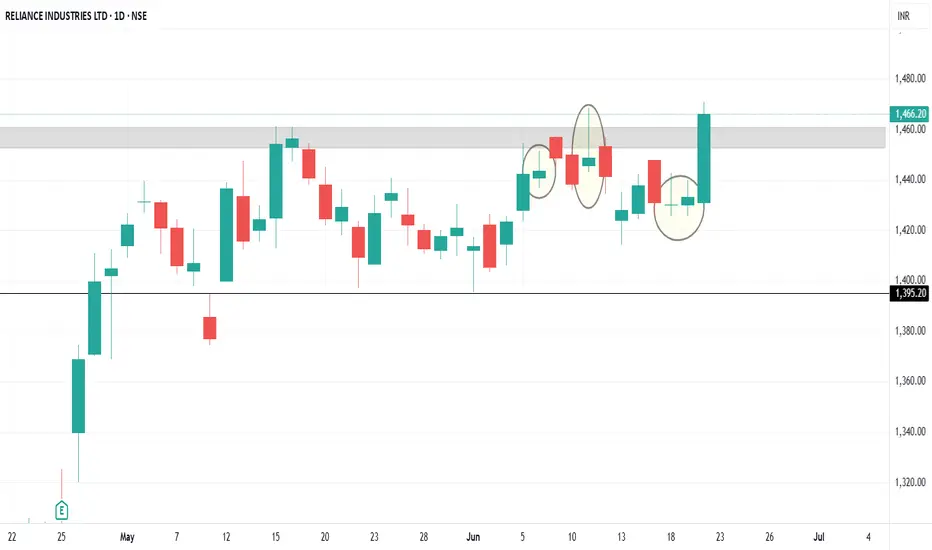
Reliance Breakout or FakeReliance 1466 though showing breakout in charts ,we believe it could be a fake.
In last 3 attempts buyers interest was very much weak.
So To trap the call writers and left over weak buyers SM could have carried the last friday move. Few more attempts may be carried to wash out completely the weak buyers and the price will then drop to 1439.
RELIANCE INDUSTRIES LTD – Breakout on Big VolumesRELIANCE INDUSTRIES LTD – Breakout on Big Volumes | BTST + Swing Trade Setup
CMP: ₹1,466.20 | Chart: 15-min | Date: June 22, 2025
📌 Observations:
Explosive breakout candle in the final 15 mins: ₹1,455 → ₹1,471
Backed by massive volume spike (10.14M) — highest in recent sessions
Broke past multi-day resistance zone of ₹1,450–₹1,455
Currently retraced slightly to ₹1,466 — profit booking, not rejection
📈 RSI (15-min): Approaching overbought zone (~72–75), but with price confirming strength
✅ Not a reversal yet — signifies momentum. Pullbacks may offer re-entry.
📊 Levels to Watch
Support Zones:
₹1,455 – Breakout support
₹1,440–₹1,445 – Demand zone
Resistance / Targets:
₹1,472 – Intraday high
₹1,490 – Near-term target
₹1,500 – Major swing resistance
🔔 Trade Setup
🔹 BTST Play
🎯 Target: ₹1,475–₹1,480
🛑 SL: ₹1,455
✅ Entry: CMP or small dip
🔹 3–5 Day Swing
🎯 Target 1: ₹1,490
🎯 Target 2: ₹1,500
🛑 SL: ₹1,439
📈 Reward–Risk: Solid 1:2+ setup
🧠 Summary
✅ Breakout confirmed with volumes
✅ RSI supports the move
✅ Strong base formed at ₹1,445
⚠️ Watch ₹1,475 zone for continuation or exhaustion signs
📅 Review After: 9:45 AM, June 23
📉 Invalidation Below: ₹1,455
#Reliance #BTST #SwingTrade #Breakout #VolumeAnalysis #RSI #NSE #TradingViewIndia #MomentumStocks

RelianceIn smaller time frame, price has broken the consolidation zone and moving up. 1440 is the support of the consolidation. In one day time frame, price has taken triple bottom support and moving up.
Buy above 1460 with the stop loss of 1444 for the targets 1476, 1488,1502 and 1530.
Always do your own analysis before taking any trade.

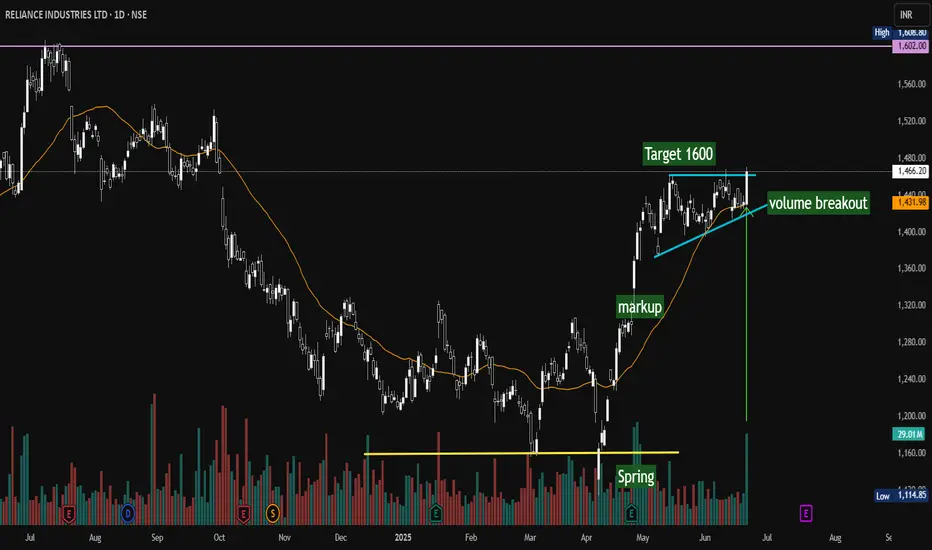
Reliance Daily - Volume Break outReliance Industries Ltd. – Daily Chart Analysis and Trade Idea
The chart depicts a strong bullish setup for Reliance Industries on the NSE with a clear volume breakout confirming upward momentum. Key observations include:
Spring Base Formation: The price formed a solid base around the 1160 level (highlighted in yellow), acting as a springboard for the recent uptrend.
Markup Phase: Following the spring, the stock entered a decisive markup phase, driven by increasing buying interest and positive momentum.
Volume Breakout: Recently, a significant surge in volume accompanied the price breakout above a rising trendline support (blue), indicating strong buyer conviction.
Target Price: Based on the current price action and breakout strength, the target is set at 1600, offering a compelling upside potential.
Moving Average Support: The orange line representing the moving average provides dynamic support, validating the bullish trend continuation.
This technical setup suggests a strong buying opportunity with favorable risk-reward dynamics, provided the volume breakout sustains and the stock holds above the rising support line.
Reliance is about to give a good ImpulseReliance industries has been trading in a really good continuing triangle pattern , based on the broad market outlook there's a very high possibility we can see a break out on the upside.

Market correction pattern I have visually made an indication that this stock will high likely will move further down ward
till the overall market makes an reversal sign
This is an unfolding pattern in 5 waves
Good luck
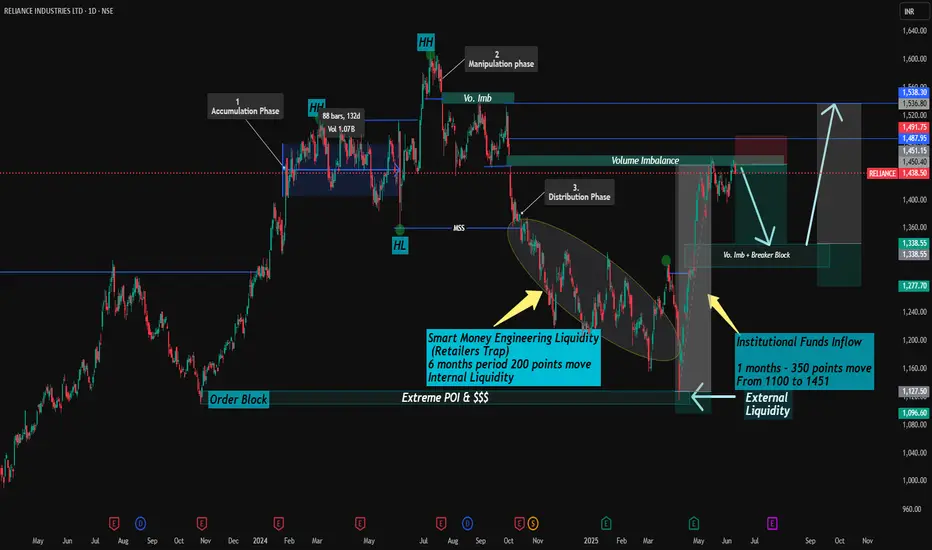
Reliance industries ltd. Deep AnalysisSharing my Analysis on Reliance (RIL). (Only for Education Purpose)
This analysis is based on Higher Time Frame (Daily)
Past Move scenario ----
1. If we see on chart, after 3rd oct. 2024, Price has completed major liquidity sweep below internal lows followed by Market Structure Shift (Marked as MSS) and for that it took 6 months.
2. After that External liquidity sweep been performed near to 1100 levels which is also marked as Extreme POI which triggered an impulse move of 350 points with funds inflow which pushed price to 1451 levels. (Here it just took 1 months only)
Current Move Scenario ----
===upside there we saw volume imbalance + Breaker block where price is making resistance or rejecting upside move.
(Potential Short Term Supply Zone 1450-1488 levels)
Expected Short Term Bias ---
Downside levels --- 1335 (Breaker Block + Discount Zone)
Upside Resistance ---- Cross of Order block range 1496
Expected Long Term Bullish Bias -- Likely after Retracement to downside Vo. Imbalance and + Breaker block
Re-Entry Long Zone - 1335-1350
Upmove expected to 1500 Imbalance levels
above that Final External Liquidity zone to 1560
Steps --- Accumulation ---Expansion ---Re accumulation, targeting External Liquidity.
Everything mentioned on chart itself.
{Above Views are only for Education purpose and do not consider it as any Advisory. Consult your Financial Advisor before investments in any securities.}
YOur Views or Comments are Welcomed.
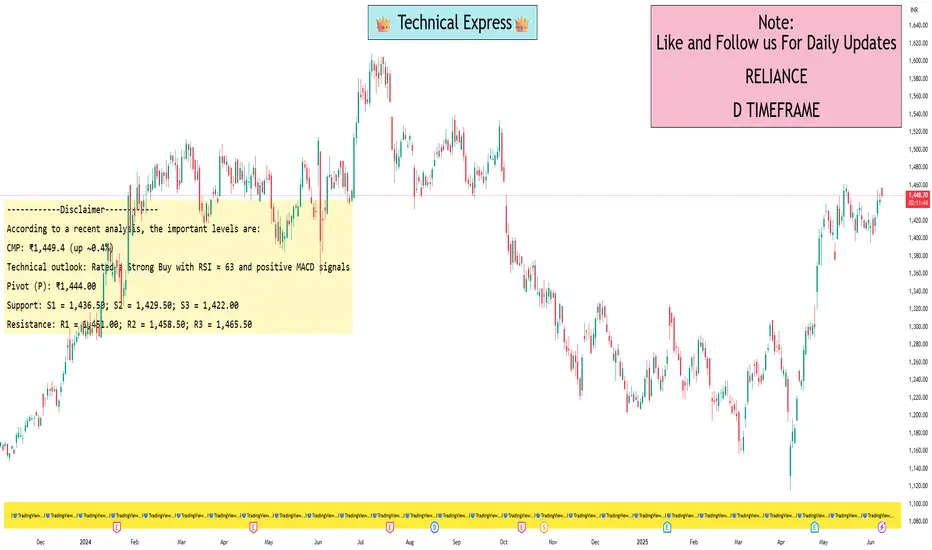
Reliance levels for swing tradingAccording to a recent analysis, the important levels are:
Current Price & Context
-- CMP: ₹1,449.4 (up ~0.4%)
-- Technical outlook: Rated a Strong Buy with RSI ≈ 63 and positive MACD signals
Pivot & CPR Levels
Daily (Classic) Pivot Points
Pivot (P): ₹1,444.00
Support: S1 = 1,436.50; S2 = 1,429.50; S3 = 1,422.00
Resistance: R1 = 1,451.00; R2 = 1,458.50; R3 = 1,465.50
Daily CPR:
Bottom Central (BC) = 1,444.25
Central = 1,444.00
Top Central (TC) = 1,443.75
Weekly Pivot Points
Pivot: ₹1,431.27
Support: S1 = 1,407.83; S2 = 1,372.17
Resistance: R1 = 1,466.93; R2 = 1,490.37
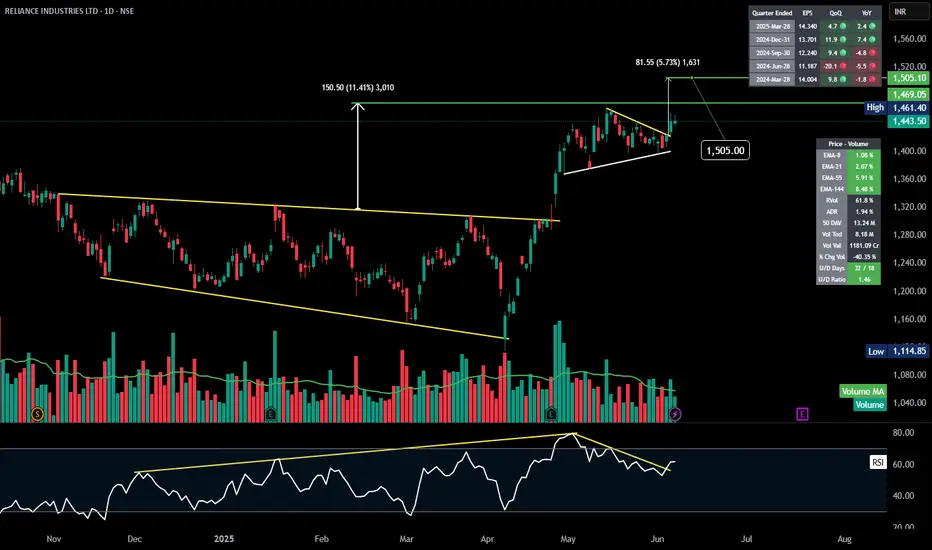
RELIANCE | Symmetrical Triangle | Breakout | Daily Here’s a detailed technical analysis of **Reliance Industries Ltd (RELIANCE)** based on the images you provided:
---
### 📊 **1️⃣ Pattern Overview:**
* **Falling Wedge Pattern:**
* A large falling wedge spanning several months from 2024 to early 2025, clearly visible in the first set of images.
* The stock broke out of the wedge in April-May 2025, leading to a significant up-move.
* **Continuation Triangle Pattern:**
* Post breakout, the stock formed a symmetrical triangle (or continuation pennant) in late May to early June 2025.
* The stock has just broken out of this consolidation, suggesting a continuation of the uptrend.
---
### 📈 **2️⃣ Key Levels:**
* **Breakout Levels:**
* Falling Wedge breakout: Around **1,300**
* Continuation Triangle breakout: Around **1,443.50 - 1,461.40**
* **Current Price:** **1,443.50**
* **Measured Move Targets:**
* Wedge depth measured move: \~**150.50 points** (11.41%)
* Continuation triangle target: \~**81.55 points** (5.73%)
* **Price Targets:** **1,505.00** and possibly **1,531 - 1,540** based on the continuation move.
---
### 💡 **3️⃣ Indicators & Confirmation:**
* **Volume:**
* Noticeable volume spikes during breakouts, confirming strong buying interest.
* Post-breakout consolidation volumes have been healthy (lower, indicating accumulation).
* **RSI:**
* Divergence in RSI before the wedge breakout (lower lows in price, but not in RSI – bullish divergence).
* Currently, RSI is bouncing back from around 60, supporting continued bullish momentum.
* **EMA Analysis:**
* EMA-8, EMA-21, EMA-55, EMA-144 all sloping up, indicating strong trend alignment.
* EMA-8 and EMA-21 holding as dynamic support, especially on the 1,443 breakout.
---
### ⚙️ **4️⃣ Key Support and Resistance:**
* **Supports:**
* 1,443-1,461 zone: Breakout levels and EMA cluster support.
* 1,300 zone: Former wedge breakout level and major pivot support.
* **Immediate Resistance:**
* 1,505.00 (immediate price target)
* Followed by 1,531-1,540 zone.
---
### 🚦 **5️⃣ Risk Management / Trade Strategy:**
* **Stops:**
* Conservative stop-loss: Below 1,443 (immediate breakout zone).
* Wider stop-loss: Below 1,400 (where EMA-21 is likely to support).
* **Entry:**
* Re-entry on pullbacks to breakout levels (1,443-1,461) with tight risk control.
* **Upside Potential:**
* Short-term: 1,505
* Medium-term: 1,540 zone
---
### 🔍 **Summary:**
✅ **Bullish Wedge breakout** has been confirmed and has driven the stock significantly higher.
✅ **Continuation triangle breakout** at 1,443-1,461 zone suggests further upside to 1,505 and 1,540.
✅ RSI, volume, and EMAs align with a continued bullish bias.
---
💬 **Would you like me to draft a YouTube video script, a trading plan document, or a social media post for this analysis? Let me know! 🚀**
Basic to Advance in Trading Understand market trends and patterns.
Use risk management strategies, like setting stop-loss orders.
Focus on liquid assets with high volume.
Keep emotions in check and stick to a trading plan.
Limit the number of trades to manage risk.
Constantly educate yourself on market dynamics and trading strategies.

RelianceIn lower time frame as well as higher time frame, price is at support. Range has formed in between 1440 - 1460.
Buy above 1440 with the stop loss of 1430 for the targets 1452, 1466, 1478 and 1492.
Price is bullish as long as it sustains above 1400.
If price breaks the support in lower time frame chart that is 1430 - 1440, then it will take support at 1400.
Always do your own analysis before taking any trade.

Management and Psychology Trading psychology is the emotional component of an investor's decision-making process, which may help explain why some decisions appear more rational than others. Trading psychology is characterized primarily by the influence of both greed and fear. Greed drives decisions that might be too risky.

Candlestick Pattern part 2Candlestick patterns are a visual representation of price movement in financial markets, used in technical analysis to identify potential trend reversals or continuations. These patterns are formed by the opening, closing, high, and low prices of a financial instrument over a specific period. They are like signals on a chart that can help traders make informed decisions about buying or selling.

Reliance Industries Limited (RIL)Overview of Reliance Industries Limited (RIL) :
Reliance Industries, led by Mukesh Ambani, is India’s largest company by market capitalization, operating in sectors like energy, petrochemicals, telecom (Reliance Jio), retail, and new energy. It’s headquartered in Mumbai and is a global leader, ranking 21st by net worth ($118 billion) as of April 2025.
Latest News and Updates (as of June 3, 2025) :
Market Performance and Valuation:
Reliance Industries remains India’s most valued company, though its valuation dropped by Rs 7,645.85 crore to Rs 19,22,693.71 crore recently, amid weak equity market trends.
Despite this, RIL’s stock shows a bullish outlook, supported by strong fundamentals. Analysts note a mildly bullish to bullish sentiment, with potential for recovery.
Over the past year, RIL’s stock declined by 1.62%, underperforming the Sensex’s 9.57% return. However, its year-to-date return of 16.62% outperformed the Sensex’s 4.47%.
In April 2025, RIL shares surged nearly 4% after reporting a 2.4% rise in Q4 FY25 net profit, reaching Rs 19,407 crore, driven by strong telecom and retail performance.
Financial Highlights (Q4 FY25, ending March 31, 2025):
Consolidated revenue reached Rs 1,071,174 crore ($125.3 billion), up 7.1% year-on-year, fueled by consumer businesses (Jio and retail) and oil-to-chemicals (O2C).
Net profit rose 2% to Rs 19,407 crore, with annual net profit at Rs 81,309 crore. RIL became the first Indian company to cross Rs 10 lakh crore in total equity.
The company announced a Rs 5.50 dividend per share.
Brokerages like Nomura, Jefferies, and Morgan Stanley raised price targets (up to Rs 1,710), citing growth in retail, telecom, and potential Jio IPO.
Business Developments:
New Energy Investments: RIL plans to invest Rs 75,000 crore ($9 billion) in new energy, focusing on solar module production. It commissioned a gigawatt-scale HJT solar module line with up to 720-watt-peak modules and aims for 10 GW capacity, potentially expanding to 20 GW.
Telecom (Reliance Jio): Jio added 21.74 lakh wireless subscribers in March 2025, reaching a total of 46.97 crore subscribers.
Petrochemical Expansion: RIL is investing Rs 75,000 crore in petrochemical projects to strengthen its core business.
Offshore Loan: RIL secured a $2.9 billion dual-currency offshore loan, the largest by an Indian firm in over a year, signaling strong global lender confidence.
Stake Sale in Asian Paints: RIL is reportedly planning to sell its 4.9% stake in Asian Paints, held for 17 years, amid rising competition in the paint industry.
Defence Partnership: Reliance Defence signed an MoU with Germany’s Rheinmetall for ammunition production, including a new manufacturing facility in Maharashtra.
Operation Sindoor Controversy: RIL withdrew its application to trademark “Operation Sindoor” for entertainment purposes after backlash, as it was linked to a military operation.
Strategic Moves:
Anant Ambani was appointed executive director of RIL for five years, signaling a generational shift.
RIL approved raising up to Rs 25,000 crore through bonds.
The company is scaling up its FMCG business, now India’s eighth largest, and expanding its shipping business with a 10% stake in Nauyaan Shipyard.
Analyst Outlook :
Citi, Nomura, and Jefferies highlight near-term triggers: Jio’s potential IPO, tariff hikes, new energy scale-up, and retail growth.
Despite challenges in the oil-to-chemicals sector due to low margins, RIL’s diversified portfolio and operational discipline drive optimism

PCR Trading Strategy The Put-Call Ratio (PCR) is a valuable tool for traders to gauge market sentiment and potentially identify opportunities. It's calculated by dividing the total open interest of put options by the total open interest of call options. A higher PCR (above 1) suggests bearish sentiment, while a lower PCR (below 1) indicates bullish sentiment.

Support and Resistance part 1In trading, support and resistance levels are significant price points where a price tends to stop and reverse direction. Support acts as a price floor, indicating strong buying interest that prevents further declines. Resistance, on the other hand, is a ceiling, where selling pressure halts upward movement.

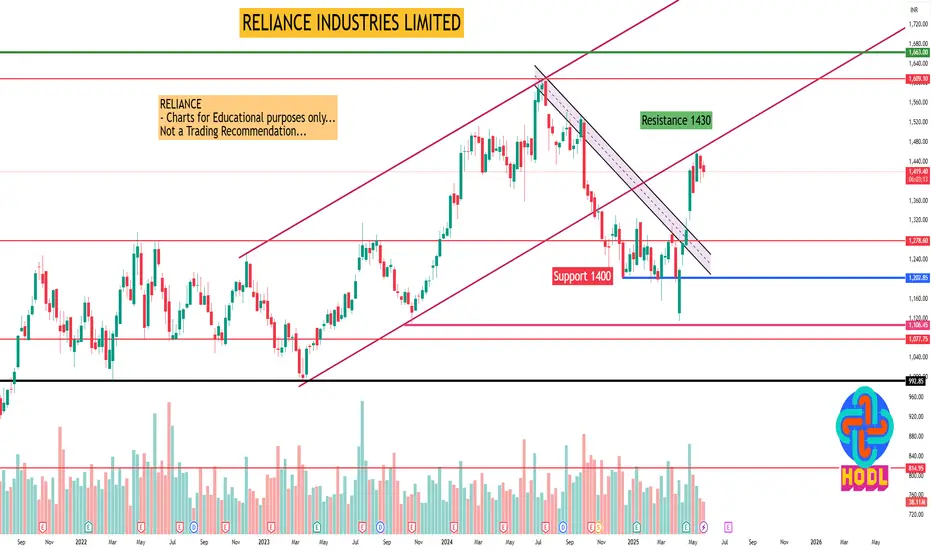
RELIANCE INDUSTRIES LIMITEDReliance Industries Ltd view for Intraday 29th May #RELIANCE
Resistance 1430 Watching above 1432 for upside momentum.
Support area 1400 Below 1410 ignoring upside momentum for intraday
Watching below 1397 for downside movement...
Above 1410 ignoring downside move for intraday
Charts for Educational purposes only.
Please follow strict stop loss and risk reward if you follow the level.
Thanks....
Support and Resistance part 2ASupport is a price point below the current market price that indicate buying interest. Resistance is a price point above the current market price that indicate selling interest. S&R can be used to identify targets for the trade. For a long trade, look for the immediate resistance level as the target.
