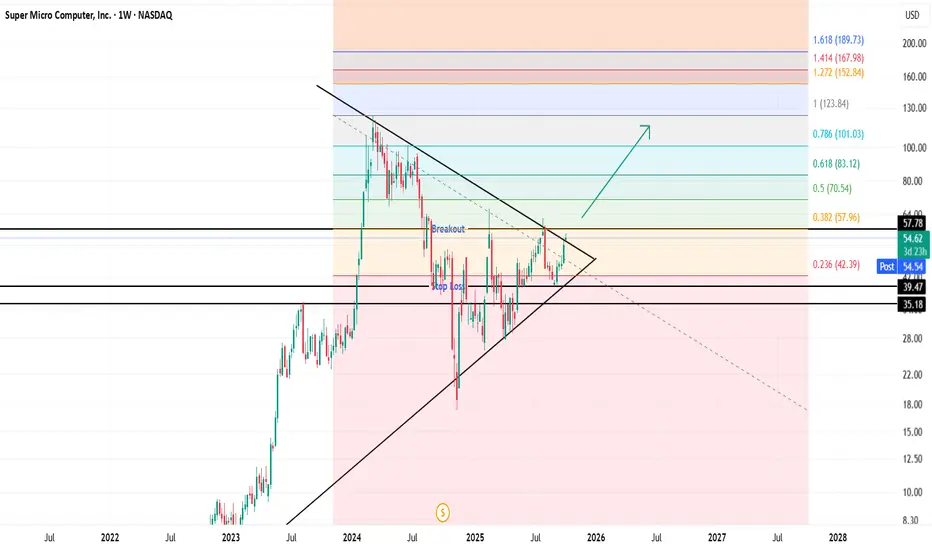
SMCI - Symmetrical Triangle Breakout SetupSMCI is at a major decision point. Wait for breakout confirmation above $57.78, use the triangle structure and Fibonacci extensions as your target zones, and manage risk via the marked stop levels. This technical setup combines classical charting with quantitative projections, providing a clear framework for swing traders and investors.
Key Levels and Setup
Symmetrical Triangle: Price is consolidating between converging trendlines, now nearing the apex, signaling an imminent breakout move.
Breakout Level: A sustained close above $57.78 (upper trendline/horizontal resistance) would confirm the bullish breakout.
Stop Loss: Clearly marked near the lower horizontal line (below $39.47 or $35.18) to protect against false breakouts.
Trade ideas
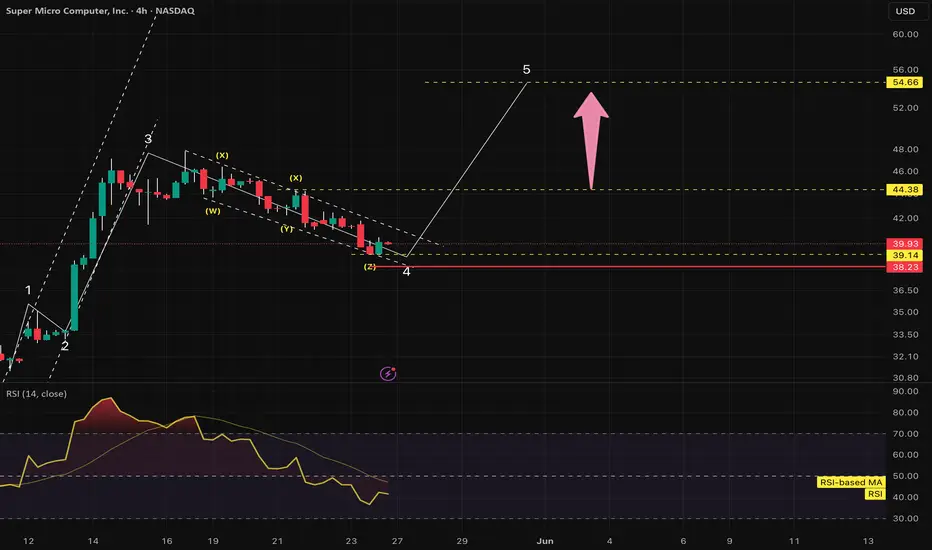
SMCI short term Target of 54SMCI has been correcting in a complex zig-zag correction.
It has completed triple Zig-Zag, correction seems over as per Wave-3 max pull back and seems to be headed towards 54 in short time, provided some conditions are met.
Conditions:
a) Correction should stop at around this level or can go max till ~38.23, what it means is, price damage should stop, we may still correct in horizontal way not breaking price of approx 38.23.
b) We need fast re-tracement of price towards ~44.40
If above is satisfied, entry at 44.40 for a target of 54 is a good probabilistic trade.
When set up gets invalid ?
When price breaks and closes below 38.23 on 4hr closing candle basis.
SMCI at Key Technical Juncture Post-EarningsThe stock has experienced significant volatility recently, influenced by broader market dynamics and company-specific developments.
Key Support Levels:
$39.02: This intraday low serves as immediate support. A decline below this level could signal further downside potential.
$37.90: Aligning with the 50-day moving average, this level offers additional support.
$35.00: A psychological support level that, if breached, may indicate a more pronounced bearish trend.
Key Resistance Levels:
$43.46: The intraday high represents immediate resistance. A break above this level could suggest renewed bullish momentum.
$45.00: A near-term resistance point that, if surpassed, may lead to further gains.
$50.00: A significant psychological barrier and a key resistance level.
Despite recent challenges, including stock sales by senior officers and previous financial reporting issues, Super Micro Computer maintains strong demand for its AI server products. Traders should closely monitor these support and resistance levels, as movements beyond these points could signal significant shifts in market sentiment. Implementing prudent risk management strategies, such as setting stop-loss orders and appropriate position sizing, is advisable given the current market volatility.
In summary, while Super Micro Computer faces technical challenges, its solid fundamentals and market position suggest potential for recovery. Vigilance in monitoring key levels and broader market conditions will be essential for traders navigating this dynamic landscape.

SMCI's technical point potential bullish phase CMP $36 Key resistance levels to monitor include $46, where selling pressure may emerge, aligning with the 200-day moving average. A decisive move above these levels could lead to a rally toward $64. Conversely, support is observed around $35.50, which may serve as a potential entry point for investors.
The chart suggests that SMCI may have completed an intermediate corrective wave (4), characterized by an ending diagonal in wave E. This pattern indicates a potential bottoming, setting the stage for an impulsive wave (5) upward and currently fiercely running in its 3rd wave, which might be halting around $46

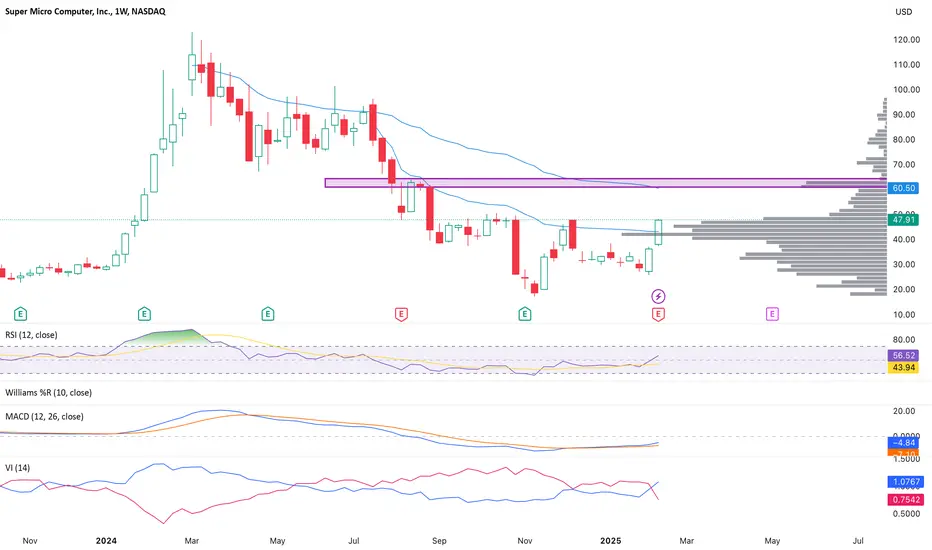
SMCI heading towards $60SMCI is heading towards $60 as it weekly candle has crossed above 50 EMA, RSI is well above 50, MACD is curling up and most importantly, it's sitting well above the decent support stack.
SMCI | Short Term | 70% ReturnCMP: 42.28
Target: 83
Return: 70%
Time: 1-6 months
Watchout volume and retest in the breakout area (Daily/Weekly/Monthly)

Super Micro Computer (SMCI) – Testing Key Resistance, Breakout 📈 NASDAQ: SMCI | CMP: $40.28 | Target: $50 - $69 | SL: $30
🔍 Analysis:
Super Micro Computer (SMCI) is showing a strong recovery from its recent lows near $18.76. The stock has been in an uptrend and is now testing the key resistance level at $50.02. A breakout above this level could trigger a strong upside move.
Key Levels:
✅ Support: $18.76 (previous bottom)
✅ Resistance: $50.02 (breakout zone)
✅ Target 1: $50
✅ Target 2: $69
✅ Long-term Target: $121
Technical Indicators:
✅ Price breaking downward trendline – Bullish signal
✅ Trading above 50 EMA – Indicates strength
✅ Increasing volume – Accumulation before breakout
✅ MACD turning bullish – Momentum shifting up
💡 Trade Plan:
Entry: Above $50 on breakout confirmation
Stop-Loss: Below $30
Target 1: $50
Target 2: $69
Long-Term: $121
🚀 If SMCI breaks $50 with volume, expect a strong move toward $69+ in the coming weeks. Keep this on your watchlist!
📊 Like & Share if you find this analysis useful! 🔥📈

SMCI looks going for reversal trend
Monthly RSI at about 50% level looks good for reversal signal
William fix bottom indicator shows max volume been form
Fibonacci retracement about 80% and stop volume recently

SMCI inverse head and shoulder at 470a long can be initiated on smci at 465-475 levels for target of 540 570 levels keeping sl of around 435-440 levels

WALMART: Bearish: Overbought alert: Impact on Dow JonesWALMART: Bearish: Overbought alert: Impact on Dow Jones
Be careful with Walmart as you can see cocoa and st microelectronic also rose to very very high historical levels and look at the correction that we had immediately after at least 40% drop
This action can have a significant impact on the Dow Jones
A strong correction could lower the DJIA index
I alert you on this I alert you especially on the notion of "stock market cycle" and "seasonality"
Walmart is overbought you just have to look at your technical indicators RSI, ROC, Stochastic, exponential moving average, Ichimoku, Fibonacci retracement.
We could go much much lower so be careful this action is overbought
Monitor your above-mentioned indicators.

SMCI Lower TF levelsgo thru the chart & combine it with what I said on the H1 chart that I published just before this.

SMCI BIAS & trade ideaJust look at the chart I shared & I will post Lower TF entry levels as well if anyone's interested in that as well.

$SMCIA good range breakout after multiple months with an open range breakout. The stock seems determined to go on to make new year highs from here with morning volumes being really blistering. The earnings negative reaction in mid-August now seems negated.
