Analysis of subsequent gold price trends!Market News:
In early Asian trading on Wednesday (September 10), London gold prices fluctuated downward, currently trading around $3,621 per ounce. After hitting a record high of $3,674, the spot price plummeted nearly $50, ultimately ending the day in the red. International gold prices have recently seen a sharp rise, with some investors taking profits ahead of the release of key US inflation data, triggering a pullback from their highs. Although the revised employment data released by the US Department of Labor fell short of market expectations, gold buyers took advantage of the opportunity to take profits. The rebound of the US dollar index from a seven-week low and US Treasury yields from a near five-month low also made gold buyers cautious. Furthermore, the continued rise of US stocks to new record highs has slightly weakened gold's safe-haven demand. Investors are currently awaiting US producer price data (PPI) to be released on Wednesday and consumer price data (CPI) to be released on Thursday, hoping for clues on further interest rate cuts before next week's Federal Reserve meeting. These data are expected to provide new guidance for gold prices.
Technical Analysis:
Gold closed with an inverted hammer candlestick pattern on the daily chart. After hitting a record high of 3674 following yesterday's US market data, the price, as expected, capitalized on the data to drive selling, resulting in the largest single-day correction since August 20th. The daily chart currently maintains an ascending channel buying trend. The 10-day and 7-day moving averages remain open and rising to 3550/3590, while the New York closing price remains above the 5-day moving average of 3605. After the RSI indicator on the four-hour chart reached overbought levels above 80, gold prices followed the expected surge and then retreat to a correction, falling back to 3623 in late trading. However, gold prices remain within the upper Bollinger Bands, with the moving averages converging. The main strategy for gold trading today is to see wide range fluctuations, with selling high and buying low as a strategy. The initial intraday range is 3610/3660. Overall, gold is expected to experience repeated high-level fluctuations in the short term, and any strong rebound may not be sustainable. If this week's correction breaks below the strong support of $3,600 and further declines, we will need to adjust our strategy!
Trading Strategy:
Short-term gold buy at 3,603-3,606, stop loss at 3,595, target at 3,640-3,660;
Short-term gold sell at 3,650-3,653, stop loss at 3,662, target at 3,620-3,600;
Key Points:
First Support Level: 3,612, Second Support Level: 3,603, Third Support Level: 3,590
First Resistance Level: 3,650, Second Resistance Level: 3,663, Third Resistance Level: 3,676
CFDGOLD trade ideas

Caution ahead of US PPI report | Priority on Sell setups🟡 XAU/USD – 10/09 | Captain Vincent ⚓
🔎 Captain’s Log – Market Context
US 10-year bond yields rebound, signaling the market is awaiting key inflation data.
At 07:30, US PPI report will be released – a crucial figure that could strongly influence FED rate expectations.
Investors are also eyeing US CPI in the coming days to assess the inflation outlook.
The US Supreme Court accepted Trump’s appeal, but this news has not yet had a notable impact on Gold.
⏩ Captain’s Summary: Ahead of inflation data, Gold often tends to correct lower due to cautious sentiment.
📈 Captain’s Chart – Technical Analysis
Storm Breaker (Key Resistance):
Bearish OB: 3654 – 3660 (short-term upper cap)
ATH Watchtower: 3700 – 3702 (Sell Zone – possible new ATH test)
Golden Harbor (Strong Support):
Buy Zone: 3601 – 3602
OB Dock: 3582 – 3585
Currently, price is around 3640 – 3645, after a technical rebound from support. High probability that Gold will retest nearby resistance before a downward correction.
🎯 Captain’s Map – Trade Scenarios
⚡ Quick Boarding (SELL – Daily Priority)
Entry 1: 3654 – 3660
SL: 3668
TP: 3654 → 3650 → 3618 → 3610
Entry 2 – ATH Test: 3701 – 3703
SL: 3711
TP: 3688 → 3675 → 3665 → 365x
✅ Golden Harbor (BUY – Only at deep support)
Buy Zone: 3601 – 3603
SL: 3592
TP: 3610 → 3620 → 3630
⚓ Captain’s Note
“The golden ship faces turbulent seas today as it sails near Storm Breaker 🌊 (3654 – 3660) . Before the fierce winds called US PPI , sailors should prioritize dropping anchor with short-term SELL positions at resistance. Golden Harbor 🏝️ (3601 – 3603) remains a safe haven below, but only when the ship corrects deeply should it dock. On this voyage, Quick Boarding 🚤 is for scalp maneuvers, while the main current is still steered by the stormy waves of inflation.”

XAU/USD – Captain Vincent Update | 15m Outlook🔎 Captain’s Log – Market Structure
On the 15-minute timeframe (M15) , price just formed a Break of Structure (BoS) above the previous accumulation zone → confirming temporary control by the Buy side.
However, the Bearish Order Block (H1 Zone) around 3655 is being tested, marking a key resistance area.
📈 Captain’s Chart – Bullish Scenario
If price holds above the OB zone 3644 – 3655 , buying pressure may continue to push the ship toward the Weak High 3674 .
Further ahead, the next destination is Storm Breaker Peak (3701 – 3708) – where strong selling reactions are expected.
📉 Captain’s Chart – Bearish Scenario
After sweeping liquidity and touching the Storm Breaker (Sell Zone) , Gold may reverse lower.
Key level to monitor: OB 3644 . If this area breaks, the market could open a deeper bearish leg.
🎯 Captain’s Map – Key Levels
Golden Harbor (Support) : 3644 – 3655 (OB retest zone)
Target (Bullish) : 3674 → 3701 – 3708
Storm Breaker (Sell Zone) : 3701 – 3708
Invalidation : Break below 3644 opens a new bearish journey
⚓ Captain’s Note
“The Golden sails have just caught new wind after a BoS , showing that the captain and crew still hold a short-term advantage. Golden Harbor 🏝️ (3644 – 3655) is the key dock to sustain the bullish trend. If Gold clears the Weak High 3674 , the ship may head straight to Storm Breaker 🌊 (3701 – 3708) , where reversal waves are likely to rise. While the short-term tide remains bullish, Storm Breaker still hides major risks – sailors must sail with strict risk management discipline.”

Short Goldbullish Gartley pattern is in making so target will be 3607.72 and if fails to go up as it is making on top then next target will be 3566.25. lets see.

XAUUSD Gold Trading Strategy September 10, 2025XAUUSD Gold Trading Strategy September 10, 2025: Gold stabilized after falling from yesterday's new high, the market will focus on US inflation data in the final period of the week from today.
Fundamental news: Investors will now turn their attention to US inflation data, scheduled for release on Wednesday and Thursday. Inflation data will be of particular interest following weak employment data ahead of the Federal Reserve's monetary policy announcement next week.
Technical analysis: After gold prices made a new all-time high at $3,675/ounce, prices corrected to the 362x area and increased again as we predicted earlier. The MA lines still maintain support for the price, however, yesterday's correction has reduced the previous strong increase. We continue to trade according to the main trend: waiting for a trading point at the support area combined between MA and FVG. In addition, the next profit-taking phase may occur unexpectedly, to avoid this risk we must ensure to maintain the trading principle.
Important price zones today: 3615 - 3620, 3595 - 3600 and 3660 - 3665.
Today's trading trend: BUY.
Recommended orders:
Plan 1: BUY XAUUSD zone 3615 - 3617
SL 3612
TP 3620 - 3630 - 3650 - 3660.
Plan 2: BUY XAUUSD zone 3595 - 3597
SL 3592
TP 3600 - 3610 - 3630 - 3660.
Plan 3: SELL XAUUSD zone 3663 - 3365
SL 3668
TP 3660 - 3650 - 3630 - 3600. (small volume).
Wish you a safe, effective and profitable trading day.💯💯💯💯💯

Gold 1H – Buy the Dip, Watch 3,687 Premium SupplyOn the 1-hour chart, Gold is trading above 3,650 after a clear break of structure. Price has created demand footprints near 3,636 and deeper at 3,594, while resistance is seen around 3,670 and premium supply is at 3,687–3,689. This indicates a possible engineered retracement into discount demand zones before a move towards liquidity above 3,688.
📌 Key Structure & Liquidity Zones (1H):
• 🔼 Buy Zone 3,636 – 3,634 (SL 3,630): Fresh demand block in line with bullish flow.
• 🔼 Buy Zone 3,594 – 3,592 (SL 3,587): Deeper discount demand, strong base for buyers.
• 🔽 Sell Zone 3,687 – 3,689 (SL 3,694): Premium supply zone, possible liquidity sweep.
📊 Trading Ideas (Scenario-Based):
🔺 Buy Setup – Demand Block Reaction
• Entry: 3,636 – 3,634
• Stop Loss: 3,630
• Take Profits:
TP1: 3,650
TP2: 3,665
TP3: 3,680+
👉 Expect retracement into discount demand before price continues bullish.
🔺 Buy Setup – Deeper Demand Test
• Entry: 3,594 – 3,592
• Stop Loss: 3,587
• Take Profits:
TP1: 3,610
TP2: 3,625
TP3: 3,640+
👉 Best for swing buyers seeking higher risk-reward on a deeper liquidity grab.
🔻 Sell Setup – Premium Rejection
• Entry: 3,687 – 3,689
• Stop Loss: 3,694
• Take Profits:
TP1: 3,670
TP2: 3,655
TP3: 3,640
👉 Short-term liquidity grab at premium levels, good only for scalping with strict risk.
🔑 Strategy Note
Overall bias remains bullish, but smart money may push price into 3,636 or even 3,594 demand zones before expanding higher. Safer setups are buying dips; short positions at 3,687 should be treated only as quick scalps.

XAUUSD Gold Trading Strategy September 10, 2025XAUUSD Gold Trading Strategy September 10, 2025: Gold stabilized after falling from yesterday's new high, the market will focus on US inflation data in the final period of the week from today.
Fundamental news: Investors will now turn their attention to US inflation data, scheduled for release on Wednesday and Thursday. Inflation data will be of particular interest following weak employment data ahead of the Federal Reserve's monetary policy announcement next week.
Technical analysis: After gold prices made a new all-time high at $3,675/ounce, prices corrected to the 362x area and increased again as we predicted earlier. The MA lines still maintain support for the price, however, yesterday's correction has reduced the previous strong increase. We continue to trade according to the main trend: waiting for a trading point at the support area combined between MA and FVG. In addition, the next profit-taking phase may occur unexpectedly, to avoid this risk we must ensure to maintain the trading principle.
Important price zones today: 3615 - 3620, 3595 - 3600 and 3660 - 3665.
Today's trading trend: BUY.
Recommended orders:
Plan 1: BUY XAUUSD zone 3615 - 3617
SL 3612
TP 3620 - 3630 - 3650 - 3660.
Plan 2: BUY XAUUSD zone 3595 - 3597
SL 3592
TP 3600 - 3610 - 3630 - 3660.
Plan 3: SELL XAUUSD zone 3663 - 3365
SL 3668
TP 3660 - 3650 - 3630 - 3600. (small volume).
Wish you a safe, effective and profitable trading day.💯💯💯💯💯

XAUUSD: Breaking Through ResistanceXAUUSD is currently trading within a clear uptrend channel, with strong support at 3,620. The 1-hour chart shows that gold has bounced strongly from this support level, confirming that the uptrend remains intact. With support from EMA 34 and EMA 89, XAUUSD is likely to continue its upward momentum and target higher levels.
The current uptrend channel shows the price is moving within a clearly defined range, with higher lows consecutively forming. The next resistance is at 3,680, and if gold breaks through this level, it could extend its rise toward higher targets. The 3,620 level remains a crucial support, and as long as the price stays above this level, the chances of further increases are high.
Impact of News
With the forecasted PPI dropping from 0.9% to 0.3%, this could reduce inflation expectations and weaken the USD, providing favorable conditions for gold to continue rising.

XAUUSD 1H📍 XAUUSD – 1H Key Levels
🔹 Support Zones
$1925 – $1927 → Immediate intraday support
$1918 – $1920 → Stronger short-term support
$1910 – $1912 → Major support zone, breakdown could trigger deeper fall
🔹 Resistance Zones
$1935 – $1937 → First intraday resistance
$1945 – $1947 → Strong resistance area where sellers may re-enter
$1955 – $1960 → Major resistance; breakout above this can fuel a larger rally
⚖️ Quick Summary
Above $1935, bulls may push toward $1945 – $1960.
Below $1920, bears could drag price back to $1910 – $1900.
Range to monitor: $1920 – $1935 (decisive breakout will set next trend).
XAUUSD (Gold) – 1H Chart Analysis
🔹 Trend Overview
On the 1-hour chart, XAUUSD is currently showing short-term bullish bias but with nearby resistance.
Price action is making higher lows, but upside moves are facing supply zones.
🔹 Key Levels to Watch
Immediate Support Zone: $1918 – $1922
Major Support: $1910 – $1912
Immediate Resistance Zone: $1935 – $1940
Stronger Resistance: $1950
🔹 Indicators (1H Chart)
Moving Averages → Price trading above 20 EMA and near 50 EMA, showing short-term strength.
RSI (Relative Strength Index) → Around 60–65, leaning bullish but not overbought.
MACD → Positive crossover, momentum favoring buyers.
Volume → Buying volume spikes at dips, showing accumulation.
🔹 Intraday Trading Scenarios
Bullish Case
If price sustains above $1935, upside can extend to $1945 – $1950.
Breakout above $1950 opens path toward $1960+.
Bearish Case
If price drops below $1922, retracement towards $1912 – $1910 is possible.
Strong breakdown below $1910 may test $1900.
🔹 Summary
Bias: Mildly Bullish (as long as above $1920 support)
Support Levels: $1922 / $1910
Resistance Levels: $1935 / $1950
Traders should watch the $1920 – $1935 zone for the next decisive move.

XAUUSD – Trend Outlook Ahead of PPIXAUUSD – Trend Outlook Ahead of PPI
Hello Traders,
Gold has moved close to the Fibonacci 2.618 extension and immediately reacted at this level. Price has already broken through the most recent minor low of the previous uptrend, which in my view indicates a violation of the bullish structure. For a confirmed shift in trend, another leg would be needed to form a more sustainable structure. Still, the basis for a sell bias is already present.
Fundamental Factor
The US PPI data is due today, with forecasts at 0.3% compared to 0.9% previously. If this projection turns out correct, gold could see another strong upward push. However, my view is that the data may not be as weak as expected, so traders should carefully observe the market reaction to the release before making entries.
Key Levels to Watch
3660: This level could be tested again and provide another reaction before a potential downward move begins. It remains the most attractive zone for initiating sell positions.
3318: Should gold confirm a Dow-style lower structure and break past old support, the deeper downside target may lie around this region.
Trading Strategy
The main strategy for today is to look for sell opportunities:
Best entry area: around 3660, if price retests and reacts.
Strong confirmation: once a candle closes below previous support, short positions can be taken with targets further down.
For intraday traders, scalping opportunities may be considered within the corrective range left from the US session yesterday, as the market redistributes price action.
This is my outlook on gold for today – use it as a reference and align it with your own strategy.

Gold Breaks $3,600/oz: Fed Rate Cut Hype & Trading Setups!Namaste, traders! Gold (XAU/USD) has blasted through $3,600/oz for the first time on Monday (08/09/2025), smashing a new all-time high as weak US jobs data ramps up bets for a Fed rate cut next week. With a massive 38% YTD gain after 27% in 2024, gold's on fire—driven by a weakening USD, central bank hoarding, easing policies, and global uncertainty. For Indian investors, this is prime time amid rising demand and INR volatility. Let’s analyze today’s (09/09/2025) market and spot trading opportunities! 💰
Fundamental Analysis: Why Gold’s Rally Is Unstoppable 🌟
Historic Break: Weak US jobs (August growth slowed, unemployment at 4.3%) has markets pricing in an 88% chance of 0.25% rate cut and 12% for 0.5% in September, per CME FedWatch. Low rates slash the opportunity cost for non-yielding gold—perfect for India’s festive season buys! 📈
Expert View: Peter Grant from Zaner Metals sees gold hitting $3,700–$3,730/oz short-term, with dips as buy chances. Ongoing labor weakness and Fed easing into 2026 will keep supporting it.
Global Boosters: China’s PBOC extended gold buys to 10 months in August. Falling USD and 10-year Treasury yields near 5-month lows make gold even more attractive for Indian rupee holders.
Data Watch: Eye US PPI (10/09) and CPI (11/09) for Fed clues. Tariff wars and geopolitics add safe-haven fuel—great for India’s gold ETFs and physical demand.
Gold’s your ultimate hedge in this setup—will the Fed’s cut keep the party going for Indian portfolios?
Technical Analysis: Breakout Frenzy with Traps—Buy the Dips! 📉
Gold’s power surge blew past 3600 with no brakes, but eye the Fibo 2.618 at 3685 for a possible breather. Bullish momentum screams BUY, but watch FVG traps from the fast climb. Key focus: 3641—break below pulls back to 3600; hold above and bulls target 3685. Ideal for Indian traders riding the rupee-gold link!
Key Resistance: 3663 - 3673 - 3685 - 3690
Key Support: 3641 - 3629 - 3596 - 3581
Trading Opportunities:
Sell Scalp: 3673 - 3675
SL: 3679
TP: 3670 - 3665 - 3660 - 3655
Sell Zone: 3684 - 3686
SL: 3694
TP: 3676 - 3666 - 3656 - 3646 - Open
Buy Scalp: 3641 - 3639
SL: 3635
TP: 3644 - 3649 - 3654 - 3659
Buy Zone: 3605 - 3603
SL: 3595
TP: 3613 - 3623 - 3633 - 3643 - Open
Gold’s breaking out big, but traps await—confirm at key levels! Holds support? Bulls aim for 3685. 📊💡
#Gold #XAUUSD #Fed #USJobs #TradingView #MarketUpdate #Forex #Investing #TechnicalAnalysis #GoldTrading #Finance #Crypto #IndiaTrading #INR #MCX

Bearish Today's candle close is very important for short term reversal in gold if it break below yesterday's low & close below it
Then we can say gold momentum is slow

Gold: Eyeing a Break Above 3,600Hello everyone, gold is approaching a critical juncture where both fundamentals and technicals appear aligned in favour of further upside.
Weak US labour data combined with growing expectations of a Fed rate cut in September have weighed on yields and the dollar, creating a supportive backdrop for gold. The next key catalysts lie in US inflation prints (CPI/PPI). As long as easing expectations dominate, the metal enjoys a clear tailwind.
From a technical perspective, the bullish structure remains intact: price is holding firmly above the Ichimoku cloud with solid demand layers at 3,565–3,555 and 3,545–3,535. The 3,595–3,600 zone is the immediate psychological barrier, yet selling pressure looks insufficient to derail the trend.
My view: gold is likely to push through 3,600 soon, extending towards 3,615–3,630, with potential to reach 3,650 if momentum holds.
Do you think gold will clear 3,600 decisively this week? Share your thoughts below.

Gold Cooling Off After ATH Consolidation or Correction?Gold cooled off a bit after hitting a fresh ATH around 3675, right near the monthly R3 level. This pullback, however, looks more like a healthy breather than any real weakness, since the key 3600 support is still holding strong. Right now, price is taking support around 3620–25, and bulls are doing a good job defending this zone. As long as this area stays intact(H4 close), the higher-high structure remains valid, meaning gold can easily revisit 3650 or even push back toward the highs.
For now, we can say this as a normal pullback within the trend rather than a reversal. To call it a reversal, we need to see a lower high form on the higher timeframes. Until that happens, some sideways consolidation here makes sense, with 3600 being the big level to keep an eye on for any breakdown.

Gold Trading Strategy for 10th September 2025📊 Trading Plan (For Educational Purpose Only)
🟢 Buy Setup (Long Trade)
Condition to Enter:
Wait for a 1-hour candle to close above $3650.
Only buy if the candle closes above this level.
Entry Price: Above the high of that 1-hour candle.
Targets:
Target 1 → $3660
Target 2 → $3670
Target 3 → $3680
Stop Loss (SL): Place SL just below $3640 (or last swing low).
🔴 Sell Setup (Short Trade)
Condition to Enter:
Wait for a 15-minute candle to close below $3609.
Only sell if the candle closes below this level.
Entry Price: Below the low of that 15-minute candle.
Targets:
Target 1 → $3595
Target 2 → $3580
Target 3 → $3568
Stop Loss (SL): Place SL just above $3620 (or last swing high).
⚠️ Disclaimer
This trading plan is shared only for educational purposes. It is not financial advice. Trading in the stock market/crypto/commodities involves risk, and you should do your own analysis or consult a financial advisor before placing trades. Never risk money you cannot afford to lose.

Gold prices are expected to fluctuate significantly: 3660-3600.Gold prices are expected to fluctuate significantly: 3660-3600.
Gold bulls clearly took advantage of today's positive news to take profits, causing the price to drop sharply by nearly $50.
Gold prices are likely to fluctuate significantly in the coming days.
Intraday Strategy:
SELL: 3645-3650
SL: 3660
TP: 3635-3628-3615-3600
The above strategy is suitable for intraday trading. Contrarian short selling depends on market sentiment, which in turn determines the intraday trend of gold prices.
When short selling, it is important to remain vigilant and exit as soon as profits are seen.
As shown in Figure 2h:
Gold's key support area is around 3628-3630.
The key turning point for gold prices is in the 3580-3600 range.
The market is likely to continue to fluctuate widely over the next day, with a high probability of repeated fluctuations and momentum accumulation, making trading more difficult. I believe that over the next few days, we should focus on key support and resistance levels to buy low and sell high.
Gold prices may struggle to reach 3670+ in the short term.
The likely range of fluctuation is 3600-3660.
A wide range of fluctuations is the most reasonable approach to future gold price trends.

Gold Bearish View As Gold is higly voliatile , It could make or break any level. As per analysis I have a view and take it if it suits .
Keep going with flow.
Target1 3612
Target2 3597

Gold Plan - Waiting for a pullback to Buy safely | New ATH ahead🟡 XAU/USD – 09/09 | Captain Vincent ⚓
🔎 Captain’s Log – News Context
FED : The probability of a September rate cut is now almost certain, reinforcing confidence that flows will continue moving into Gold.
Dollar : Dropped to a 7-week low due to FED rate cut expectations, adding further support for Gold.
US Economic Data : No major news today, the market focus remains on interest rates.
⏩ Captain’s Summary: Gold remains in a strong uptrend. However, Vincent advises waiting for a pullback into support to Buy safely , avoiding chasing price at higher levels.
📈 Captain’s Chart – Technical Analysis
Storm Breaker (Resistance / Sell Zone) :
Quick Boarding: 3654 – 3656 (Short-term Sell scalp)
Storm Breaker Peak: 3673 – 3675 (Sell zone – potential new ATH)
Golden Harbor (Support / Buy Zone) :
Buy Scalp Dock: 3615 – 3617
Main Golden Harbor: 3597 – 3599 (Strong support)
Price structure remains bullish after multiple BOS – Break of Structure. Current highs may trigger short-term profit-taking waves before Gold pulls back to Golden Harbor and then rallies toward ATH 367x .
🎯 Captain’s Map – Trade Scenarios
✅ Golden Harbor (BUY – Priority with trend)
Buy Scalp: 3615 – 3617 | SL: 3598 | TP: 3620 → 3623 → 3626 → 3630 → 36xx
Main Buy Zone: 3597 – 3599 | SL: 3589 | TP: 3660 → 3663 → 3666 → 3670 → 36xx
⚡ Quick Boarding (SELL Scalp – Only at resistance)
Sell Zone 1: 3654 – 3656 | SL: 3662 | TP: 3650 → 3647 → 3644 → 3640 → 36xx
Sell Zone 2 – Storm Breaker Peak (ATH test): 3673 – 3675 | SL: 3682 | TP: 3670 → 3667 → 3664 → 3660 → 36xx
⚓ Captain’s Note
“The interest rate winds from the FED continue to power the Golden sails. Golden Harbor 🏝️ (3597 – 3599) is the safe haven for sailors trusting the bullish tide. Quick Boarding 🚤 (3615 – 3617) is just a short ride before the voyage resumes. Storm Breaker 🌊 (3654 – 3675) may bring big waves, but it’s only suitable for technical scalps – as the main current still carries Gold toward new highs.”

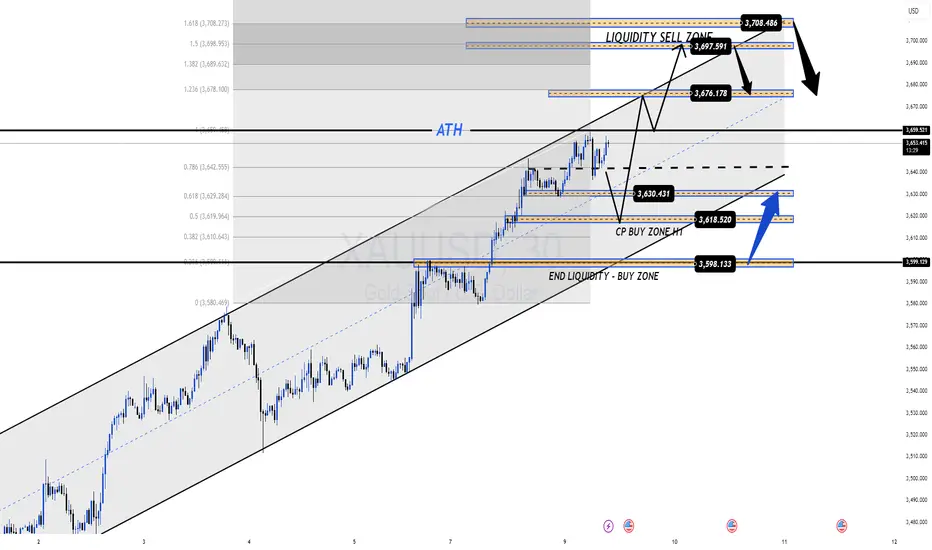
XAUUSD – Intraday Plan: Bullish Trend + Key Liquidity ZonesMarket Pulse:
The US jobs data (05/09) showed a slowdown in hiring. According to CME FedWatch, there is an 88% chance of a 0.25% Fed rate cut in September, and 12% for a 0.5% cut. Lower rates support gold as a non-yielding asset.
Gold has already gained 38% YTD, after rising 27% in 2024. A weaker USD, central bank buying (China added gold for the 10th month in a row in August), loose monetary policy, and global risks keep gold in a strong bullish trend.
👉 Market bias: Macro + liquidity flows favour BUY.
Technical View (M30):
Price stays in an up channel, making higher lows.
3616–3596 is the key support zone.
Liquidity SELL zones at 3653–3655 and 3675–3677 may give short intraday pullbacks before trend continues.
Execution Plan (Today):
🔵 BUY ZONE #1: 3618 – 3616
SL: 3610
TP: 3624 → 3630 → 3635 → 3640 → 3650 → 3660 → 3670+
🔵 BUY ZONE #2: 3598 – 3596
SL: 3590
TP: 3602 → 3606 → 3610 → 3615 → 3620 → 3630 → 3640 → 3650+
🔴 SELL ZONE #1: 3653 – 3655
SL: 3660
TP: 3648 → 3644 → 3640 → 3635 → 3630 → 3620
🔴 SELL ZONE #2: 3675 – 3677
SL: 3681
TP: 3670 → 3665 → 3660 → 3650 → 3640
Summary:
✅ Gold trend stays bullish – best setups are buying dips into liquidity zones.
⚡ Intraday scalps possible at SELL liquidity zones.
👉 Follow MMFLOW TRADING for daily precision setups.
Gold: Positive Momentum with Room Towards 3,700Gold continues to draw strength from supportive fundamentals. Rate cut expectations in the US remain strong, while steady inflows into low-cost ETFs are reinforcing the longer-term bullish case. In Asia, weaker GDP data from Japan and disappointing trade numbers from China have added to safe-haven demand.
On the 2H chart, the uptrend is visible: price trades above the rising Ichimoku cloud, with successive FVG blocks offering a “ladder” of support. The nearest resistance stands around 3,645–3,650. Below, support is layered at 3,628–3,618, 3,605–3,595, and further down at 3,580–3,565.
The likely path is sideways accumulation below 3,650 before another push higher towards 3,670–3,685. If momentum persists, 3,700–3,715 becomes achievable. Weakness would only show if the 2H candle closes under 3,595, and a decisive break of 3,565 would expose 3,540–3,525. CPI and PPI prints from the US, alongside 10Y yield movements, remain the key variables to watch.

Elliott Wave Analysis XAUUSD – 09/09/2025🌀
————————————-
🔹 Momentum
• D1 timeframe: Momentum is still rising but occurs in the overbought zone → the upside potential is limited.
• H4 timeframe: Momentum is also in the overbought zone and starting to reverse. Although H4 candles are still pushing up, a divergence is forming → signaling weakening bullish strength.
• H1 timeframe: Momentum remains in the overbought zone → no expectation for an extended bullish leg.
————————————-
🔹 Wave Structure
• D1 timeframe:
o Price is in the final stage of wave iii (black) and preparing for wave iv (black).
o By principle, it is better to stay patient and wait for wave iv to complete before looking for Buy entries into wave v (black), rather than trying to catch the top of wave iii.
o Current price is approaching the 2.618 Fibonacci extension of wave i (black).
• H4 timeframe:
o Price is currently within wave v (purple).
o Since it has already broken above wave iii (purple), a reversal could happen anytime.
o Completion of wave v (purple) will also complete wave iii (black).
• H1 timeframe:
o Inside wave v (purple), a full 5-wave structure (green) can be counted.
o The potential confluence zone for the end of wave 5 (green), wave v (purple), and wave iii (black) is 3669 – 3678.
o After this zone, price is expected to correct into wave iv (black), which often develops sideways and shallow.
➡️ Once wave iv (black) is complete, the market is expected to continue higher into wave v (black).
➡️ High liquidity zones highlighted by the Volume Profile will act as support, preventing a deep decline and providing momentum for wave v (black).
• Wave iv usually retraces back to the wave 4 of a smaller degree. Currently, we have two key areas:
o Wave 4 (green) around 3597
o Wave iv (purple) around 3552 – 3530
————————————-
🔹 Trading Plan
1. Buy Zone 1: 3598 – 3596
o SL: 3588 (or 3579 for wider risk tolerance)
o TP1: 3669
2. Buy Zone 2: 3553 – 3550
o SL: 3540
o TP1: 3597

selling gold from liquidity sweep .Selling gold as gold taking rejection from liquidity sweep level . for target 1 Golden Reversal and final target Liquidity sweep 3623. sl will 3 mins candle closing basis above the zone .

Gold - Buy around 3627, target 3680-3699Gold Market Analysis:
Is gold trading aggressive today? Those who prefer to intercept and counter-trend trades and avoid losses are already questioning their lives. The market is like this; it's always right. Yesterday, we analyzed a long position at 3578, but the lowest point was only 3579. It's better to miss out on such a market than to make a mistake. In a one-sided rally, making a mistake is the most damaging. Today's approach remains bullish, and we're watching for buying activity. A surge doesn't have a top, and no one knows where it will be. Based on the current momentum, 3700 is just around the corner. Gold is advancing cautiously, with the daily chart pattern beginning to rise, and buying indicators are also rising. The 5-day moving average has already reached around 3594. There are essentially no selling opportunities above 3594. Yesterday's Monday rally actually exceeded market expectations. This week, I predict gains from Monday to Wednesday, with a daily correction expected on Thursday and Friday, but it will only be a correction, not a major drop. In today's Asian session, we will look for buying opportunities at support at 3627. This level provides minor support in the 1-hour chart and also supports hourly indicators. The Asian session has already reached a new high, indicating continued strength. Buying is recommended. If the price unexpectedly breaks below 3627, we will look for support in the 4-hour chart before buying. We are not considering selling during the Asian session.
Support is 3627, with strong support at 3600 and 3594. Resistance is not visible, and the market's strength-weakness dividing line is 3600.
Fundamental Analysis:
The previous sharp drop in non-farm payroll data led to a surge in gold prices. This week, we will monitor CPI data.
Trading Recommendations:
Gold - Buy around 3627, target 3680-3699
