CFDGOLD trade ideas

GOLD 03/09: TIME TO SELL, WHERE TO BUY TODAY?1. Overall Analysis
Elliott Wave:
Wave (5) seems to have completed, signalling a possible distribution phase.
The market is likely moving into an ABC corrective structure, with Wave A expected to retrace to key Fibonacci levels before a Wave B rebound.
Smart Money Concept (SMC):
The Break of Structure (BOS) is confirmed.
There’s a Fair Value Gap (FVG) around the 3,500 level, which price may revisit to fill.
The CP Order Buy Zone near 3,485 indicates a strong liquidity area for potential medium- to long-term buying opportunities.
2. SELL Plan
SELL Zone: 3,550 – 3,552
Stop Loss (SL): 3,558
Take Profit (TP):
TP1: 3,526 (Fib 0.266 – short-term target)
TP2: 3,517 (Fib 0.382 – first support level)
TP3: 3,508 – 3,506 (BUY SCALP/FVG zone)
Logic:
Price has completed Wave 5, forming a distribution zone.
Smart Money may sweep liquidity around 3,550 before pushing the price down to test the FVG levels.
3. BUY SCALP Plan
BUY Zone: 3,508 – 3,506 (aligning with the FVG)
Stop Loss (SL): 3,499
Take Profit (TP):
TP1: 3,526 (Fib 0.266 retracement)
TP2: 3,540 (previous reaction level)
Logic:
This zone lines up with an unfilled FVG and the 0.5–0.618 retracement levels of the last leg.
If price holds its bullish structure here, Wave B could stage a strong rebound.
4. Medium-Term BUY Zone
CP Order Buy Zone: Around 3,485
Logic:
This area acts as a major liquidity pool, often targeted by Smart Money.
If price breaks below 3,506, this level could be the next key spot for medium-term accumulation, with an eye on a Wave C move back toward 3,550+.
5. Main Scenarios
Primary Setup:
Look for a SELL entry at 3,550 – 3,552 with SL at 3,558, and scale out profits at support levels.
Watch for a BUY SCALP setup in the 3,508 – 3,506 range if bullish confirmation appears.
Alternate Setup:
If price dips below 3,506 and keeps falling, wait for confirmation at 3,485 to build a medium-term long position.
6. Risk Management
Always place tight stop-losses for each setup.
For SELL trades: lower your position size during high-impact news events.
For BUY SCALP trades: only enter after confirmation signals, such as a pin bar, engulfing candle, or a minor structure break on the M5/M15 charts.

GOLD Daily Plan – Sideway before ADP & NFP | MMFLOW TRADINGAfter yesterday’s strong rally, Gold (XAUUSD) corrected by over 60 Prices, moving back to the VPOC 3537 zone. This pullback indicates a potential short-term ATH near 357x, where SELL positions were shaken out and BUY positions booked profits.
Currently, Gold is consolidating ahead of ADP today and NFP tomorrow. With ADP expected at 73K vs. 104K previously, weaker job data could pressure USD and provide upside momentum for Gold.
The 60+ point drop highlights profit-taking by institutions and created liquidity gaps on both sides, bringing price into the 353x–354x sideway zone. A clear breakout of this zone will decide today’s trend direction.
🔑 Key Resistance Levels
3540 – 3548 – 3560 – 3576
🔑 Key Support Levels
3526 – 3515 – 3502 – 3490 – 3476
📌 Trade Setups (MMFLOW Trading View)
🔵 BUY Scalp: 3502 – 3500
🔴 SL: 3494
✔️ TP: 3506 – 3510 – 3520 – 3530 – 3540 – ???
🔵 BUY Zone: 3477 – 3475
🔴 SL: 3470
✔️ TP: 3485 – 3495 – 3500 – 3510 – 3520 – 3530 – 3540 – 3550 – ???
🔵 SELL Scalp: 3559 – 3561
🔴 SL: 3566
✔️ TP: 3554 – 3550 – 3540 – 3530 – 3520 – 3510 – 3500 – ???
🔵 SELL Zone: 3574 – 3576
🔴 SL: 3580
✔️ TP: 3570 – 3560 – 3550 – 3540 – 3530 – ???
📊 MMFLOW TRADING View:
Today’s outlook suggests continued correction before ADP/NFP releases. Sideway accumulation dominates between 353x–354x, but whichever side breaks first will set the day’s direction.

XAUUSD – Gold Stalls as USD Regains StrengthThe ISM Services PMI was reported at 50.9, higher than the previous 50.1 and still above the 50 threshold – indicating that the U.S. services sector remains in expansion. This is a sign that the U.S. economy is still resilient, and the USD immediately benefited. With a stronger dollar, it’s natural for gold to come under corrective pressure.
On the 8H chart, after a sharp rally, XAUUSD was capped at the 3,579 USD resistance . From there, price showed a reversal signal and started to retreat. The nearest support lies around 3,465 USD, and if this level is broken, the probability of a deeper decline increases significantly – especially as the fundamentals continue to favor the greenback.
In the short term , I favor a bearish scenario: sell while price stays below 3,579, targeting 3,465. Only a clear close above 3,579 would bring the bullish outlook back, but for now, gold looks set for a correction.

Gold 04/09 – Smart Money Setup: Sell Scalp, Prep for Buy Zones🟢 Market Context
Gold is currently reflecting a short-term bearish setup after a Change of Character (ChoCH) near 3,536.556. The market is reacting from supply and creating liquidity sweeps around the 3,531–3,533 zone. We anticipate the price to move lower towards demand areas before the next upward push.
📍 Key Levels & Trade Plan
🔴 Intraday Sell (Scalp Trade)
Entry: 3,531 – 3,533
Stop Loss: 3,535
Target: 3,485
🟢 Swing Buy Zones
Buy Zone 1: 3,475 – 3,477
Stop Loss: 3,470
Target: 3,508 – 3,526
Buy Zone 2 (Deeper Discount): 3,441 – 3,443
Stop Loss: 3,435
Target: 3,500+
⚖️ SMC Bias
Short-term: Bearish scalp from supply zone.
Mid-term: Expecting liquidity grab and bullish reversal at demand zones.
Long-term: Bullish order flow intact as long as deeper demand (3,441) is respected.

Gold 03/09 – Smart Money Playbook: Buy the Dip, Sell the High🟢 Market Context
Gold continues to show a bullish trend with multiple BOS (Break of Structure) and ChoCH (Change of Character) confirmations. The price is currently consolidating around the 3,533–3,540 range, with a noticeable FVG (Fair Value Gap) below. The market is likely to sweep liquidity before making another upward move.
📍 Key Levels
• Resistance (Sell Zones): 3,564 | 3,575–3,576 | 3,586 | 3,595
• Support (Buy Zones): 3,528 | 3,508 | 3,494 | 3,480–3,478 | 3,468
🛠️ Trade Ideas
✅ Buy Zone (Intraday Swing)
• Entry: 3,480 – 3,478
• SL (Stop Loss): 3,473
• TP (Take Profit): 3,485 – 3,490 – 3,500 – 3,515 – 3,520 – 3,530
📌 Expectation: Price is expected to fill the FVG and react from the demand zone before resuming its upward trend.
✅ Buy Scalp (Quick Reaction)
• Entry: 3,501 – 3,503
• SL (Stop Loss): 3,491
• TP (Take Profit): 3,510 – 3,525 – 3,545 – 3,550
📌 Expectation: A short-term liquidity grab above the 3,500 psychological level, leading to a bullish push.
❌ Sell Zone (Countertrend Play)
• Entry: 3,575 – 3,573
• SL (Stop Loss): 3,582
• TP (Take Profit): 3,565 – 3,555 – 3,545 – 3,530 – 3,520
📌 Expectation: A strong supply zone where smart money may target liquidity before a price reversal.
🔑 SMC Insights
• BOS confirms a bullish bias, but the price may pull back to address the FVG imbalance.
• Liquidity is likely to be present around 3,480–3,500 before a push towards 3,575 or higher.
• High probability of buying at demand zones (dips) and selling at extreme supply zones.

Gold - Sell around 3532, target 3500-3480Gold Market Analysis:
Yesterday, we planned to buy gold at 3531, and the blog post clearly stated buying at 3526. Almost all of the purchases were made at the lowest point. Gold surged to 3578 in the European and American trading sessions, closing with a strong positive daily candlestick pattern. However, gold plummeted in the Asian session, giving back all of yesterday's gains in just a few hours. Does this signal a topping? A technical pullback after a significant surge is normal, but the magnitude of the pullback has disrupted the short-term buying structure, allowing gold to re-enter a new pattern. This week is a data week, and the further into the future, the more critical the market for gold. I believe the current sharp drop is merely profit-taking ahead of the data releases, and it's not yet a definitive peak signal. The overall trend should continue to be buying today. Don't blindly buy in the Asian session. Consider selling on a short-term rebound. The 3526 level has been broken. This level is the hourly low and also the daily support level. A break of this level indicates a weakening trend. Another level is the 5-day moving average of the daily chart, 3508-3500. A significant drop below this level would confirm a short-term Yin-enclosing Yang pattern, potentially signaling the start of a major correction. We can buy and sell intraday, capitalizing on this trend. Furthermore, the 4-hour chart's consecutive reversals into the red are causing market confusion.
Support is 3508-3500, while resistance lies at 3566, 3553, and 3542. The dividing line between strength and weakness is 3526.
Fundamental Analysis:
Today we will have ADP employment and unemployment benefit data.
Trading Recommendation:
Gold - Sell around 3532, target 3500-3480

Elliott Wave Analysis XAUUSD – 4/9/2025
Momentum
• D1: Currently showing bearish reversal signals. We need to wait for today’s daily candle close to confirm. If confirmed, it is likely that the recent rally has ended and the market will enter a corrective phase lasting several days.
• H4: Momentum is moving into the oversold zone, suggesting that the current downward correction may be close to completion. Afterward, a rebound is expected within the next 1–2 H4 candles.
• H1: Momentum is in the oversold zone and showing signs of turning upward, indicating a short-term bullish bounce is likely.
Wave Structure
• D1: The first bearish candle has appeared after a steep rally, suggesting a 5-wave structure. The ongoing correction will help determine whether this was the completion of a larger Wave 5 or just Wave 1 within Wave 5.
• H4: After reaching 3578, price turned lower. This likely marked the completion of black Wave 5, as well as the green wave and purple Wave iii. The market is now in the corrective phase of purple Wave iv.
• H1: Purple Wave iii has completed, including both black Wave 5 and green Wave v. An ABC corrective structure is currently forming, but its formation time is relatively short, which means extra caution is needed as the correction may not be fully completed or could extend further.
📍 Target zones for the completion of purple Wave iv:
• Zone 1: 3498
• Zone 2: 3469
Once purple Wave iv is completed, the uptrend is expected to continue into purple Wave v with projected targets:
• Target 1: 3602
• Target 2: 3667
Trading Plan
• Buy Zone 1: 3500 – 3498
o SL: 3490
o TP1: 3524
• Buy Zone 2: 3471 – 3469
o SL: 3459
o TP1: 3500

Gold Smashes Records: Trade the Fed Drama & Rate Cut Hype!Fundamental Analysis: Why Gold Keeps Breaking Records! 🌟
New Peaks: Spot gold hit a record $3,527.5/oz on September 2, with analysts predicting a climb to $3,600-$3,900 this year, potentially surpassing $4,000 by 2026 if economic and geopolitical uncertainty persists. Reuters polls show 2025 average price forecasts rising from $2,756/oz (January) to $3,220/oz (July). 📈
Fed Rate Cut Buzz: Fed Chair Jerome Powell acknowledged rising job market risks, boosting bets for a September rate cut. “A weakening USD, fueled by rate cut expectations, investor aversion to US assets, and tariff-related economic uncertainty, supports gold,” says Ricardo Evangelista from ActivTrades. Gold thrives in low-rate environments! 🏦
USD Weakness: The USD has lost nearly 11% since Trump’s return to the White House in January 2025, making gold more attractive to foreign currency holders. 📉
Fed Drama: Trump’s criticism of Powell and attempts to oust Fed Governor Lisa Cook have raised fears about Fed independence, driving safe-haven gold demand. “Speculative bullishness stems from potential Fed interference and concerns over the USD’s safe status,” notes Carsten Menke from Julius Baer. ⚖️🇺🇸
Other Drivers: Middle East tensions, Russia-Ukraine conflict, and central bank buying (e.g., China’s PBOC added gold for the 9th consecutive month in July 2025). The World Gold Council (WGC) reports central banks plan to increase gold reserves while reducing USD holdings. “Rising gold prices and central bank accumulation are boosting gold’s share in reserves,” says Michael Hsueh from Deutsche Bank. Gold ETFs like SPDR Gold Trust saw holdings rise 12% YTD to 977.68 tons, the highest since August 2022.
Technical Analysis: Bullish Surge Continues, Prioritize BUY but Watch for Pullbacks! 📉
Gold keeps setting new highs, breaking through the round 3,500 level, dipping briefly to 3,469, then surging to 3,54x—near the Fibonacci extension 0.618. No clear reversal signals yet, so prioritize BUY if gold retraces to 3,52x or 3,51x. Bulls remain in control!
Key Resistance: 3,554 - 3,564 - 3,574
Key Support: 3,521 - 3,508 - 3,450 - 3,475
Trading Opportunities:
Sell Scalp : 3,543 - 3,545
SL: 3,549
TP: 3,540 - 3,535 - 3,530
Sell Zone : 3,571 - 3,573
SL: 3,581
TP: 3,563 - 3,553 - 3,543 - 3,523
Buy Scalp: 3,510 - 3,508
SL: 3,504
TP: 3,513 - 3,518 - 3,528
Buy Zone: 3,475 - 3,473
SL: 3,465
TP: 3,483 - 3,493 - 3,503 - 3,513 - Open
#Gold #XAUUSD #Fed #Trump #TradingView #MarketUpdate #Forex #Investing #TechnicalAnalysis #GoldTrading #Finance #Crypto

GOLD crosses $3500! What’s next for Indian traders?Gold (XAUUSD) has shown massive momentum, moving nearly 50–60 points daily. Price is now reacting at an important FIBO extension level. Sellers are stepping in, but so far there is no strong confirmation on higher timeframes (H1–H2).
📊 MMFLOW VIEW
Sideways consolidation → Breakout → New ATHs every day.
Liquidity & FVG zones are still favoring the BUY side.
SELL is only safe when higher timeframe volume confirms.
For now: Focus on BUY entries from liquidity zones.
🔑 KEY LEVELS
Resistance: 3440–3446 (ATH) | 3564 | 3576 | 3586 | 3595
Support: 3528 | 3508 | 3494 | 3480 | 3468
🎯 MMFLOW PLAN
✅ BUY ZONE: 3481 – 3479
SL: 3474
TP: 3486 – 3490 – 3495 – 3500 – 3510 – 3520 – 3530 – ???
✅ BUY SCALP: 3496 – 3494
SL: 3490
TP: 3500 – 3510 – 3520 – 3530 – 3540 – ???
❌ SELL ZONE: 3576 – 3578
SL: 3584
TP: 3570 – 3565 – 3560 – 3555 – 3550 – 3540 – 3530 – 3520 – 3510 – 3500
⚠️ Important for Indian traders: GOLD is extremely volatile right now. Don’t rush into trades.
👉 Wait for confirmation at Key Levels, use proper Risk Management, and target smart entries for maximum profit.
🔥 This is the MMFLOW TRADING PLAN – Follow us on TradingView for daily GOLD strategies and never miss the next big move!

Healthy Pause in Gold’s Rally, Bulls Still in ControlGold has finally started to show a healthy daily correction after its sharp rally and breakout above 3500. This pullback was not unexpected, as intraday charts were looking overstretched in the last sessions. Despite today’s dip, the broader structure remains strong with momentum still favoring the upside as long as key supports hold. For the short term, 3500 (previous high) will be the immediate level to watch, followed by 3450 as secondary support. Holding above these levels will keep the bullish trend intact, and any stabilization here can set the stage for another leg higher. Overall, the correction looks more like a consolidation phase rather than a reversal, keeping the bigger picture positive.

XAUUSD – Has the Downtrend Really Started?XAUUSD – Has the Downtrend Really Started?
Hello traders,
Gold is now showing signs of a corrective move lower. Price has already dropped by nearly 40 dollars, signalling that selling pressure is starting to build. Traders are accepting lower prices at this level, but to truly confirm a bearish shift, we need to see price action around the 3530 zone, which acts as a key level for validation.
On the higher timeframe, gold has rallied almost 250 dollars (2500 pips) in just two weeks, a very strong bullish run. However, with the upcoming NFP release today and tomorrow, the market could redistribute liquidity. Current forecasts suggest weak NFP numbers, and if that plays out, gold may still push higher – but this remains speculative.
Trading strategy for now:
Short entries: around 354x, aiming for a medium- to long-term move lower.
Potential buy zones: watch for reactions at the FVG liquidity gaps around 3510 – 3460 – 3430, where strong demand previously created imbalances.
For now, my outlook remains medium-term short, while staying flexible around key liquidity levels. Take this as reference, and share your views in the comments – let’s discuss together.

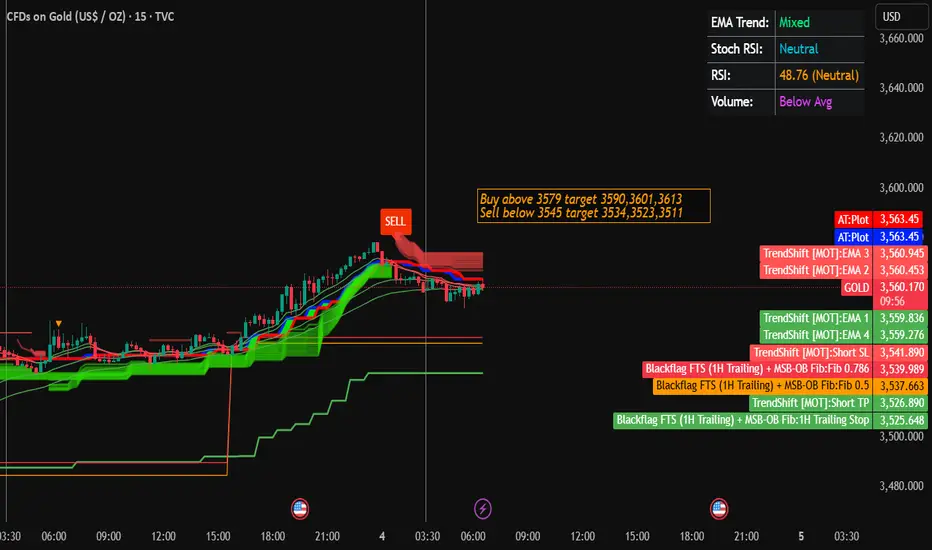
Gold Trading Strategy for 04th Sep 2025📊 Gold Intraday Trading Plan
✅ Buy Setup (Long Position)
Condition to Enter:
Wait for the 15-minute candle to close above $3579.
Buy Entry: Above $3579.
Targets:
First Target – $3590
Second Target – $3601
Third Target – $3613
Stop Loss (SL): Below recent 15-min support (e.g., $3570).
Example:
If the 15-min candle closes at $3581, you can enter a buy trade at around $3582–$3583.
If price moves to $3590, you book your first profit.
If it continues higher, trail your stop-loss to lock in profits while aiming for $3601 and $3613.
✅ Sell Setup (Short Position)
Condition to Enter:
Wait for the 1-hour candle to close below $3545.
Sell Entry: Below $3545.
Targets:
First Target – $3534
Second Target – $3523
Third Target – $3511
Stop Loss (SL): Above recent 1-hour resistance (e.g., $3555).
Example:
If the 1-hour candle closes at $3543, you can enter a sell trade around $3542–$3544.
If price falls to $3534, that’s your first target.
If it keeps dropping, trail your stop-loss and aim for $3523 and $3511.
⚠️ Important Notes for Beginners
Always wait for candle close confirmation. Don’t jump in before the candle closes, as fake breakouts can trap traders.
Use strict stop-loss. This protects you if the market moves opposite.
Trade with small lot size in the beginning to control risk.
Risk-Reward Ratio (RRR): Always aim for at least 1:2 RRR (risk $1 to gain $2).
📌 Disclaimer
This analysis is for educational purposes only and not financial advice. Trading in gold or any market involves significant risk, and past performance does not guarantee future results. Please consult with a financial advisor before making trading decisions. Trade at your own risk.
“XAUUSD – Strong Sell Setup from All-Time High Resistance“XAUUSD – Strong Sell Setup from All-Time High Resistance 🚨📉”
Currently, gold has reached a strong resistance zone around 3575 – 3600, where price is showing signs of exhaustion after a strong bullish rally. This area is a key supply zone and could trigger profit-taking or fresh short entries.
From here, I am expecting a potential correction move.
1st Target: Around 3480 – 3450, where we can see a clear demand zone and previous consolidation.
If bearish pressure continues, the price may extend towards the final target at 3330 – 3320, which is also a key support point aligned with previous market structure.
Market structure shows a clear higher low formation earlier, which fueled this rally, but after tapping into resistance, a short-term pullback seems highly likely.
📌 Overall, short-term bias = bearish correction, while long-term trend remains bullish unless price breaks below the 3320 support zone.ll-Time High Resistance

9.3 Gold Analysis9.3 Gold Analysis
Spot gold prices have now stabilized above $3,500/oz, continuing their historic upward trend.
The main factors driving the gold price increase include: rising market expectations for a September Federal Reserve rate cut and increased safe-haven demand. Furthermore, holdings of the SPDR Gold Trust, the world's largest gold-backed exchange-traded fund (ETF), increased by 1.32% on Tuesday to 990.56 tons, reaching their highest level since August 2022, reflecting strong investor demand.
Technically, the gold daily chart has closed higher for six consecutive days, demonstrating strong bullish momentum. However, after this consecutive rise, the market has shown signs of being overbought. Based on historical trends, a correction typically occurs after five to six consecutive days of gains. Key short-term support is the $3,508-3,500/oz range.
Trading Strategy
Gold: The market is closely watching Friday's release of US non-farm payroll data for further confirmation of the extent of the Fed's interest rate cut. After a continuous rise in gold prices, the risk of a technical pullback is increasing. Avoid chasing high prices and consider waiting for a pullback to support levels to enter the long position.
Trade with caution and manage risk. Best wishes for successful trading!

Gold Approaches All-Time High with Strong Bullish MomentumAnalysis:
Gold (XAU/USD) is showing strong bullish momentum after breaking through the buy zone around the $3,450 level. Price action has respected the ascending channel and successfully pushed above key resistance levels.
Currently, gold is trading at $3,473, with the next major target set at the all-time high (ATH) of $3,550, as highlighted on the chart. The breakout above the consolidation zone suggests continued buyer strength, supported by high trading volume.
If the bullish momentum sustains, we can expect a new ATH around $3,550+, while a failure to hold above $3,450 may bring a short-term pullback toward $3,400 – $3,346 support levels.
Overall, sentiment remains bullish, and gold looks ready to test higher highs if momentum continues.
Would you like me to also create a trade plan (entry, stop loss, take profit levels) for this setup?

GOLD 1H Gold next buying area , wait for confirmation in support area
Confirmation : 1/15min reversal candlestick pattern

MARKET CONTEXT-Gold is in a strong uptrend, with strong momentum pushing the price above 3500 – an important psychological level.
-However, after reaching a peak around 3552, the price is now pulling back to the 3532 area.
➡️ On H1 & M15, the Higher High – Higher Low structure is still intact, but the big red candle just appeared on H1 suggests that the market may need some consolidation or a small correction before continuing the trend.
📊 VOLUME PROFILE (estimated)
🔺 VAH: 3548–3552 → New resistance zone, possible short-term profit-taking
🟨 POC: 3510–3512 → Nearest balanced support zone from volume
🔻 LVN: 3490–3494 → Low liquidity zone, price may react quickly if POC is broken
🟩 Demand Zone H4: 3450–3460 → Strong support from higher timeframe, potential buy zone if price corrects deeper
🛡 SUPPORT – RESISTANCE
Resistance:
3548–3552 (new VAH)
3560–3565 (psychological barrier if breakout continues)
Support:
3510–3512 (POC)
3490–3494 (LVN)
3450–3460 (H4 Demand Zone)
📍 TRADING SCENARIOS (based on M15 & H1)
📊 Scenario 1: SELL reaction at VAH 3548–3552
✅Conditions:
Price retests 3548–3552
Bearish Pin Bar or reversal pattern appears on M15
Weak breakout volume
⚠️ Reason:
This is a newly formed resistance zone
Strong profit-taking pressure may appear
🎯 Target: 3512 → 3494
🛑 SL: above 3556
📊Scenario 2: BUY at POC 3510–3512
✅ Conditions:
Price pulls back to 3510
Bullish Pin Bar / Fakey / Strong absorption volume on M15
⚠️ Reason:
POC is strong support based on volume
Uptrend structure still valid
🎯 Target: 3535 → 3550
🛑 SL: below 3505
🧷 Scenario 3: SELL if POC 3510 breaks
✅ Conditions:
H1 closes below 3510
Pullback does not reclaim POC
Volume confirms sellers in control
⚠️ Reason:
If POC is lost, the market may correct deeper
Likely to retest LVN 3490
🎯 Target: 3490 → 3460
🛑 SL: above 3518
📊 Scenario 4: Strong BUY at Demand Zone 3450–3460 (H4)
✅ Conditions:
Price drops to 3450–3460
Strong reversal pattern + good absorption volume on M15/H1
⚠️ Reason:
Major support from higher timeframe
High chance of bouncing back if the market corrects deeply
🎯 Target: 3510 → 3530
🛑 SL: below 3445

XAUUSD Gold Trading Strategy September 3, 2025XAUUSD Gold Trading Strategy September 3, 2025: Gold prices are stable, heading towards the $3,550 mark with ETF capital flows boosting and the market is also waiting for employment data and developments from the FED.
Basic news: Spot gold prices remained stable in today's Asian trading session, after rising sharply in the previous session. The current international gold price is around $3,531/ounce, according to CMC Group's FedWatch Tool, the market is pricing in nearly 92% of the possibility that the Fed will cut 25 basis points at the meeting on September 17.
Technical analysis: Spot gold prices continue to increase strongly. The rising price channel remains. Currently, the MA lines and the Fib frame are still very good support areas for prices, however, the RSI is in the overbought area; we should be careful that prices will have a correction first and then increase again. We limit FOMO, continue to wait at support zones combined between MA, Fib and FVG zone.
Important price zones today: 3500 - 3505 and 3475 - 3480.
Today's trading trend: BUY.
Recommended orders:
Plan 1: BUY XAUUSD zone 3500 - 3502
SL 3497
TP 3505 - 3515 - 3530 - 3550.
Plan 2: BUY XAUUSD zone 3475 - 3477
SL 3472
TP 3480 - 3490 - 3500 - 3530.
Wish you a safe, effective and profitable trading day.💯💯💯💯💯

XAU/USD Bullish Setup – OB Zone to $3,590 TargetChart Overview (XAU/USD – 30m):
Current price: $3,534
Price is in a strong bullish channel (higher highs & higher lows).
Market forming an ATH (All-Time High) and consolidating.
📌 Strategies Applied:
1. Trendline Strategy:
Price respecting support & rejection lines inside ascending channel.
Trend remains bullish as long as price holds above support.
2. Order Block (OB) Zone:
Identified buying zone at $3,501 – $3,514.
Strong support + liquidity area → possible rebound point.
3. Moving Averages (EMA):
EMA 70 (3,508) and EMA 200 (3,464) both acting as dynamic support.
EMA alignment confirms bullish momentum.
4. Risk–Reward Setup:
Entry near OB Zone: $3,501 – $3,514
Stop-loss: below $3,500
Target: $3,590 (R:R ~ 1:3).
✅ Summary:
Gold is in a strong bullish trend 🚀. The OB Buying Zone aligns with EMA support, offering a low-risk long entry. As long as $3,500 holds, price likely pushes towards the target zone $3,589 – $3,590.

Technical Analysis and Fundamental AnalysisIntroduction
In the world of financial markets—whether equities, commodities, currencies, or bonds—two primary schools of thought dominate the decision-making process of traders and investors: technical analysis (TA) and fundamental analysis (FA). Both are distinct in methodology and philosophy, yet they share a common goal: to forecast future price movements and identify profitable opportunities.
Technical analysis focuses on price action, charts, patterns, and market psychology, whereas fundamental analysis centers on intrinsic value, economic indicators, company performance, and long-term outlooks. Traders and investors often debate which approach is superior, but in practice, many combine elements of both to create a more holistic strategy.
This essay provides an in-depth exploration of technical and fundamental analysis, covering their history, principles, tools, strengths, weaknesses, and practical applications.
Part 1: Technical Analysis
1.1 What is Technical Analysis?
Technical analysis is the study of historical price data and volume to forecast future market movements. Unlike fundamental analysis, it does not concern itself with “why” the price moves, but rather “how” it moves. The basic premise is that market action discounts everything, meaning all known information—economic, political, psychological—is already reflected in the price.
Traders using technical analysis believe that patterns repeat over time due to human behavior and market psychology. By analyzing charts, they aim to identify trends and capitalize on them.
1.2 History of Technical Analysis
The roots of TA trace back to Charles Dow, co-founder of the Wall Street Journal and the Dow Jones Industrial Average. His writings in the late 19th century evolved into what we now know as Dow Theory.
Japanese rice traders developed candlestick charting in the 1700s, which still plays a major role in modern trading.
Over time, charting techniques evolved into a sophisticated discipline supported by algorithms and computers.
1.3 Core Principles of Technical Analysis
Market Discounts Everything
All available information is already reflected in the price.
Price Moves in Trends
Markets follow trends—uptrend, downtrend, or sideways—and these trends are more likely to continue than reverse.
History Repeats Itself
Patterns of market behavior tend to repeat because human psychology does not change.
1.4 Tools of Technical Analysis
(a) Charts
Line Charts – simple, connect closing prices.
Bar Charts – show open, high, low, close (OHLC).
Candlestick Charts – visually appealing, show the same OHLC but easier to interpret.
(b) Price Patterns
Continuation Patterns: Flags, Pennants, Triangles.
Reversal Patterns: Head and Shoulders, Double Top/Bottom, Cup and Handle.
(c) Indicators and Oscillators
Trend Indicators: Moving Averages (SMA, EMA), MACD.
Momentum Oscillators: RSI, Stochastic Oscillator.
Volatility Indicators: Bollinger Bands, ATR.
Volume Indicators: On-Balance Volume (OBV), Volume Profile.
(d) Support and Resistance
Support: a level where demand outweighs supply, preventing further decline.
Resistance: a level where supply outweighs demand, preventing further rise.
(e) Advanced Tools
Fibonacci Retracement and Extensions.
Elliott Wave Theory.
Ichimoku Cloud.
Volume Profile Analysis.
1.5 Advantages of Technical Analysis
Provides clear entry and exit signals.
Works well for short-term and medium-term trading.
Easy to visualize with charts.
Reflects collective psychology and herd behavior.
1.6 Limitations of Technical Analysis
Subjective interpretation: two analysts may read the same chart differently.
Works best in trending markets, less effective in choppy markets.
False signals can lead to losses.
Relies on past data, which may not always predict future movements.
Part 2: Fundamental Analysis
2.1 What is Fundamental Analysis?
Fundamental analysis evaluates a security’s intrinsic value by examining economic, financial, and qualitative factors. It seeks to answer: Is this stock (or asset) undervalued or overvalued compared to its true worth?
Investors use FA to make long-term decisions, focusing on earnings, growth potential, competitive advantages, management quality, and macroeconomic conditions.
2.2 Core Principles of Fundamental Analysis
Intrinsic Value vs. Market Price
If the intrinsic value is greater than market price → Buy (undervalued).
If the intrinsic value is less than market price → Sell (overvalued).
Economic and Business Cycles Matter
Markets are influenced by GDP growth, inflation, interest rates, and other macroeconomic variables.
Long-Term Focus
Fundamental analysis is best suited for long-term investors, not short-term traders.
2.3 Types of Fundamental Analysis
(a) Top-Down Approach
Starts with the global economy, then narrows to sectors, and finally selects individual companies.
(b) Bottom-Up Approach
Focuses on company-specific factors first, regardless of broader economy or sector.
2.4 Tools of Fundamental Analysis
(a) Economic Indicators
GDP growth, unemployment rates, inflation, interest rates, currency fluctuations.
(b) Industry and Sector Analysis
Porter’s Five Forces model.
Sector growth potential.
(c) Company Analysis
Quantitative Factors (Financial Statements)
Income Statement (revenue, profit, margins).
Balance Sheet (assets, liabilities, equity).
Cash Flow Statement.
Financial Ratios: P/E, P/B, ROE, ROA, Debt-to-Equity, etc.
Qualitative Factors
Management quality.
Competitive advantage (moat).
Brand value, innovation, customer loyalty.
(d) Valuation Models
Discounted Cash Flow (DCF).
Dividend Discount Model.
Price-to-Earnings and other multiples.
2.5 Advantages of Fundamental Analysis
Provides deep insights into intrinsic value.
Helps long-term investors make informed decisions.
Identifies undervalued and overvalued opportunities.
Considers broader economic and company-specific realities.
2.6 Limitations of Fundamental Analysis
Time-consuming and requires access to reliable data.
Assumptions in valuation models can be subjective.
Does not provide short-term entry/exit signals.
Markets can remain irrational longer than expected.
Part 3: Technical vs. Fundamental Analysis
Feature Technical Analysis Fundamental Analysis
Focus Price action, charts, patterns Intrinsic value, financial health
Time Horizon Short-term to medium-term Long-term
Tools Used Indicators, oscillators, chart patterns Financial statements, ratios, DCF
Philosophy “Price discounts everything” “Price may diverge from true value”
Strengths Timing trades, market psychology Identifying strong companies/assets
Weaknesses Subjective, false signals Time-consuming, subjective assumptions
Part 4: Practical Applications
4.1 Traders Using Technical Analysis
Day traders, scalpers, and swing traders rely heavily on technicals.
Example: A trader identifies bullish divergence in RSI and enters a long position.
4.2 Investors Using Fundamental Analysis
Long-term investors like Warren Buffett use FA to buy undervalued companies.
Example: Buying a company with consistent free cash flow, strong moat, and low debt.
4.3 Combining Both Approaches (Techno-Fundamental)
Many professionals combine both methods:
Use fundamental analysis to select strong companies.
Use technical analysis to time entry and exit points.
Part 5: Case Studies
Case Study 1: Reliance Industries (India)
FA View: Strong business diversification, consistent earnings growth, high market share in telecom and retail.
TA View: Technical breakout from a consolidation zone often triggers big moves.
Outcome: FA supports long-term investment, TA helps with timing.
Case Study 2: Tesla (US)
FA View: High valuation multiples, but strong growth prospects in EV industry.
TA View: Volatile price patterns with frequent trend reversals.
Outcome: Investors may hold long-term based on fundamentals but traders rely on charts to manage risk.
Part 6: Criticism and Debate
Critics of TA argue that past price cannot reliably predict future performance.
Critics of FA argue that intrinsic value is subjective, and markets often misprice assets for extended periods.
In reality, both methods reflect different perspectives: TA focuses on “when” to trade, FA focuses on “what” to trade.
Conclusion
Technical analysis and fundamental analysis are two complementary pillars of market research. While TA is driven by patterns, psychology, and momentum, FA is grounded in data, earnings, and long-term value.
For traders, technical analysis is often the weapon of choice due to its short-term applicability. For investors, fundamental analysis provides the framework for wealth creation over time. However, the most successful market participants often blend the two—using fundamentals to identify what to buy and technicals to determine when to buy or sell.
In the ever-evolving financial markets, neither approach guarantees success. Markets are influenced by countless variables—economic, geopolitical, and psychological. But by understanding both technical and fundamental analysis deeply, one can develop a balanced perspective and navigate uncertainty with greater confidence.
Gold surges to a record highGold surges to a record high: Risk aversion and a weakening economy collide
Amidst growing global economic uncertainty, gold has once again demonstrated its status as the king of safe havens. On Tuesday (September 2nd), spot gold prices surged over 1%, breaking through the $3,500 per ounce mark, reaching a new all-time high of $3,539.88 per ounce before closing at $3,533.40 per ounce. So far this year, gold has risen 34.5%, significantly outperforming other major asset classes. This trend is no accident, but rather a profound market response to the weakening US economy, volatile trade policies, and global geopolitical risks.
🔹 Fundamentals: Multiple positive factors are converging, providing solid support for gold prices.
1. US manufacturing continues to contract, increasing recession risks.
The latest data shows that while the US manufacturing PMI rebounded slightly to 48.7 in August, it remained in contraction territory (below the 50 mark), marking the sixth consecutive month of decline. Manufacturing accounts for over 10% of the US economy, and its weakness has impacted employment, investment, and consumption. Particularly alarming is that some manufacturers have bluntly stated that the current environment is "worse than the Great Recession," blaming high tariffs for soaring costs, squeezing profits, and outsourcing capacity. Factory construction spending fell 6.7% year-on-year, further confirming subdued manufacturing confidence.
2. The legitimacy of tariff policies has been undermined, heightening market volatility.
A recent US appeals court ruling that the Trump administration's tariff measures are "unlawful" has temporarily suspended their implementation until October 14th, but this move has exacerbated policy uncertainty. Wall Street stocks tumbled, and the bond market also saw a sell-off. The 30-year US Treasury yield approached 5%, and global sovereign bond yields also climbed. The VIX (Volatility Index) rose, accelerating capital flows into gold for safe havens.
3. Expectations of a Federal Reserve rate cut strengthen, easing liquidity is in sight.
The market is betting on a 90% probability of a 25 basis point rate cut by the Federal Reserve in September, with a cumulative reduction of 57 basis points expected for the year. A weak non-farm payroll data on Friday could further fuel expectations of a rate cut. While the US dollar index has rebounded in the short term, it has weakened overall this year, providing support for gold prices. Furthermore, gold ETF holdings increased to 977.68 tons, the highest level since August 2022, with continued institutional inflows solidifying the upward trend.
4. Global risks are intertwined, with concerns about stagflation emerging.
Eurozone inflation is hovering near central bank targets, the Bank of Japan's dovish stance is weighing on the yen, and UK fiscal concerns continue to simmer. Some market participants are even concerned about the risk of "stagflation"—a combination of economic stagnation and inflationary pressures. Gold has historically been an ideal hedge against such an environment.
🔹 Technical Analysis: Bullish Trend Stable, Pullbacks Present Opportunities
From a technical perspective, gold has seen consecutive daily gains, demonstrating a typical bullish acceleration pattern. Yesterday, gold prices surged strongly above the 3472 level, breaking through 3500 before retracing to confirm the decline. They rose again in the early morning hours, closing at a higher level, demonstrating strong bullish control. Key support has now shifted to the 3510-3515 area, with short-term resistance above at 3550. A break above this level is expected to open up further potential.
Trading Strategy:
Main Strategy: Go long on pullbacks, avoid shorting against the trend.
Specific Plan:
Go long on gold pullbacks to the 3510-3516 area. Cover long positions if it reaches 3500-3505, with a stop-loss below 3493.
Target 3535-3550. Hold above 3570 after a break.
Risk Warning: Unexpectedly strong non-farm payroll data could suppress gold prices in the short term, but the overall risk-averse outlook remains unchanged.
💡 Final Note: A "Golden Age"?
The current rise in gold prices is the result of a combination of economic weakness, policy volatility, and market anxiety. It's no longer a simple commodity; it's a vote of confidence for investors against uncertainty. Against the backdrop of the Federal Reserve's policy shift and escalating global risks, gold is likely to continue its strength. However, be wary of volatility caused by short-term data disruptions; sticking to a trend-following strategy is the best approach.
Evening focus: U.S. July factory orders monthly rate, JOLTs job vacancy data and speeches by Federal Reserve officials may provide the market with new trading clues.

XAUUSD (GOLD) NEXT TARGET PRICE $4000 OR $2755 XAUUSD (GOLD) NEXT TARGET PRICE $4000 OR $2755 THE Real Commodity King Neal Bhai Forecast.
