Weekly Gold (XAU/USD) Report📊 Weekly Gold (XAU/USD) Report
🔹 Fundamental Outlook
Gold remains supported by macroeconomic uncertainty and central bank policies. With global inflation pressures stabilizing but geopolitical tensions persisting, institutional demand for gold as a hedge is intact. The US dollar’s fluctuations and interest rate expectations continue to influence short-term moves, but central banks’ ongoing gold accumulation provides strong long-term demand. Investor sentiment leans toward risk-hedging assets, keeping gold fundamentally supported.
🔹 Technical Structure
This week’s chart shows that gold has recently completed a downward corrective phase and executed a clear breakout from its descending channel. The breakout has been followed by strong bullish momentum, suggesting renewed institutional buying interest.
The market is now showing a healthy impulsive leg upward, with higher highs and higher lows forming. After this strong move, short-term price action indicates a potential cooling-off period—a common consolidation stage before continuation.
Volume flow reflects increasing participation during the breakout, confirming strength in the move. The broader price structure remains trend-reversal aligned, favoring further upside if momentum sustains.
CFDGOLD trade ideas

Gold Surges $70+ – Is XAUUSD Ready for the Next Big Move?🔥 Market Update
Gold (XAUUSD) just made a massive rally of more than $70, shaking the entire trading community.
The rise in geopolitical tensions is pushing safe-haven demand to extreme levels, and gold has once again become the most-watched asset worldwide.
For Indian traders, where gold holds not just market value but also cultural importance, this move is a wake-up call – volatility is at its peak, and discipline is key.
🔎 Macro Outlook
🌍 Global geopolitical risks → Strong inflows into gold as a safe haven.
💵 USD and bond yields are not enough to stop buyers rushing to gold.
📊 Upcoming US PCE data & Fed decisions could bring even bigger swings.
📊 Technical View (H4)
After the sharp rally, gold built a base around CP Zone H4 before breaking out again.
Key Support Levels
3,462 – 3,443 → Must hold to keep the bullish structure intact.
Key Resistance Levels
3,487 – 3,518 → Likely area for pullback or reaction.
A clean break could target 3,536+ next.
📌 Possible Market Scenarios
✅ Scenario 1 (Preferred)
Price holds above 3,462 → Tests 3,511 – 3,518 and can push towards 3,536.
⚠️ Scenario 2 (Deeper Pullback)
Break below 3,462 → Retest of 3,443 before buyers step back in.
🎯 Trade Plan (Reference Only)
✅ BUY ZONE 1
Entry: 3453 – 3451
SL: 3446
TP: 3460 – 3465 – 3470 – 3475 – 3480 – ???
✅ BUY ZONE 2
Entry: 3444 – 3442
SL: 3438
TP: 3450 – 3460 – 3470 – 3480 – ???
❌ SELL ZONE
Entry: 3512 – 3514
SL: 3518
TP: 3505 – 3500 – 3495 – 3490 – 3480 – 3470
💡 Key Takeaways for Indian Traders
Gold is in a powerful uptrend, driven by global uncertainty.
But after such a sharp move, a technical pullback is very possible.
Best approach now:
✔️ Wait for dip-buying opportunities near strong supports.
✔️ Respect stop loss – capital protection comes first.
✔️ Keep an eye on global news that can spark instant volatility.
This is the kind of market where patience + discipline = survival and profit. 🚀

Gold jumps to $3,490 as US court ruling invalidates Trump tariffRate Cut Expectations Boost Gold to $3490.
Dollar Index Retests 97.50.
US Court Invalidates Trump Tariff.
Global Central Banks Step Up Gold Purchases.
Markets Await Nonfarm Payrolls.
Fundamental drivers
With the beginning of 1st trading day of September, Gold witnessed strong buying rush as rising expectations of rate cut by Fed pushed Dollar index to 97.50 adding tailwinds to Gold rallying all the way to $3490, only $10 short of record $3500.
A US court ruling has invalidated trade tariffs imposed by the US president Donald Trump which increases political uncertainty as Trump's egoistic ambitions to control the Fed's independence creates deadlock.
The world watches SCO where India, Russia, China meet to discuss cooperation signalling a paradigm shift for dollar hegemony.
Macro risks and safe haven buying are boosting Gold rush for safety against global economic uncertainties.
Technical drivers
4 hourly 14 period RSI reading 80 reaches overbought territory and indicates presence of bulls and any pullback towards support zone is attracting buyers for further rally.
Price action shows sideways trades with consolidation below $3490 high and upcoming sessions may witness a retracement to local demand area $3454-$3447 where buying is likely to resume for another leg up.
If the metal breaks below $3454-$3447, look for further retracement towards $3436-$3428 below which next support sits at $3415-$3405 which aligns with horizontal breakout zone and turning point.
On the higher side, consolidated break above $3490 will signal retest of $3500 record high and a break above the psychological zone $3500 opens the way for bullish extension to triangular breakout targets $3545 followed by $3568.


GOLD Bullish ScenarioGold is trading near ATH on 1st September it rallied from the previous session's closing price after taking a minor retracement and broken the consolidation zone.

XAUUSD Gold Trading Strategy September 1, 2025XAUUSD Gold Trading Strategy September 1, 2025: Gold reversed its decline and surged to its weekly target, boosted by U.S. PCE data and concerns about Fed independence.
Fundamentals: Gold prices reversed course in the U.S. trading session last week, erasing all losses and rising to a new high. After the US Personal Consumption Expenditures (PCE) inflation report largely met expectations, the precious metal traded near $3,454, its highest level since June 16. The weakening dollar supported gold prices, while traders continued to bet on the Federal Reserve's monetary easing measures in September.
Technical analysis: Gold prices, after breaking the 3,420 - 3,425 area, rose sharply to the 3,485 area and are heading towards the old ATH area of 3,500. We will now trade in an uptrend, waiting for a trading point at the combined support zones of MA, Fib and FVG.
Important price zones today: 3,420 - 3,425 and 3,445 - 3,450.
Today's trading trend: BUY.
Recommended orders:
Plan 1: BUY XAUUSD zone 3445 - 3447
SL 3442
TP 3450 - 3460 - 3480 - 3500.
Plan 2: BUY XAUUSD zone 3420 - 3422
SL 3417
TP 3425 - 3435 - 3455 - 3500.
Wish you a new week of safe, effective trading and lots of profit.🌟🌟🌟🌟🌟

Gold consolidates as new alliances emerge | Captain Vincent 1. News Wave 🌍
At the two-day summit in Shanghai, Prime Minister Modi and President Xi Jinping announced that India and China will become development partners rather than competitors.
The meeting also included Russia and four Central Asian nations, aiming to form a Southern Hemisphere bloc to counterbalance the US and the West.
👉 This signals a shift in geopolitical power, heightening concerns of global polarization → Gold continues to hold its safe-haven position.
2. Technical Analysis ⚙️
On the H2 chart, Gold has formed a Higher High after the recent strong breakout.
Storm Breaker 🌊 (Sell Zone 3511 – 3518): Strong resistance, potential for supply if price retests.
Golden Harbor 🏝️ (Buy Zone 3450 – 3448): Confluence with FVG + Fibonacci 0.5/0.618, a key support for pullback entries.
Main Trend: Gold likely to move sideways between 3450 – 3510 before choosing a major direction.
3. Captain Vincent’s Map – Trade Scenarios 🪙
🔻 Storm Breaker 🌊 (SELL Reaction)
Entry: 3511 – 3508
SL: 3518
TP: 3505 → 3500 → 3497 → 349x → 348x
🏝️ Golden Harbor (BUY Zone – Strong Support)
Entry: 3450 – 3448
SL: 3440
TP: 3453 → 3456 → 3459 → 3462 → 346x
4. Captain’s Note ⚓
"Political news continues to stir the golden sea 🌊. Bears are waiting at Storm Breaker 3511, but the safe harbor remains Golden Harbor 3450 – 3448. In such unpredictable waters, prioritise short-term sells to flow with safe-haven demand, rather than recklessly facing the storm."

XAU/USD Ready For Big Dhamaaka - Neal BhaiXAU/USD Ready For Big Dhamaaka, don't miss it. jackpot neal bhai ka.... rok sako to rok lo.

XAU/USD Magical Level for Trading: $400 Up or Down?XAU/USD (Gold) Magic Level for Trading: Can It Move $400 Up or Down till September 2025? - By Neal Bhai, India
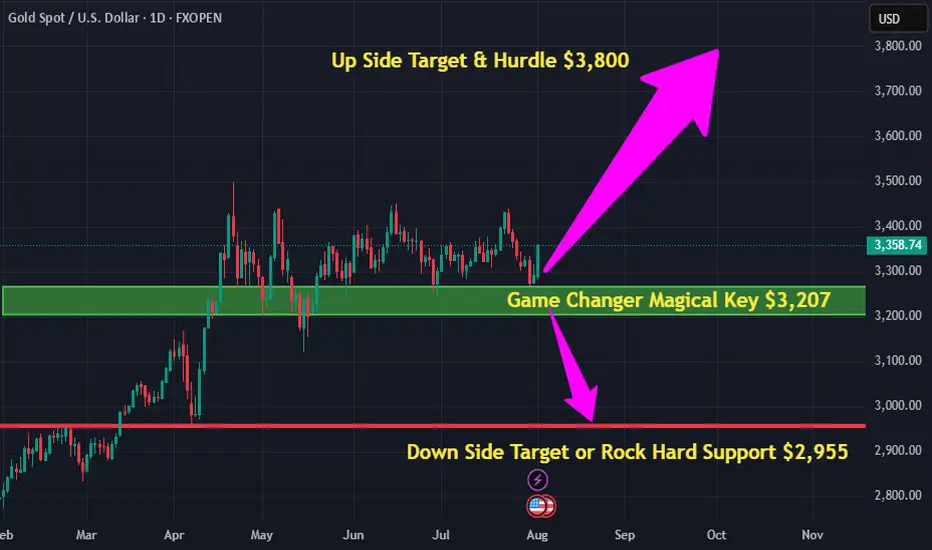
Spot Gold, Door Open for $3800, Need Patience.Spot #Gold, Door Open for $3800, Need Patience. (Any Panic Buy on Dips).
Gold’s price broke through an important level at $3,450, which experts call a “symmetrical triangle pattern.” This is a sign that gold might keep going up, continuing a trend that started earlier this year. After a strong two-month rise starting in February, gold took a break but now seems ready to climb again. Some experts think gold could reach $3,600 or even $3,800 soon, which would beat its previous high of $3,500 from April 22.

Basics of Derivatives in IndiaIntroduction
The financial market is like a vast ocean where investors, traders, institutions, and governments interact. Within this ocean, different instruments allow participants to manage risk, invest, or speculate. One of the most powerful tools in modern finance is Derivatives.
In India, derivatives have become an essential part of the stock market, commodity market, and even the currency market. They allow investors to hedge risk, speculate on price movements, and improve liquidity. Since the early 2000s, India’s derivative market has grown to become one of the largest in the world.
This write-up will explain derivatives in India in simple, detailed, and structured language, covering their meaning, types, uses, risks, and the overall market structure.
1. Meaning of Derivatives
A Derivative is a financial instrument whose value is “derived” from the price of another underlying asset. The underlying asset can be:
Stocks (Equities)
Indices (Nifty 50, Bank Nifty, Sensex, etc.)
Commodities (Gold, Silver, Crude Oil, Wheat, Cotton, etc.)
Currencies (USD/INR, EUR/INR, etc.)
Interest Rates or Bonds
The derivative itself has no independent value — it is only a contract based on the future value of the underlying asset.
Example:
Suppose Reliance Industries stock is trading at ₹2,500. You and another trader enter into a derivative contract (say, a future) where you agree to buy Reliance stock after one month at ₹2,600. The value of your contract will move up or down depending on Reliance’s market price in the future.
2. History of Derivatives in India
The journey of derivatives in India is relatively new compared to developed markets like the US.
Before 2000: Indian markets mainly had spot trading (buying/selling shares). Informal forward trading existed but was unregulated.
2000: SEBI (Securities and Exchange Board of India) introduced derivatives officially. NSE launched index futures on Nifty 50 as the first derivative product.
2001: Index options were introduced.
2002: Stock options and stock futures were introduced.
2003 onwards: Derivatives expanded to commodities (MCX, NCDEX) and later to currencies.
Present: India has one of the world’s most actively traded derivatives markets, with Nifty and Bank Nifty options among the highest traded globally.
3. Types of Derivatives
There are four primary types of derivatives:
(a) Forward Contracts
A forward contract is a customized agreement between two parties to buy or sell an asset at a future date at a pre-decided price.
These contracts are over-the-counter (OTC), meaning they are private and not traded on exchanges.
Example: A farmer agrees to sell 100 quintals of wheat to a trader at ₹2,000/quintal after three months.
Issues: High risk of default because there’s no exchange guarantee.
(b) Futures Contracts
Futures are standardized forward contracts that are traded on exchanges (NSE, BSE, MCX).
The exchange guarantees settlement, reducing counterparty risk.
Example: Buying a Nifty 50 Futures Contract expiring in September at 24,000 means you’re betting Nifty will be higher than that price.
Key Features:
Standardized contract size
Daily settlement (Mark-to-Market)
High liquidity
(c) Options Contracts
An option gives the buyer the right but not the obligation to buy or sell an underlying asset at a fixed price before or on a certain date.
Types of options:
Call Option: Right to buy
Put Option: Right to sell
Example: You buy a Reliance Call Option at ₹2,600 strike price. If Reliance rises to ₹2,800, you can exercise your option and profit. If the stock falls, you can let the option expire by only losing the premium paid.
(d) Swaps
A swap is a contract where two parties exchange cash flows or liabilities.
In India, swaps are mainly used by institutions, not retail traders.
Example: An Indian company with a loan at floating interest rate swaps it with another company having a fixed interest rate loan.
4. Derivative Instruments in India
In India, derivatives are available in:
Equity Derivatives: Nifty Futures, Bank Nifty Options, Stock Futures & Options.
Commodity Derivatives: Gold, Silver, Crude Oil, Agricultural commodities (via MCX, NCDEX).
Currency Derivatives: USD/INR, EUR/INR, GBP/INR futures and options.
Interest Rate Derivatives: Limited but available for institutional participants.
5. Participants in the Derivative Market
Different participants enter derivatives for different purposes:
Hedgers
Businesses or investors who want to protect themselves from price volatility.
Example: A farmer hedging against falling crop prices.
Speculators
Traders who try to make profits from price fluctuations.
Example: Buying Nifty options hoping for a rally.
Arbitrageurs
They exploit price differences between markets.
Example: If Reliance stock trades at ₹2,500 in the spot market but the futures is at ₹2,520, arbitrageurs will sell futures and buy in spot to lock in profit.
Margin Traders
Traders who use leverage (borrowed money) to amplify gains and losses.
6. Role of SEBI and Exchanges
SEBI is the regulator of the Indian derivative market. It ensures transparency, fairness, and prevents market manipulation.
NSE & BSE provide trading platforms for equity derivatives.
MCX & NCDEX are major exchanges for commodities.
Clearing Corporations ensure smooth settlement and eliminate counterparty risk.
7. Trading Mechanism in Indian Derivatives
Open a demat and trading account with a broker.
Maintain margin money to enter into derivative trades.
Place orders (buy/sell futures or options).
Daily profit/loss is settled through Mark-to-Market (MTM).
On expiry date, contracts are either cash-settled or physically settled.
8. Margin System in India
Initial Margin: Minimum amount required to enter a derivative position.
Maintenance Margin: Minimum balance to be maintained.
Mark-to-Market Margin: Daily profit/loss adjustment.
This ensures traders don’t default.
9. Risks in Derivatives
While derivatives offer opportunities, they are risky:
Market Risk: Sudden price movements can cause big losses.
Leverage Risk: Small margin allows big positions, amplifying losses.
Liquidity Risk: Some contracts may not have enough buyers/sellers.
Operational Risk: Mismanagement or technical issues.
Systemic Risk: Large defaults affecting the whole market.
10. Advantages of Derivatives in India
Risk Management (Hedging)
Price Discovery
High Liquidity (especially Nifty & Bank Nifty options)
Lower Transaction Costs compared to cash markets
Speculative Opportunities
11. Real-Life Examples in Indian Market
Nifty & Bank Nifty Options: Most traded globally, used by retail traders, institutions, and FIIs.
Reliance Futures: Highly liquid individual stock future.
Gold Futures on MCX: Popular among commodity traders.
USD/INR Futures: Widely used by importers/exporters to hedge currency risk.
12. Growth of Derivatives in India
India is among the largest derivative markets globally by volume.
NSE ranked No.1 worldwide in derivatives trading (by contracts traded) for several years.
Rising retail participation due to online trading platforms and lower costs.
13. Challenges in Indian Derivatives Market
High speculation and retail losses due to lack of knowledge.
Complexity of products for small investors.
Need for better risk management education.
Regulatory challenges in commodities (e.g., banning certain agri contracts due to volatility).
Conclusion
Derivatives in India have grown from a niche financial instrument to a core pillar of financial markets. They provide risk management, speculation, arbitrage, and liquidity benefits. However, they are a double-edged sword — while they can magnify profits, they can also magnify losses.
For Indian traders and businesses, understanding derivatives is crucial. From Nifty and Bank Nifty options dominating retail trade to commodity hedging by farmers and corporates, derivatives touch every corner of the economy.
As SEBI continues to strengthen regulations and technology makes access easier, the future of derivatives in India looks promising, provided participants use them wisely with proper risk management.

Gold 01/09: FVG Retracement – Buy on Dips, Short near 3515SMC Market View – 01 September
Gold is continuing its bullish order flow, with clear BOS and ChoCH signals already confirmed. Price has formed an FVG (Fair Value Gap) near 3463, and is now showing momentum towards the 3515 supply zone.
✅ BUY Setups
Buy Zone 1: 3418 – 3422
Strong demand area with trendline support and liquidity sweep.
Stop Loss: 3410
Targets: 3430 – 3445 – 3455 – 3460+
Buy Scalp Zone: 3352 – 3350
Deeper liquidity grab area, suitable for quick scalps.
Stop Loss: 3344
Targets: 3360 – 3380 – 3400
👉 All buy zones are aligned with the dominant bullish structure. Best approach: wait for retracements to go long.
❌ SELL Setup
Sell Zone: 3515 – 3517
H1 supply area overlapping with resistance.
Stop Loss: 3522
Targets: 3500 – 3485 – 3475 – 3465 – 3450
👉 Short trades here are only meant for quick pullbacks. The bigger bias remains bullish unless a strong bearish ChoCH shows up.
📌 Conclusion
Main bias: Buy on dips at 3415–3422, 3442–3447, and scalp at 3352–3350.
Secondary play: Short at 3515–3520 targeting demand.
Key level: Watch the FVG at 3463 for market reaction.

Will Gold Return to 3400?Market Context
Price has registered multiple bullish break of structure, confirming short-term bullish momentum.
A supply zone around 3449 – 3451 may trigger liquidity-driven reactions.
The fair value gap between 3360 – 3310 is still open and could pull price down before continuation.
Key Levels
Supply Zone: 3449 – 3451
Buy Zone 1: 3396 – 3400 (Stop Loss: 3390)
Buy Zone 2: 3310 – 3315 (Stop Loss: 3303)
FVG Zone: 3360 – 3310
Trading Scenarios
Primary Buy Setup
Entry: 3396 – 3400
Stop Loss: 3390
Target: 3449 – 3460 liquidity sweep
Secondary Buy Setup
Entry: 3310 – 3315
Stop Loss: 3303
Target: 3396 – 3449
Counter-trend Sell
Entry: 3449 – 3451, provided rejection is visible
Stop Loss: above 3458
Target: 3400 demand
Summary
The overall bias stays bullish with two key demand zones in play: 3400 for a shallow retracement and 3310 for a deeper liquidity sweep. Short positions near supply remain valid only as quick counter-trend trades.

XAUUSD ANALYSIS 01-SEP-2025LTP: 3475.xx
Supports: 3397/3310/3264/3119
Resistance: 3501
As long as the above supports hold, we can see more bullish action towards 3700/900/4000+
Upside targets:
3450-3485 (Min. Target) - DONE.
3534-3555-3591 (Normal Target)
3637
3677-3700-3734 (Ultimate Target )
3819-3834-3910 (Extension 1)
4155 (Extension 2)

Elliott Wave Analysis – XAUUSD (01/09/2025)
Momentum
• D1 timeframe: Momentum has been stuck in the overbought zone for the past 4 days, showing strong buying pressure. However, this also creates noise since extended overbought conditions can reverse at any time.
• H4 timeframe: Momentum is about to turn down in the overbought zone. Once an H4 candle closes with confirmation, we can expect a correction lasting around 4–5 H4 candles.
• H1 timeframe: Momentum is heading into the overbought zone. Within 1–2 more H1 candles, a short-term pullback is likely.
________________________________________
Wave Structure
• D1 timeframe:
Price has risen sharply and steeply, with momentum staying overbought for a long time. This suggests that wave 4 has likely completed, and the market is entering a long-term uptrend. The minimum target is 3684 (equal to the length of wave W).
• H4 timeframe:
Price is currently in red wave 3. We expect a correction into red wave 4, which aligns with H4 momentum preparing to turn down.
• H1 timeframe:
o Wave i (green) is labeled as a leading diagonal, even though wave ii (green) did not retrace as deeply as expected.
o Price is now in an extended wave iii (green).
o Within wave iii (green), a 5-wave structure 1-2-3-4-5 (red) is unfolding. Red wave 3 has already completed with its internal 5-wave (black).
o The target for black wave 5 was achieved at the Fibonacci 0.618 projection of black waves 1–3 → confirming that red wave 3 has completed and price is now correcting into red wave 4.
• Red wave 4 outlook:
Likely to take shape as a zigzag, flat, or triangle. Two retracement zones are identified:
1. 3462 – 23.6% retracement of red wave 3.
2. 3447 – 38.2% retracement of red wave 3.
Considering the guideline that wave 4 often returns to the territory of wave 4 of a smaller degree, and that H4 momentum needs more time to move into the oversold zone, we select 3447 as the primary target for a sell setup.
________________________________________
Trade Plan
• Buy Zone: 3448 – 3446
• Stop Loss: 3438
• Take Profit:
o TP1: 3485
o TP2: 3521

Gold SPOT XAUUSD SHORT idea at 3469 after 23 July 2025GOLD XAUUSD Short idea : Trade will activate on 23 July 2025 ..Gold Should Short from 3469

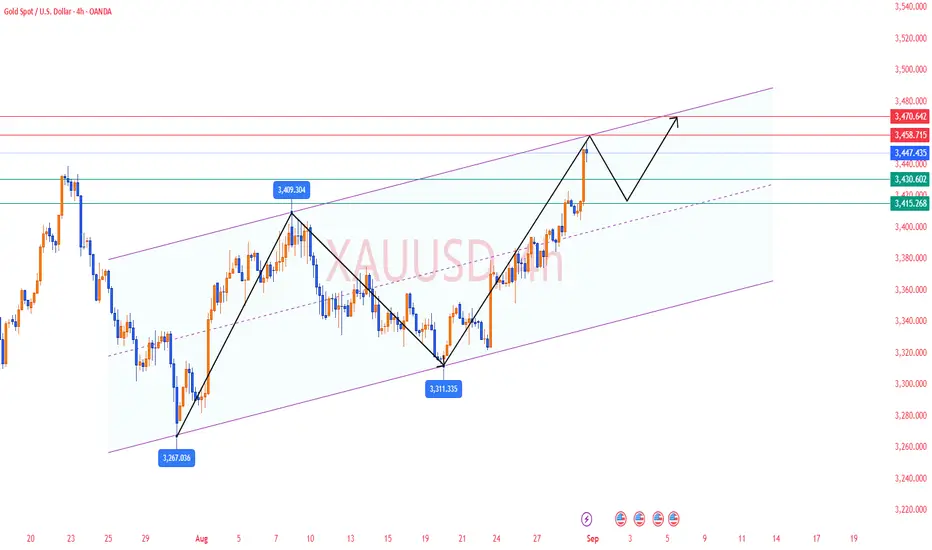
Gold Trading Scenario – Start of the WeekGold Trading Scenario – Start of the Week
Hello traders,
A new week begins with gold holding above the 34xx zone, establishing a fresh value area. The current structure has already broken through major resistance levels on the higher timeframe – including trendline and H4 barriers – confirming strong bullish momentum.
The uptrend played out exactly as expected, reaching the target around 3450 (specifically 3454). Now price is seeing a mild pullback. This will only be considered a trend reversal if price breaks below 3404. Otherwise, it is just a secondary correction as per Dow theory.
Wave 5 may be complete, but the ABC structure is still unclear. For that reason, the plan is to continue with long positions in line with the trend, which increases the probability of success.
Buy zone for today: 3408–3412, an area where sellers previously failed at resistance and which was broken through the trendline on Friday.
This is my outlook for Monday, viewed from a medium-term perspective. Take it as reference, and feel free to share your thoughts in the comments.

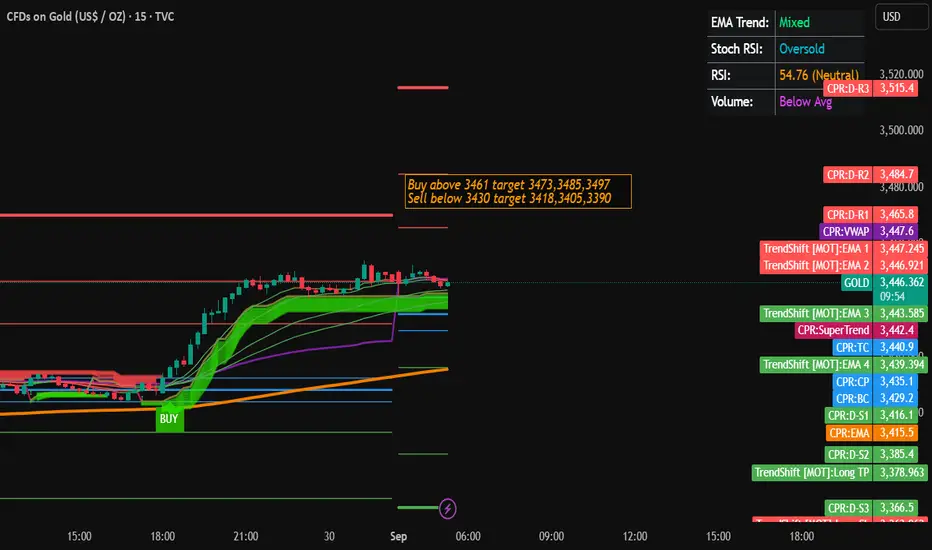
Gold Trading Strategy for 01st September 2025📊 TVC:GOLD Intraday Trade Setup
✨ Buy Setup
🟢 Buy above the high of the 30-min candle close if price sustains above $3461
🎯 Targets:
$3473 ✅
$3485 ✅
$3497 ✅
✨ Sell Setup
🔴 Sell below the low of the 1-hour candle close if price sustains below $3430
🎯 Targets:
$3418 ✅
$3405 ✅
$3390 ✅
⚠️ Disclaimer:
📌 This analysis is for educational purposes only. Trading in commodities, forex, or stocks involves high risk. Please do your own research (DYOR) and consult with your financial advisor before taking any positions. I am not responsible for your profits or losses.
Gold Analysis and Trading Strategy for Monday✅ Daily Chart: The Bollinger Bands continue to expand, and spot gold is trading near the upper band, showing strong momentum. The MACD is running in a golden cross, and the RSI has rebounded from oversold territory, indicating that gold has clear demand for a bottom rebound.
However, close attention should be paid to the 3450–3455 trendline resistance. If the price fails to break above this level effectively, it could limit further upside potential.
✅ 4-Hour Chart: The Bollinger Bands are opening upward, with gold trading just below the upper band. The MACD golden cross momentum is narrowing, and the RSI has retreated from overbought levels, suggesting that the upward trend is slowing and that short-term correction pressure may emerge.
✅ 1-Hour Chart: Gold is currently trading near the middle Bollinger Band. The MACD has formed a death cross, and the RSI has fallen back from overbought levels, indicating weakening upward momentum and highlighting the risk of a pullback after overbought conditions.
🔴 Resistance Level: 3450–3455
🟢 Support Level: 3415–3420
✅ Trading Strategy Reference:
🔰 Long Strategy: The overall trend remains bullish, so the main approach is to buy on pullbacks. If gold retraces to the 3415–3420 support zone and holds, light long positions may be considered with targets at 3440–3450.
🔰 Short Strategy: If the price tests the 3450–3455 resistance zone multiple times without a valid breakout, and bearish signals such as divergence or a shooting star candlestick appear, light short positions can be considered. Stop-loss above 3460, with downside targets at 3430–3420.
✅ Conclusion:
Gold is currently in a high-level consolidation phase after rebounding, with upward momentum showing signs of weakening. The key for Monday’s trading lies in whether the 3450–3455 resistance zone can be broken. The recommended approach is to buy on pullbacks as the primary strategy, and sell on rebounds as a secondary strategy, while strictly enforcing stop-loss measures to control risk.
Gold Next MoveExecution Plan
1. Entry
Primary Long Setup:
Wait for price to dip into the $3,429–$3,423 demand zone.
Look for bullish rejection candles (wicks, engulfing, or strong bounce).
Enter long above $3,430–$3,433 confirmation.
Aggressive Entry:
If price holds above $3,437, a long can be initiated with tighter risk.
⸻
2. Stop Loss
Conservative: Below $3,423 (around $3,420).
Aggressive: Below $3,404 (major support/invalidation).
⸻
3. Targets
Target 1: $3,445 (near-term bounce).
Target 2: $3,453–$3,455 (recent high/resistance).
Target 3 (extended): $3,470+ if momentum continues.
⸻
4. Alternative Scenario
If price breaks below $3,404, bullish setup is invalid → stay out or switch bias to short.
In that case, downside may extend to $3,380–$3,385.
⸻
In summary:
Buy the dip near $3,429–$3,423 zone with stop below $3,404.
Take profits near $3,453–$3,470.
Only flip bearish if $3,404 is broken with strong momentum.

Gold’s Relentless Rally – A Lesson for Every TraderIn the past week, Gold surged strongly without any meaningful pullback, leaving many traders who were holding sell positions trapped. Without a retracement based on technical analysis, countless accounts went into heavy drawdown – some even facing complete wipeouts.
👉 What happened here?
Markets don’t always follow textbook technicals.
In volatile phases, traders often let losing trades run, ignoring their Stop-Loss.
This “hope mindset” is exactly what destroys capital faster than anything else.
💡 The key lesson for us all:
Risk management is not optional – it’s the foundation of survival in trading. A single trade without an SL may not seem dangerous, but over time, it’s the biggest reason traders lose their hard-earned money.
The market will always be unpredictable. But these are the moments where discipline and patience separate serious traders from those who get punished by the market.
🔑 MMFlow Insight for Indian Traders:
Markets don’t owe us profits. They reward only those who respect risk, stay calm, and stick to their trading rules. Protect your capital first – opportunities will always come.
👉 Stay disciplined. Respect your stop. Trade smart, trade safe.

Gold next movePresent bull run in gold that started in October of 2023 had 4 major consolidations with each lasting on average 3 to 4 months. The present 4th consolidation lasted a little over 4 month, which is quite similar to the 2nd one.
Each breakout from a horizontal resistance resulted initially in a limited rally then 3-4 week short-term consolidation (elliptic shape) followed by a stronger rally.
If the same pattern plays out, then I expect
1. Gold to reach approximately $3,600 within 2 weeks.
2. Consolidate for 3 - 4 weeks within elliptic shape.
3. Final run, in present cycle, to my to $3,900 - 4,000 price target within 3 - 4 weeks.
All in all, gold should be able to reach price target within 8 to 10 weeks, which targets late October to early November 2025.

Part 4 Learn Institutional TradingBasics of Options (Calls & Puts)
There are two main types of options:
Call Option: Gives the holder the right to buy the underlying asset at a fixed price (called the strike price) before or on the expiry date.
Example: You buy a Reliance call option with a strike price of ₹2500. If Reliance rises to ₹2700, you can buy at ₹2500 and gain from the difference.
Put Option: Gives the holder the right to sell the underlying asset at the strike price before expiry.
Example: You buy a Nifty put option with a strike price of 22,000. If Nifty falls to 21,500, your put gains in value since you can sell higher (22,000) while the market trades lower.
In simple terms:
Calls = Right to Buy
Puts = Right to Sell
How Options Work (Premiums, Strike Price, Expiry, Moneyness)
Every option has certain key components:
Premium: The price you pay to buy the option. This is determined by demand, supply, volatility, and time to expiry.
Strike Price: The fixed price at which the option holder can buy/sell the asset.
Expiry Date: Options are valid only for a certain period. In India, index options have weekly and monthly expiries, while stock options usually expire monthly.
Moneyness: This defines whether an option has intrinsic value.
In the Money (ITM): Already profitable if exercised.
At the Money (ATM): Strike price equals the current market price.
Out of the Money (OTM): Not profitable if exercised immediately.
