GOLD 1H Analysis🔹 After a sharp bearish leg, Gold is currently consolidating inside a rising wedge pattern on the 1H timeframe — a classic bearish continuation setup.
🔍 Technical Breakdown:
Pattern: Rising Wedge (typically breaks down)
Structure: Lower highs and higher lows forming tight price action
Price Rejection Zone: Around ₹3,321 – ₹3,334
Support Zone: ₹3,308 – ₹3,299 (critical breakout region)
🎯 Key Levels:
Resistance: ₹3,334 (Wedge Top), ₹3,321
Immediate Support: ₹3,308 → ₹3,299
Bearish Targets:
TP1: ₹3,266
TP2: ₹3,223
🧠 Trading Idea:
📉 If price breaks below ₹3,308 with strong volume or bearish momentum, we may see a sharp move toward the lower green zones.
CFDGOLD trade ideas


Gold Analysis and Trading Strategy | July 30✅ Fundamental Analysis
🔹 Short-Term Decline in Safe-Haven Demand:
Recent developments, including the U.S.-EU tariff agreement and the resumption of U.S.-China trade talks, have temporarily eased market tensions, weakening gold's appeal as a safe-haven asset.
🔹 Dollar Rebound Pressures Gold:
The U.S. Dollar Index rebounded sharply after a second bottoming attempt, breaking above the key 98.10 resistance level. This strengthened pressure on gold and limited its upward potential.
🔹 FOMC Rate Decision in Focus:
The Federal Reserve will announce its interest rate decision today. The market’s focus is on whether a signal for a potential rate cut in September will be delivered.
If the statement is hawkish, downplaying the chances of a rate cut, the dollar may strengthen further, possibly pushing gold to test support near $3300.
If the Fed adopts a dovish tone or hints at a September rate cut, it may trigger a breakout above the $3350 resistance level.
🔹 Key U.S. Economic Data Ahead:
Today also brings the release of ADP employment data and the Q2 GDP revision.
If GDP growth exceeds expectations (>2.0%), it may strengthen the case for prolonged higher interest rates, which would be bearish for gold.
If data disappoints, it could reinforce dovish expectations and support a rebound in gold prices.
✅ Technical Analysis
🔸 Gold continues to fluctuate within the $3333–$3320 range, reflecting a market in wait-and-see mode ahead of the Fed decision.
🔸 Short-term price action still favors the bearish side, but strong support below and persistent geopolitical risks are offering some downside protection for gold.
🔴 Resistance Levels: 3355 / 3375 / 3380
🟢 Support Levels: 3310 / 3300 / 3280
✅ Trading Strategy Reference:
🔰 If the price rebounds to the 3355–3365 zone, consider light short positions
⛔Stop-loss: Above 3380
🎯 Target: Around 3320
🔰 If the price pulls back and stabilizes around 3310–3300, consider short-term long positions
⛔ Stop-loss: Below 3285
🎯 Target: 3340
🔰 If the price breaks below 3300, bearish momentum may extend toward 3280
🔰 If the price breaks above 3355, the bearish structure will likely fail, and gold may resume its upward trend
✅ With the market entering a high-impact news period at month-end, volatility is expected to increase significantly. Traders should set stop-losses strictly and manage position sizes carefully to mitigate the risks of sudden market moves.

Gold price drops with FOMC today: 3342Plan XAU day: 30 July 2025
Related Information:!!!
Gold prices (XAU/USD) remain confined within a narrow range around the $3,325 level during the Asian session on Wednesday, struggling to extend the previous day's modest gains. Persistent market caution ahead of a pivotal central bank event lends some support to the safe-haven precious metal. In addition, a slight retreat in the US Dollar (USD) from a more than one-month high reached on Tuesday could provide an added boost to gold prices.
That said, upside potential appears limited, as investors exhibit restraint and await further clarity on the Federal Reserve's (Fed) monetary policy trajectory before making directional commitments. Meanwhile, the prevailing consensus that the Fed will maintain higher interest rates for an extended period is likely to prevent a significant USD pullback. Coupled with renewed trade optimism, these factors may continue to cap any meaningful gains in the XAU/USD pair
personal opinion:!!!
Gold price accumulated and compressed since the beginning of the week. Waiting for today's interest rate announcement. Decreased back to 3300.
Important price zone to consider : !!!
resistance zone point: 3342 zone
Sustainable trading to beat the market
Live : XAUUSD - TP hit - 30th July Session : Pre London / London Open
A green candle formed support,
Anticipated 1 hour candle wick fill
entered Long position ,
Closed with 1:1 tp
Happy Trading .!

XAUUSD (GOLD ) BO STRUCTURE SHORT TERMCurrently, the price is hovering near the mid-support box (~3300 zone) with a small bullish candle, indicating a possible bounce. The two blue arrows highlight potential scenarios:
A bullish breakout towards the upper resistance zone (~3427), if price holds and reverses upward from current support.
A bearish breakdown towards the lower support (~3201), if price breaches the current demand zone.

Gold price analysis before FOMC Looking at current price action, after sharp decline we witnessed earlier. Gold has found support around the monthly open level between 3300-3310, which is acting as a solid support zone right now. now price is attempting to climb higher with the help of ascending trendline, but it's running into resistance at the weekly open around 3329-31.
If we can see a clean breakout above this weekly resistance, I'd expect gold to make a move toward the 3350 level as the next logical target. Beyond that, we've got the pivot at 3367 which will likely serve as a stronger resistance barrier. On the downside, our immediate support remains at that trendline, with the major support zone at 3300 acting as our safety net.
Today's Fed interest rate decision is the major market mover event;;that could dictate gold next directional move. Personally, I'm leaning toward seeing some upward momentum today, but the real test will be whether price can hold those higher levels or if we'll see rejection and another leg down. The key is watching how gold reacts to whatever the Fed delivers and whether buyers can step in with conviction at these elevated levels. It's definitely a day to stay alert and let the market show its hand before making any big moves.

xau/gold get ready taken onxau/gold on AMD mode once compelete the accumulation when market trigger manipulation and start bullish... wait and watch today economic news night fed rate and fomc statement .once economic data release after take trade

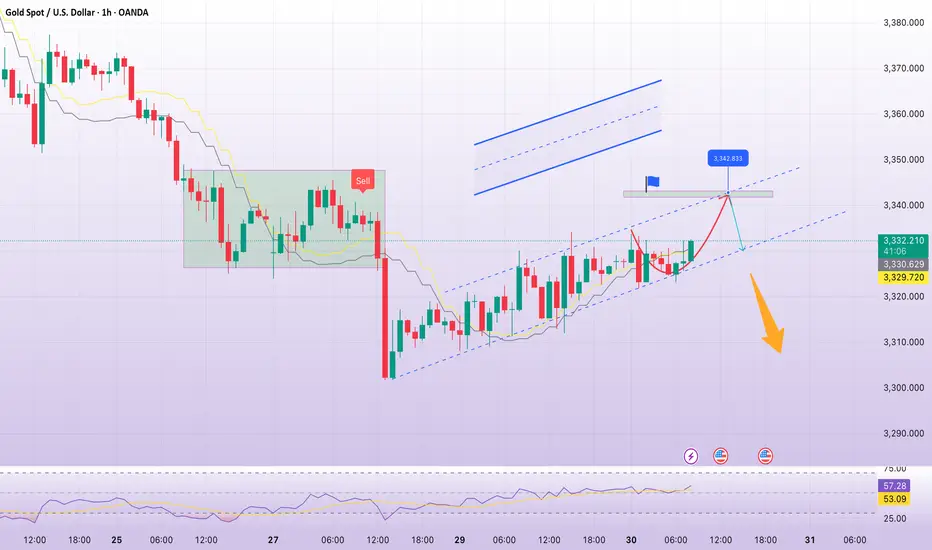
Gold rebounds – Enough to shift the trend?Gold is trading within an ascending channel, recently bouncing modestly from the trendline after a series of declines. The structure suggests XAUUSD could continue a technical rebound toward the resistance zone near 3,374 before a new trend is confirmed.
On the news front, JOLTS job openings came in slightly below expectations, indicating a cooling U.S. labor market. This offers mild support for gold, as the Fed may consider easing policy sooner. However, with the figure still above 7 million, the impact remains short-term.
Strategy: Watch price reaction near the 3,374 zone. If it fails to break through, the bearish scenario remains dominant. Short-term buying may be considered as long as the trendline holds.

This is in SR Intrchange area.. after this it should support this level otherwise it will fall to its liquidity or OB area

Gold Trading Strategy for 30th July 2025📊 GOLD (XAU/USD) INTRADAY PLAN
🟢 BUY SETUP – Buy Above the High
✅ Condition:
Identify the latest 1-hour candle.
Buy only if the price closes above the high of that candle (above 3334).
⏳ Entry Timing: Enter after candle closes above the high.
🎯 Target Levels:
3344 – Book partial profit
3355 – Continue holding if trend is strong
3366 – Final target if bullish momentum continues
🛡️ Stop Loss (SL):
Place below the same 1-hour candle’s low.
⚡ Tip: Wait for a strong breakout candle to avoid false entries.
🔴 SELL SETUP – Sell Below the Low
✅ Condition:
Identify the latest 1-hour candle.
Sell only if the price closes below the low of that candle (below 3308).
⏳ Entry Timing: Enter after candle closes below the low.
🎯 Target Levels:
3298 – Book partial profit
3287 – Hold if bearish trend continues
3276 – Final target if heavy selling continues
🛡️ Stop Loss (SL):
Place above the same 1-hour candle’s high.
Tip: Confirm with volume spike or trend direction before shorting.
💡 GENERAL INSTRUCTIONS:
📌 Always wait for candle close to avoid fake breakouts or breakdowns.
📊 Confirm with RSI/MACD for better accuracy.
⏱️ Focus on London & New York sessions for higher volatility in gold.
💰 Risk Management: Risk 1-2% of capital per trade and use trailing SL for safety.
⚠️ DISCLAIMER:
Trading Gold and other commodities involves significant risk and is not suitable for all investors.
The above levels are for educational purposes only.
Always do your own analysis and use strict stop-loss to protect your capital.

Today's Gold Price: Short at HighsToday's Gold Price: Short at Highs
As shown in the chart:
Rebound Short Strategy
Resistance: 3330-3350
Support: 3310
Technical Analysis:
1: As long as the gold price is below 3330, the market is bearish.
2: As long as the gold price is below 3350, the market is short.
3: As long as the gold price is above 3300, the long position is to buy on dips.
Specific Strategy:
Aggressive Strategy:
Sell: 3325-3330
Stop Loss: 3335
Target Price: 3310
Conservative Strategy:
Sell: 3340-3350
Stop Loss: 3355
Target Price: 3330-3310
Bottom Picking Strategy:
Buy: 3300-3310
Stop Loss: 3290
Target Price: 3350+/3400+

Rising wedge with equal highs| Aspect | **2016 Chart** (Image 2) | **2025 Chart** (Image 1) |
| ----------------- | --------------------------------- | ------------------------------------ |
| Pattern Type | Rising wedge with **lower highs** | Rising wedge with **equal highs** |
| Key Resistance | \~\$1,370 zone (flat top) | \~\$3,465 zone (flat top) |
| Trendline Support | Broken around \~\$1,315 | Just **testing break** at \~\$3,310 |
| Retest Zone | \~\$1,325–\$1,340 (small bounce) | Likely retest \~\$3,250–\$3,300 zone |
| Fall Target | \~\$1,200–\$1,150 zone | Targeting \~\$2,960 and below |

Gold Extends Correction, Retests $3300, Struggles to Clear $3332Gold extends downward correction reaching 3301 yesterday evening which is a tad below 61.8% Fibonacci zone and starts bounce back off the lows reaching immediate resistance 3330.
Price is currently consolidating above immediate support 3313 which if breaks, expect further decline towards retest of 3300 and extend downward correction to next leg lower 78.6% Fibonacci zone at 3291 and 3286
Gold rebound requires break and stability above 3332 which next targets 3342 followed by 3352 while next major resistance sits at 3365-3368
Note: As long as Gold maintains stability above local demand zone 3313, there's technical factors indicate possible rebound possibilities

Breaking 3322, gold price continues to recoverPlan XAU day: 29 July 2025
Related Information:!!!
Gold prices (XAU/USD) advance to a new intraday high during the first half of the European session on Tuesday, recovering from the nearly three-week low around the $3,300 level reached the previous day. As market participants absorb the latest wave of trade-related optimism, lingering uncertainty ahead of this week’s key central bank events and high-impact US macroeconomic releases continues to lend support to the safe-haven precious metal.
At the same time, the US Dollar (USD) has eased slightly from its highest level since June 23, providing an additional tailwind for gold. Nonetheless, the increasingly widespread expectation that the Federal Reserve (Fed) will maintain elevated interest rates for an extended period is likely to limit any significant USD correction. Consequently, this may act as a headwind for the XAU/USD pair as attention turns to the highly anticipated FOMC meeting set to commence later today.
personal opinion:!!!
Gold price recovered, broke 3322. Good buying power, continued to recover and accumulate above 3300
Important price zone to consider : !!!
Support zone point: 3322, 3302 zone
Sustainable trading to beat the market

Gold XAUUSD Trading Strategy July 29, 2025Gold XAUUSD Trading Strategy July 29, 2025:
Yesterday's trading session, gold prices continued to fall as expected. After approaching the resistance area of 3300, gold prices are recovering.
Basic news: The market is almost unlikely to see the possibility of the FED cutting interest rates in July and about 40% chance that the FED will continue to keep interest rates unchanged in September, up from about 10% the previous month. US non-farm payrolls are likely to continue to increase rapidly, showing a rapid recovery in the labor market.
Technical analysis: Gold prices continue to stick with the MA lines, the downtrend channel has not been broken. Currently, the 3280 - 3285 area may be a support area for gold prices to recover after the previous sharp decline. We will mainly trade according to the short-term trend and wait for a long-term buying point.
Important price zones today: 3330 - 3335, 3350 - 3355 and 3280 - 3285.
Today's trading trend: SELL.
Recommended orders:
Plan 1: SELL XAUUSD zone 3333 - 3335
SL 3338
TP 3330 - 3320 - 3300 - 3280.
Plan 2: SELL XAUUSD zone 3353 - 3355
SL 3358
TP 3350 - 3340 - 3320 - 3300.
Plan 3: BUY XAUUSD zone 3283 - 3285
SL 3280
TP 3288 - 3300 - 3320 - 3340 - Open.
Wish you a safe, successful and profitable trading day.💗💗💗💗💗

Elliott Wave Analysis – XAUUSD – July 28, 2025📊
________________________________________
🔍 Momentum Analysis:
• D1 Timeframe: Momentum has entered the oversold zone. This strongly suggests a potential bullish reversal today, which could lead to a rally or sideways movement lasting around 4–5 days.
• H4 Timeframe: Momentum is reversing upward. This indicates a likely bullish or sideways move in the short term, at least until momentum reaches the overbought zone (estimated within the next 2 H4 candles).
• H1 Timeframe: Momentum is currently overbought, so we may first see a pullback or sideways movement until a clearer reversal signal appears.
________________________________________
🌀 Wave Structure Analysis:
• On the H4 chart, as noted in previous plans, the assumption that price is forming a contracting triangle (abcde) is still valid. Price is currently in the final leg (wave e) of this triangle.
• On the H1 chart, we can observe a channel structure, within which an abc corrective pattern is unfolding.
• The lower boundary of the triangle (marked by the green trendline) combined with support zones will be critical areas to monitor for the end of wave e.
🔺 Note: Wave e does not necessarily end precisely at the triangle boundary – it can slightly overshoot. Hence, we’ll rely on smaller wave structures to identify potential reversal zones.
________________________________________
🎯 Key Price Zones to Watch:
• Target 1: 3329
• Target 2: 3309
• Target 3: 3290
________________________________________
🔎 Lower Timeframe Structure (M10):
From the current price action (as shown in the chart), we can see a leading diagonal triangle structure forming. This is a pattern commonly seen in wave 1. If this pattern is confirmed, a sharp and steep decline toward the 3329 zone is likely.
________________________________________
⚖️ Combining Momentum & Wave Structure:
• D1: Signals a potential reversal → favors Buy setups.
• H4: Momentum is rising, but price hasn’t confirmed a new bullish trend → need to stay alert and tighten Stop Loss.
• H1: Overbought + possible leading diagonal → Expecting a pullback for wave 2 toward 3329 → this would be the optimal Buy zone.
________________________________________
🧭 Trade Plan:
• For experienced traders:
→ Wait for price to reach key levels and watch for reversal signals before entering.
• For beginners:
→ Use the following Limit Buy setup:
✅ Setup 1:
• Buy zone: 3330 – 3328
• Stop Loss: 3320
• TP1: 3351
• TP2: 3370
• TP3: 3385
✅ Setup 2:
• Buy zone: 3310 – 3308
• Stop Loss: 3300
• TP1: 3328
• TP2: 3351
• TP3: 3370

GOLD: Is This Just the Calm Before a Bigger Move? – GOLD: Is This Just the Calm Before a Bigger Move?
Gold has dropped nearly $50 in the last 4 sessions — showing strong bearish momentum, but is the downside exhausted? Or is this just a pause before continuation?
🔍 Macro Drivers:
Recent US–EU defense and trade agreements have weighed on gold's safe-haven appeal.
Strong US economic data has pushed USD and equities higher, redirecting flows out of precious metals.
Market sentiment is leaning short-term risk-on, which is bearish for gold – but key technical levels are approaching.
📊 Technical Context – H12 Structure:
Price broke below 3,342 key support, retested it and rejected — validating short-term supply zone.
Price is now consolidating between Sell-side liquidity (3,301–3,292) and deeper FVG/OBS zone around 3,270.
Above, multiple sell zones align at Fib 0.5–0.618 retracement with order blocks and fair value gaps.
🔧 Trade Scenarios (Plan for Reaction – Not Prediction):
🟢 BUY SCALP – Quick bounce off demand zone
Entry: 3,292 – 3,290
SL: 3,285
TPs: 3,296 → 3,300 → 3,305 → 3,310 → 3,315 → 3,320 → 3,325 → 3,330
📍Low-risk intraday bounce play from liquidity pocket
🟢 BUY SWING – Deeper test of FVG/OBS zone
Entry: 3,272 – 3,270
SL: 3,265
TPs: 3,276 → 3,280 → 3,284 → 3,288 → 3,292 → 3,294 → 3,300 → open
📍Higher R:R setup if price sweeps final liquidity zone
🔴 SELL SCALP – Rejection from short-term resistance
Entry: 3,340 – 3,342
SL: 3,346
TPs: 3,335 → 3,330 → 3,325 → 3,320 → 3,310
📍Reaction-based trade if price fails to reclaim the zone
🔴 SELL SWING – Deeper pullback into macro zone
Entry: 3,370 – 3,372
SL: 3,376
TPs: 3,365 → 3,360 → 3,355 → 3,350 → 3,345 → 3,340 → 3,330 → 3,320
📍FVG + CP zone overlap with strong OB; ideal for patient sellers
⚠️ Risk Notes:
Watch for false breakouts/liquidity traps near session opens.
Wait for price confirmation; reaction over prediction.
Maintain disciplined risk management – this is a volatile area.
🧭 I’ll be tracking price behavior at these zones closely.
If this approach to mapping price action resonates with you —
Feel free to stay connected or share your bias in the comments.

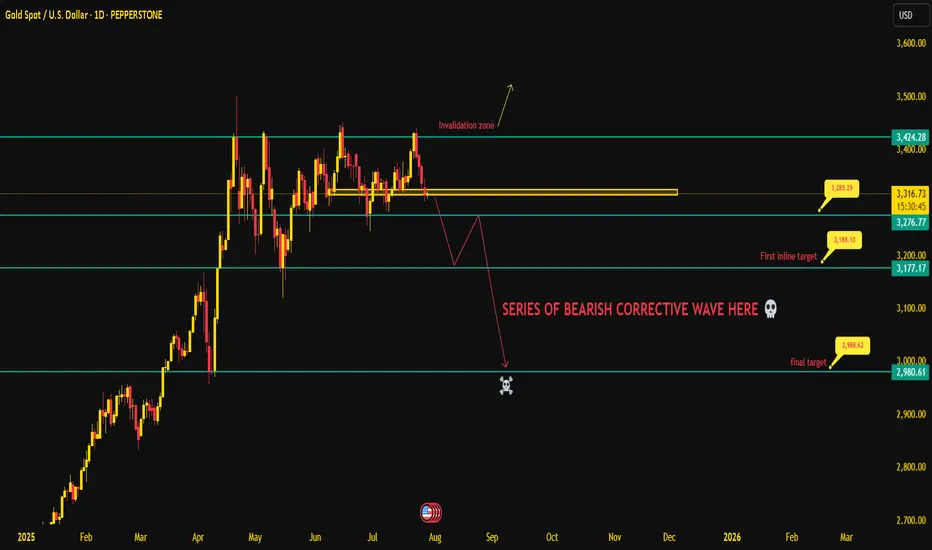
Gold Outlook One Wrong Close Away from a FlushGold's been quietly coiling for weeks inside this suffocating structure between 3340 and 3270. Every single rally got sold into. No follow-through. No real demand. Just mechanical rebounds off liquidity zones textbook signs of exhaustion. Today, price is balancing right on the edge of the final support shelf: the 3285– 3310 structure base. If that shelf cracks on a daily close… lights out.
This isn’t a breakdown you chase this is one you position into. Because what follows is not just a flush it’s a multi-leg corrective sequence that the market’s been setting up since early May. The first wave draws down to 3190. That’s the soft zone. The real demand void begins after that, and if momentum accelerates price will seek that 3000–2980 final liquidity pocket. That’s the zone where the algo stops checking for bids and starts breaking them.
And make no mistake It’s a price action recalibration of a market that ran way ahead of itself. Monthly candles show rejection after rejection from HVZ tops. Weekly structures are screaming divergence. Liquidity’s been drying up since June. This isn’t fear it’s precision distribution.
Now, flip side? Yes the invalidation zone is brutally clear. Any daily breakout + close above 3430 is the line in the sand. That’s when the bearish thesis goes straight to the bin. Until then, every bounce is a liquidation opportunity.
The script is ready. The waves are drawn. The risk is compressed. All it needs is one close just one below this zone. And then, the sequence begins.
This ain’t a dip. It’s a descent. Stay sharp. 🩸
Gold dives toward 3,320 as Fed decision loomsHello everyone, what are your thoughts on gold prices?
Gold's decline is accelerating, dragging the precious metal down toward the 3,320 USD mark. A stronger U.S. dollar and further developments on the trade front following the U.S.-EU agreement have significantly impacted demand for safe-haven assets.
From a technical perspective, the break below the rising price channel could mark the beginning of a deeper correction. Oscillators on the chart have just started turning negative, suggesting that the path of least resistance for gold is now downward.
Looking ahead, Wednesday’s key FOMC decision—along with the accompanying policy statement and Powell’s press conference—will be closely scrutinized for clues on the Fed’s interest rate cut roadmap.
Additionally, investors will face several important U.S. macroeconomic data releases this week, which will play a vital role in shaping the USD’s trajectory and provide new momentum for XAUUSD.
What do you think about the precious metal? Share your thoughts below!

Gold plunges as Fed stays firm, war fails to boost XAUUSD is showing clear signs of weakness after peaking at 3,375 and consistently forming lower highs. On the H2 chart, the price action confirms a completed distribution pattern and is now consolidating ahead of a potential breakdown below 3,283.
News highlights:
The US ADP and GDP reports exceeded expectations, strengthening the case for the Fed to keep interest rates higher for longer – putting significant pressure on gold.
Although the JOLTS job openings dipped slightly, the figure remains above 7 million, offering little support for gold recovery.
Conflict news between Thailand and Cambodia might offer some support, but the impact is limited due to the small regional scale.
Trading strategy: Prioritize SELL if price pulls back to 3,339 and fails to hold. The next target is around 3,252.
The main trend remains bearish unless XAUUSD breaks above 3,360.
Do you think XAUUSD will break the bottom this week?

XAU/USDThis XAU/USD trade setup is a buy trade, indicating an expectation that gold prices will rise. The entry price is 3318, the stop-loss is set at 3307, and the exit price is 3346. This setup shows a bullish outlook on gold, with the trader aiming to capture an upward move of 28 points from entry to exit. The stop-loss at 3307 limits the downside risk to 11 points, providing a reasonable risk-to-reward ratio of more than 1:2.
Buying at 3318 suggests that the trader expects gold to gain strength due to factors such as a weaker US dollar, lower Treasury yields, or increased demand for gold as a safe-haven asset. The target of 3346 is set at a key resistance level, where the trader expects to book profits.
Proper risk management is essential because gold can be volatile, especially during major economic news releases or geopolitical events. The trade should be monitored closely, ensuring that market conditions support a bullish move.
Overall, this setup provides a structured plan to enter long at 3318, place a tight stop-loss at 3307, and exit at 3346, aiming for disciplined and profitable trading in XAU/USD.

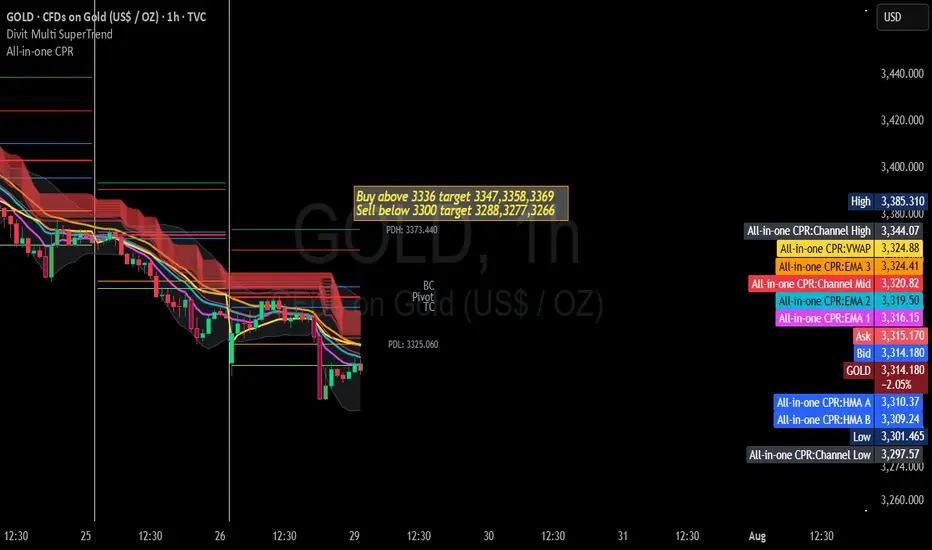
Gold Trading Strategy for 29th July 2025📢 GOLD Intraday Trade Setup📢
💰 Instrument: GOLD (XAU/USD)
📊 Strategy Type: Price Action Breakout (Candle Confirmation)
🕒 Recommended Timeframes: 15-Min, 30-Min or 1 hour Charts
✅ Buy Setup (Bullish Breakout Strategy)
🟢 Buy Above: $3336
📌 Entry Rule:
Wait for a strong bullish candle to close above $3336.
📈 Enter above the high of that closing candle for confirmation.
🎯 Targets:
🔹 Target 1: $3347
🔹 Target 2: $3358
🔹 Target 3: $3369
🔐 Stop-Loss: Just below the breakout candle's low or below $3330 support area.
🔻 Sell Setup (Bearish Breakdown Strategy)
🔴 Sell Below: $3300
📌 Entry Rule:
Wait for a strong bearish candle to close below $3300.
📉 Enter below the low of that closing candle for confirmation.
🎯 Targets:
🔸 Target 1: $3288
🔸 Target 2: $3277
🔸 Target 3: $3266
🔐 Stop-Loss: Just above the breakdown candle's high or above $3307 resistance.
🧠 Pro Tips for Today:
Use Volume and RSI to confirm breakout strength.
Avoid entries during high impact news events (check economic calendar).
Maintain risk-reward ratio of at least 1:2.
🧰 Tools to Use:
📍 Support/Resistance Levels
📉 Trendlines
🔁 Moving Averages (EMA 20/50)
📊 Volume Profile
⚠️ Disclaimer:
This content is for educational purposes only. Trading in financial markets involves substantial risk and is not suitable for all investors. Please conduct your own research or consult a certified financial advisor before making any trading decisions. We are not liable for any financial loss or gain based on this information.