XAUUSD – Wave (4) Pullback Could Launch Wave (5)Namaste Traders
Gold on the M30 chart remains bullish, but the push into the upper channel line signals short-term profit booking. For those trading Gold/USD or tracking Gold in INR terms on MCX, here’s my plan for the upcoming sessions:
🔍 Technical Overview
Price completed Wave (3) around 3697.40, tagging the upper trend channel – a natural zone for sellers to take profits.
The 3666–3670 region has acted as a pivot/support multiple times. I expect a Wave (4) correction into this zone before a fresh rally.
3657 is deeper support and also serves as the invalidation level for the bullish scenario.
If Wave (4) holds, Wave (5) could push towards 3720–3725.
📈 Key Levels
Type Price Level Notes
Resistance 3695–3700 Wave (3) top + upper channel edge – watch for rejection
Support (1) 3666–3670 Primary buy zone for Wave (4)
Support (2) 3657 Strong support & invalidation
Target (5) 3720–3725 Expected Wave (5) extension target
⚙️ Trading Plan
✅ Primary Setup – Buy the Dip (Trend Continuation)
Entry Zone: 3666–3670 (or a small sweep to ~3657).
Confirmation: Look for a bullish engulfing candle, pin bar, or MACD crossover on the M30 chart.
Take Profit:
TP1: 3695–3700 (previous high/resistance)
TP2: 3720–3725 (Wave (5) projection)
Stop Loss: Below ~3652.
Risk/Reward: Aim for 1:2 to 1:3.
⚠️ Secondary Setup – Countertrend Short
If price retests 3695–3700 and forms a strong rejection, a quick countertrend short is possible.
Targets: 3670 → 3657.
Stop Loss: Above ~3703–3707.
Use small position sizing, as this is against the primary trend.
🛡 Risk & Invalidation
A close below 3656 plus a break of the lower trend channel invalidates the bullish Wave (5) scenario.
For Indian traders watching MCX Gold (in INR), keep in mind USD/INR fluctuations – a weaker rupee can amplify gold gains even if spot prices pause.
Always keep risk ≤1–1.5% per trade and avoid chasing late entries.
🧭 Final Thoughts
Gold’s trend is still bullish on the short-term chart. A healthy correction into 3666–3670 could offer a prime entry for Wave (5). Be patient, wait for confirmation, and let the price come to your zone.
Countertrend shorts are valid only on a clear rejection at 3695–3700 – otherwise, stick with the trend.
Good luck and happy trading,
CFDGOLD trade ideas

Trading Analysis for Gold Spot / U.S. Dollar (15-Minute Chart)Buy XAU/USD now at 3644.00 level and hold at 3631.00 and target will be specific.
Entry Range 3642.00 to 3644.00
Take Profit 1 = 3646.00
Take Profit 2 = 3650.00
Take Profit 3 = 3654.00
Take Profit 4 = 3658.00
Stock Loss 3631.00
Key News Timings Chart Per.
i will try to update continue.

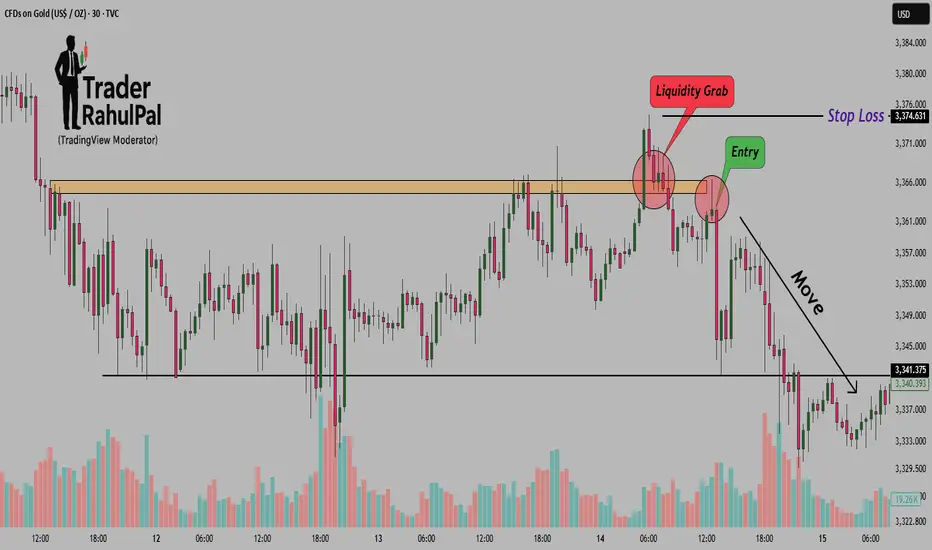
The Secret of Liquidity Grab – Why Price Hunts Highs Before FallHello Traders!
Have you ever noticed how the market first breaks a recent high, traps breakout traders, and then suddenly reverses? This is not random, it’s called a liquidity grab .
Understanding this concept can completely change how you see price action.
1. What is a Liquidity Grab?
Liquidity means orders in the market, stop losses, buy orders, sell orders.
When price hunts a previous high or low, it triggers stop losses and pending orders. This creates a sudden burst of liquidity.
Institutions use this liquidity to enter or exit large positions without causing slippage.
2. Why Price Hunts Highs Before Falling
At previous swing highs, many breakout traders place buy orders and short sellers place stop losses.
When the price spikes above that level:
Breakout traders enter long positions.
Short sellers’ stop losses get triggered (buy orders).
This creates a pool of buying liquidity. Once institutions have sold into this buying pressure, price often reverses sharply.
3. Why This Matters for Retail Traders
Most retail traders get trapped during these liquidity grabs.
They either chase breakouts too late or panic exit at the wrong time.
By recognizing this pattern, you can avoid being the liquidity and instead trade with the smart money.
4. How to Use This in Trading
Wait for the Grab: Don’t rush into a breakout. Wait to see if price quickly reverses after taking out a high/low.
Confirm With Volume: A liquidity grab often shows a sudden spike in volume followed by an opposite move.
Look for Rejection Candles: Pin bars, engulfing candles, or sharp wicks at highs/lows confirm the trap.
Rahul’s Tip:
Next time you see price breaking a high, don’t get excited. Ask yourself, is this a real breakout or just a liquidity grab? Waiting a little longer often saves you from being trapped.
Conclusion:
Liquidity grabs are the hidden traps of the market. Price doesn’t move randomly, it seeks liquidity first.
By understanding this, you can avoid becoming the victim and instead align yourself with the institutions.
If this post gave you clarity on liquidity grabs, like it, share your thoughts in the comments, and follow for more smart price action insights!
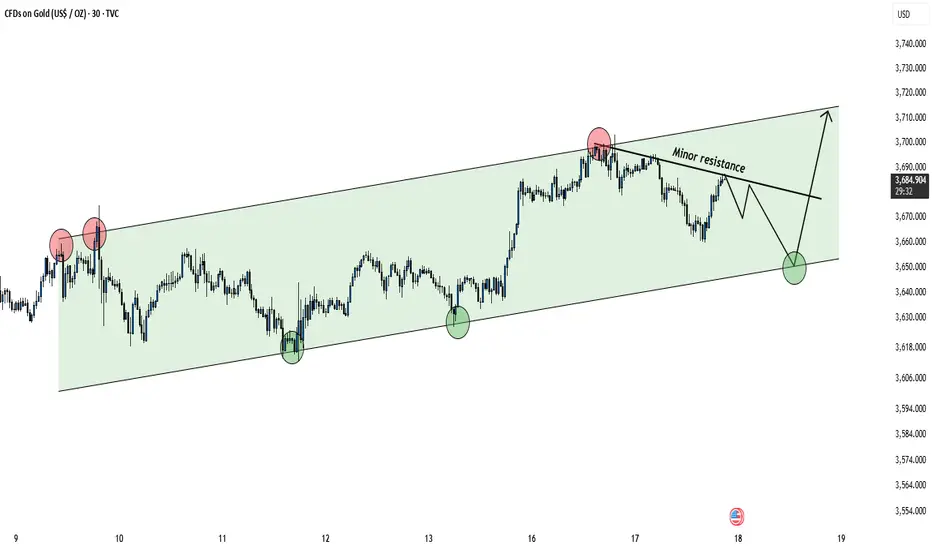
Gold Trading Inside Channel – Key Support & Resistance Levels!Hello Traders!
Gold is currently moving inside a well-defined ascending channel on the 30-min chart. Both buyers and sellers are respecting the levels of this channel, giving us clear trading opportunities.
Key Observations
Price has tested the upper channel resistance multiple times, facing rejection near $3,710–$3,720.
The lower channel support around $3,650 has been well respected, creating strong buying reactions.
A minor resistance trendline is now forming, which could temporarily limit upside momentum.
Short-term path suggests: rejection from minor resistance → retest of channel bottom → potential bounce back toward the upper channel.
Trading Plan
Bullish bias remains intact as long as Gold holds above $3,650 channel support.
A bounce from support may target $3,710–$3,720 zone again.
If support breaks, deeper correction may follow.
Rahul’s Tip
Always wait for confirmation near channel edges. Trading inside the channel can be tricky, but respecting support and resistance gives you high-probability setups.
Disclaimer: This analysis is for educational purposes only and should not be taken as financial advice. Please do your own research or consult your financial advisor before investing.
Analysis By @TraderRahulPal (TradingView Moderator) | More analysis & educational content on my profile
👉 If you found this helpful, don’t forget to like and follow for regular updates.
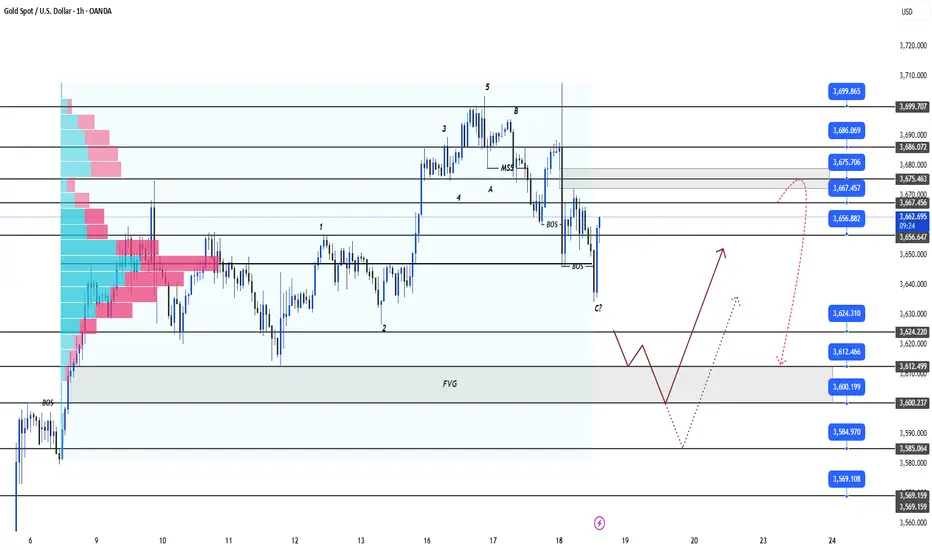
XAU/USD Technical Analysis: Major Levels, Market Structure, and 🔎 Current Snapshot
Price now: ~$3,684.98 per ounce.
Investing.com
Today’s trading range: ~$3,632.28 → $3,686.33.
Investing.com
Technical indicators (on sites like Investing.com) are showing a Strong Buy bias. Many moving averages & oscillators are in bullish territory.
⚙ Updated Key Levels (Support & Resistance)
Here are revised zones to watch, given the current price:
Immediate Resistance - $3700 Psychological round level; has been acting as near-term ceiling.
Immediate Support - $3,650 – $3,670 Zone of recent higher lows; a break below this could see more downside.
Stronger support - $3,600
Major Support Below - $3,500 – $3,550 A deeper correction zone; important in case of more aggressive downward moves.
🔄 Market Structure
Gold is in an uptrend, but there are signs of short-term weakening:
Some indicators are showing overbought conditions.
Price is consolidating just below resistance at ~$3,700 – so momentum is there, but pushing higher might require a catalyst.
On the downside, the structure holds so far — previous swings are supporting, but if support zones (like $3,650) fail, that could shift to a correction mode.
📝 Conclusion
XAU/USD is consolidating within a crucial range, balancing supply and demand forces. The dual-trendline structure signals a potential breakout in the coming sessions. Short-term traders can leverage the 5M CHoCH for early entries, while swing traders should focus on the interplay between the higher timeframe zones and trendlines.
📌 Reminder: Always wait for confirmation before entering trades and manage risk according to your trading plan.
🔔 Follow for updates! Let me know if you have any questions or want to discuss your own analysis. Happy trading! 🚀✨
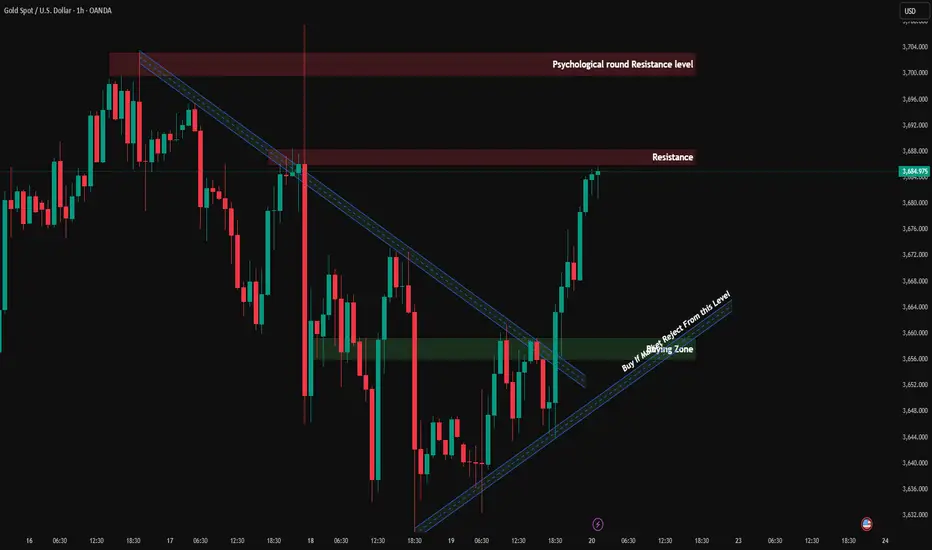
FED countdown | Buy at support, Sell at resistanceXAU/USD – 17/09 | Captain Vincent ⚓
🔎 Captain’s Log – News Context
18/09, 01:00 (US time): FED rate decision + Dot Plot → policy outlook for upcoming meetings
01:30: Powell’s speech – the key market focus
Market consensus: FED almost certain to cut -25bps. However, the -50bps scenario still exists → if it happens, it will be a “big boost” for Gold
During Asia–Europe session, Gold faced early profit-taking, dropping quickly to 3,677 – 3,675, reflecting caution ahead of the FED
⏩ Captain’s Summary
Gold is making a technical pullback before the FED.
Medium-term trend remains bullish, but patience is needed to wait for better Buy entries.
📈 Captain’s Chart – Technical Analysis
Storm Breaker (Resistance / Sell Zone)
Nearby OB: 3,693 – 3,695 (short scalp)
ATH Zone: 3,717 – 3,720 (strong resistance, potential heavy selling)
Golden Harbor (Support / Buy Zone)
Shallow Dock: 3,656 – 3,657 (short-term)
Main Harbor: 3,629 – 3,630 (trendline confluence + old BoS)
Market Structure
Multiple BoS confirm bullish trend
Price retracing to support, likely to bounce back and test 3,693 – 3,717
Break above 3,720 → confirms new ATH
🎯 Captain’s Map – Trade Plan
✅ Buy (priority)
Buy Zone 1
Entry: 3,656 – 3,657
SL: 3,648
TP: 3,675 – 3,693 – 3,717
Buy Zone 2
Entry: 3,629 – 3,630
SL: 3,618
TP: 3,656 – 3,690 – 3,717
⚡ Sell (only at resistance)
Sell Zone OB
Entry: 3,693 – 3,695
SL: 3,705
TP: 3,690 – 3,685 - 3680 - 368x - 36xx
Sell Zone ATH
Entry: 3,717 – 3,720
SL: 3,727
TP: 3,715 – 3,710 – 3,705 - 37xx
⚓ Captain’s Note
“Before the FED countdown, profit-taking waves pulled the Golden ship toward Golden Harbor 🏝️ (3,656 – 3,629) .
Yet the main current still flows north, the bullish trend remains intact.
Storm Breaker 🌊 (3,693 – 3,720) is the big wave, suitable for short Quick Boarding 🚤 scalps.
Sailors must stay patient – the FED wind could be the force to propel Gold to new peaks.”

Gold’s Medium-Term Play: From Momentum Peaks to Reload Zones!!Gold’s rally has been relentless, breaking out of ranges and pressing higher into the 3750s. That strength reflects the macro backdrop where the Fed is walking a fine line: inflation is sticky, growth signals are uneven, and market expectations are already pricing a deeper rate-cut cycle. Yields have softened, the dollar has lost some shine, and capital continues to flow into safe-haven trades. All of this leaves gold well supported in the medium term, though the path forward will not be a straight line.
Target Zone (3827–3840):
The immediate stretch for bulls sits higher around 3827–3840. This is where the rally could stall as momentum traders lock in profits. A clean break and hold above this zone would open the door to new all-time highs, but the market could just as easily treat it as a ceiling before pulling back.
Hidden Bounce Zone (3720–3680):
Sitting just under the current price is a pocket that often acts as a liquidity trap. Markets can bounce sharply from here or slice through with equal speed. For active trades this zone will give the first clue whether momentum is running out of steam.
High-volume Zone (3630):
This level is the backbone of the current structure. Holding above it keeps the broader trend intact. A decisive break below, however, signals that the correction phase has started and the market is hunting for deeper liquidity.
Correction Band (3600–3560):
If gold slips into this range, expect chop and sideways action as weak longs get flushed out and new buyers gradually step in. This zone isn’t where the story ends, but where the market catches its breath.
Medium-Term Reload Zone (3440–3480):
This is the level that matters for swing trades. If a deeper washout comes, this area offers the opportunity to reload positions for the next major leg up. The medium-term backdrop still favors higher prices, with rate cuts, a weaker dollar, and central bank demand forming a strong tailwind.
Macro Picture
Fed Outlook: Committee members are split, but the overall tone is tilting toward easing as growth cracks widen. Powell may sound careful, yet markets are already betting on more cuts ahead.
Dollar and Yields: The dollar index remains pressured while U.S. yields edge lower, creating a supportive base for gold.
Global Flows: Central banks remain steady buyers, and geopolitical tensions continue to underpin safe-haven demand.
In short, gold has room to push into the 3827–3840 zone, but trades should prepare for corrective phases along the way. The hidden bounce pocket and HVZ will decide the near-term path. Should the market wash down into the 3440–3480 reload zone, it should be seen not as weakness, but as a prime setup to load into the medium-term bullish story. Trade safe!

Gold’s Next Bullish Move: Key Buy Zones & Targets to Watch Today🔥 Gold (XAUUSD) Bullish Momentum Alert! 🔥
After a strong rally, Gold bounced back impressively from today’s low at 3633 and is pushing up towards 3673. For intraday traders, the setup is clear: look for dips to jump in on the long side around 3654 - 3646 with exciting upside targets ahead!
📈 Trade Setup – Long on Pullback
Entry: Buy Gold at 3654
Add-on Dip: Add more at 3646
Targets: First target 3670-3675, then aiming for 3685
Invalidation: Cut losses if price falls below 3630
📊 Risk/Reward Snapshot
This is a tight-risk, high-reward setup — perfect for traders who want to keep their stops close while chasing solid gains. As always, manage your risk wisely and size your positions according to your plan.
Do you see the same bullish opportunity?
👍 Drop a like if you’re in!
💬 Share your thoughts or questions below — let’s build a sharp, winning community together!
Your feedback fuels us and keeps everyone trading smarter. Let’s make those pips! 🚀
Happy Trading,
– The InvestPro Team

Gold's U-Turn: A Dive into Fundamentals & Trading StrategyHello, fellow traders! The gold market's moves last night were absolutely wild, not at all what one would expect. After hitting a new all-time high of $3,707.40/oz, gold surprisingly took a U-turn and dropped to $3,681.39/oz. And this happened right after the Fed cut rates by 0.25% as predicted! So, what exactly went down?
Fundamental Analysis: The Fed's Move and Powell's "Cool" Comments
Rate Cut as Expected: The Fed delivered the 0.25% rate cut, its first this year after a pause since late 2024. This action, along with the forecast for two more cuts, met market expectations and initially sent gold soaring.
USD and Bond Yields Drop: Lower interest rates tend to weaken the USD and pull down bond yields, making non-yielding assets like gold more attractive. This was the initial push for gold's new peak.
Powell's "Hawkish" Spin: Everything changed when Fed Chair Jerome Powell stepped up. He gave some surprisingly "hawkish" statements, suggesting the Fed isn't in a hurry to cut rates and that this move was just "risk management."
The Aftermath: This statement threw cold water on market expectations for a faster, more aggressive rate-cutting path. Powell was quite clever; he met market expectations and diffused political pressure (especially from the Trump administration), all while keeping investors on their toes. As a result, bond yields and the USD bounced back, putting strong selling pressure on gold.
Outlook: This shock might just be temporary. Fundamentally, the Fed starting a loosening cycle is a big long-term positive for gold. While gold might face some headwinds in the short term, the underlying bullish trend is still very much intact.
Technical Analysis: Volatility and Key Levels
Gold had some unpredictable swings after the news. After dropping to the $363x zone, it bounced back super fast. This shows that there's still solid buying power at these key support levels.
Key Support: $3624, $3612, $3600, $3584, $3569
Resistance: $3667, $3675, $3686, $3700
Today's Key Level: The $364x range. If gold holds above this level by the end of the European session, we should look for long positions for the US session.
Trading Setups (Remember to Manage Risk Strictly):
Buy Scalp
Zone: $3639 - $3637
SL: $3633
TP: $3642 - $3647 - $3652 - $3657 - $3667
Buy Zone
Zone: $3606 - $3604
SL: $3596
TP: $3614 - $3624 - $3634 - $3644 - $3664
Sell Scalp
Zone: $3674 - $3676
SL: $3680
TP: $3671 - $3665 - $3660 - $3655 - $3645
Sell Zone
Zone: $3686 - $3688
SL: $3696
TP: $3678 - $3668 - $3658 - $3648 - $3628
Note: The market is highly volatile. Be careful with every trade. Will gold continue its rally or see a deeper correction? Share your thoughts below! 👇
#Gold #XAUUSD #Fed #GoldAnalysis #TradingView #InterestRates #FinancialMarkets #TechnicalAnalysis #GoldTrading #Powell #CMEFedWatch
Gold Trading Strategy | September 18-19🎉 Congratulations to our members who followed our trading strategy - today's trades yielded a profit of over 300++ pips!
✅ Based on the 4-hour chart, gold formed a phase top at 3707 and has since pulled back in a consolidation.
The moving averages MA5 and MA10 have crossed downward, while MA20 near 3670 is acting as resistance.
The short- to medium-term trend shows weakening bullish momentum with bears gradually taking control. The Bollinger Bands’ midline is around 3670, and the price has broken below it, now moving near the lower band, indicating weakness. If it cannot quickly reclaim the midline, the trend is likely to remain bearish.
Currently, gold is trading in the 3640–3650 range. If this zone breaks, the price may further test the 3625–3630 support. A break below 3625–3630 would open more downside potential, with the next target around 3600.
🔴 Resistance levels: 3660–3670
🟢 Support levels: 3640–3630
✅ Trading Strategy Reference:
🔰 If the price rebounds to 3660–3670 and faces resistance, consider light short positions with targets at 3630–3625.
🔰 If the price drops to around 3625 and stabilizes, short-term long positions can be considered, targeting 3655–3660.
🔥Trading Reminder: Trading strategies are time-sensitive, and market conditions can change rapidly. Please adjust your trading plan based on real-time market conditions. If you have any questions , feel free to contact me🤝

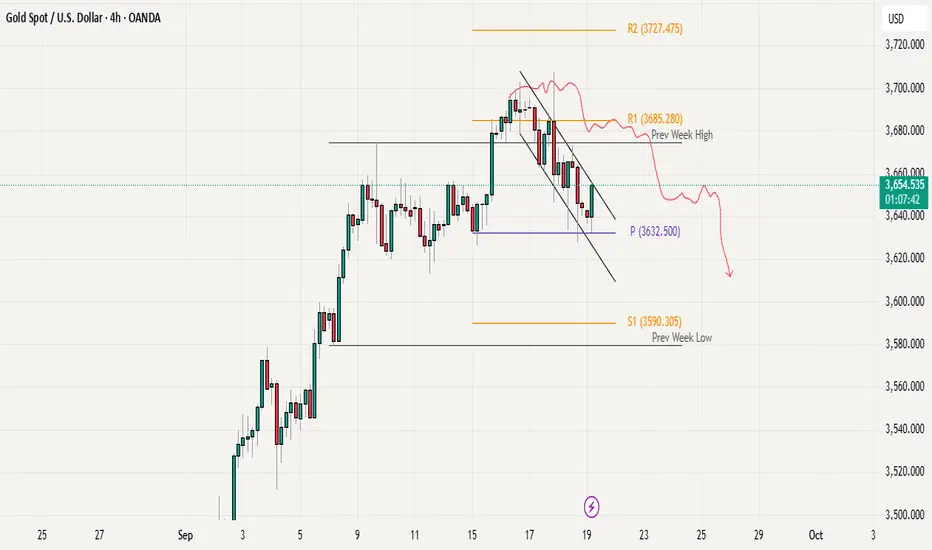
Gold Intraday Analysis: Range Play Until BreakoutGold is currently trading in a range-bound structure after pulling back from the 3700 level. The weekly pivot around 3632 is acting as strong support, while the 3700 zone serves as resistance, forming the upper boundary of the range. Price is showing signs of consolidation between these levels, suggesting a sideways market. For any breakout confirmation, we need to see a clear H1 or H4 candle close above 3700 or below 3632, along with volume or strong price rejection/follow-through. Until then, the price action favors range trading within these key levels.
LiamTrading – XAUUSD H1LiamTrading – XAUUSD H1: Adjustment structure formed, awaiting confirmation below 3685
After the surge to 375x, gold is entering a correction phase in line with the structural pattern. On H1, the price clings to the upper edge of the rising wedge, with RSI cooling off from overbought levels, indicating that supply pressure is starting to dominate. Today's plan focuses on the adjustment structure, prioritising selling upon confirmation signals.
Key price zones (as per the attached chart)
Sell strong resistance 3775–3785: confluence of channel top + 2.618 extension. Look for weakening reactions to initiate short/medium-term sell orders.
Buy zone volume 3726–3720: a thin support area providing momentum for a rebound. Holding this zone could push the price to retest 3750–3775; conversely, losing 3720 may lead to a deeper decline.
Resistance + FVG 3715–3698: as the price drops, this area turns into supply; a failed retest here is an early signal for further decline.
Confirm sell 3688–3685: closing H1 below this zone confirms a short-term downtrend, targeting a lower buy zone.
BuyZone 3652–3646: confluence of channel bottom + old liquidity, expecting a strong bullish reaction if revisited.
Reference trading scenarios (adhering to risk management)
Sell reaction at peak: 3778–3783, SL 3792, TP 3755 → 3738 → 3722.
Sell on confirmation: wait for H1 to close below 3685, enter sell 3684–3682, SL 3696, TP 3673 → 3656 → 3648.
Buy scalp by volume: 3726–3720, SL 3715, TP 3738 → 3750 (only short-term if the larger structure remains corrective).
Buy swing at strong zone: 3652–3646, SL 3639, TP 3673 → 3698 → 3712 → 3740.
Operational notes
Prioritise waiting for rejection/closing signals at the mentioned zones; avoid chasing orders in between.
Order volume should be allocated according to confirmation levels (confirmation zone < breakdown < failed retest).
Avoid excessive leverage; adjust SL according to structure when in profit.
This is a personal perspective, not an investment recommendation. If you want the quickest updates on the next XAUUSD scenarios, follow me and join my community for discussions.

XAUUSD-UPCOMING PROBALBE DIRECTIONAL ANALYSIS1. We can see a retracement in XAUUSD upto retesting area.
2. Also the move take more time as compaired to previous uptrend, means we can't see clear downtrend here.
3. The lines marked at chart are the characters of the trend, means we can see a bit candle which cross the line.
4. The characters are:
1.Minor character-3692.290
2. Major Characters-3547.005, 3581.210,3546.050 & 3478.350.

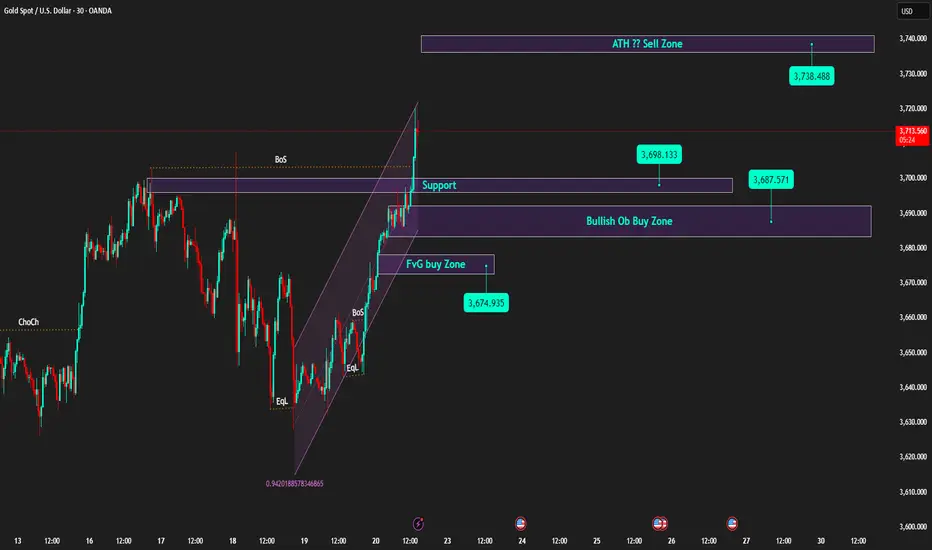
Weekly Candle Closes High | Prioritise Buying on Pullback to Sup🟡 XAU/USD – 22/09 | Captain Vincent ⚓
🔎 Captain’s Log – Quick Overview
Last week, gold closed around 3,685, paving the way for further advancement and a new ATH.
After the FED cut 25bps, Powell's 'brake' remarks slowed the rise, but the larger trend remains bullish.
This morning, prices surged to 3,697.xx, now slightly adjusting around 3,692 – 3,690 → a sensible strategy: wait for a pullback to continue Buying.
⏩ Captain’s Summary: The gold voyage still heads North, Buying remains the main choice, but wait for a pullback to board.
📈 Captain’s Chart – Technical Analysis
Golden Harbor (Support / Buy Zone):
Thin support: ~3,698 (recently broken old range top).
OB Dock: 3,687 – 3,690.
FVG Dock: 3,672 – 3,676 (liquidity check on deep pullback).
Storm Breaker (Resistance / Sell Zone):
3,714 – 3,720 (supply cluster / old ATH – likely to react).
Price Structure:
Continuous BoS series, price breaks short-term up channel and creates higher highs → bullish remains the main trend.
🎯 Captain’s Map – Trading Plan (before US session)
✅ Buy (trend priority)
Buy Zone 1
Entry: 3,698 – 3,701
SL: 3,688
TP: 3,706 – 3,714 – 3,720+
Buy Zone 2 (OB)
Entry: 3,687 – 3,690
SL: 3,680
TP: 3,698 – 3,706 – 3,714 – 3,72x
Buy Zone 3 (FVG)
Entry: 3,672 – 3,676
SL: 3,664
TP: 3,687 – 3,706 – 3,714
⚡ Sell (only scalp when overbought)
Sell Zone (ATH test)
Entry: 3,740 – 3,738
SL: 3,750
TP: 3,730 – 3,690 – 3,695
Captain’s Note ⚓
“The new week kicks off with a high-closing candle, the gold vessel continues its bullish course. Golden Harbor 🏝️ (3,690 – 3,672) is a safe anchorage for the crew to watch for Buys. Storm Breaker 🌊 (3,714 – 3,720) is the wave crest where winds may rise, suitable for Quick Boarding 🚤 short scalps. Before the US session, the seas might get choppy – hold the helm tight and manage volume wisely.”
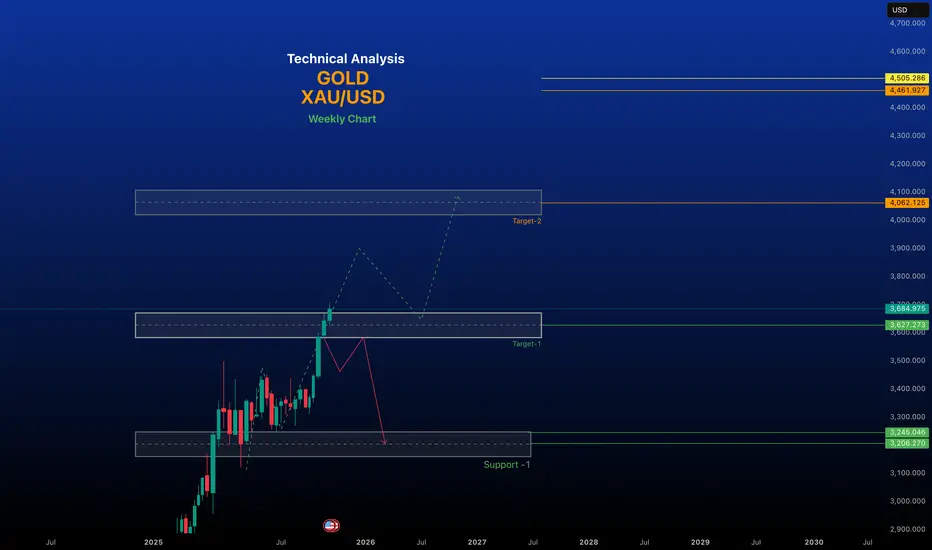
Gold Market Analysis: September 20, 2025Gold (XAU/USD) continues its remarkable bullish run in 2025, driven by persistent geopolitical tensions, central bank buying, a weakening US dollar, and expectations of further Federal Reserve rate cuts. As of today, the spot price stands at approximately $3,685 per ounce, marking a 1.06% increase from the previous day and a staggering 40.47% year-over-year gain. This follows a 26% rise in the first half of the year and nearly 41% year-to-date, with the metal recently touching an all-time high near $3,707 earlier this month. The market remains in a structural uptrend, though short-term volatility—exacerbated by the recent FOMC meeting—has led to some profit-taking and consolidation.
Technical Analysis
Gold's chart on the daily and H1 timeframes shows a bullish bias, with the price trading above key moving averages (50-day MA at $3,520 and 200-day MA at $3,200). The recent pullback from $3,707 appears corrective, testing demand zones around $3,638-$3,644 where buyers stepped in aggressively.Key Support Levels:Immediate: $3,644–$3,638 (recent demand zone; strong buying interest here).
Long term Support and resistance
Support : $3,525–$3,580
Key Resistance Levels: $3,900 - $4,000
Trend Bullish
~~ Disclaimer ~~
This analysis is based on recent technical data and market sentiment from web sources. It is for informational \ educational purposes only and not financial advice. Trading involves high risks, and past performance does not guarantee future results. Always conduct your own research or consult a SEBI-registered advisor before trading.
# Boost and comment will be highly appreciated.
Gold Consolidating Near All-Time HighLast week Gold made a new all-time high around the 3707 level, and we have seen minor pullback after this high, leading to a pullback towards the 3620 -30 area. From there, the price bounced back strongly and is now trading close to the 3700 mark again. Currently, the market seems to be consolidating in a range between 3620 and 3700-07. The overall trend still looks bullish, but for the next clear direction, we need a strong higher time frame close either above 3700 for further upside or below 3600 for possible deeper correction.
Immediate resistance 3700-07
Weekly R1 3719
Weekly R2 3754
Pivot 3672 (As immediate support)
Weekly S1 3628

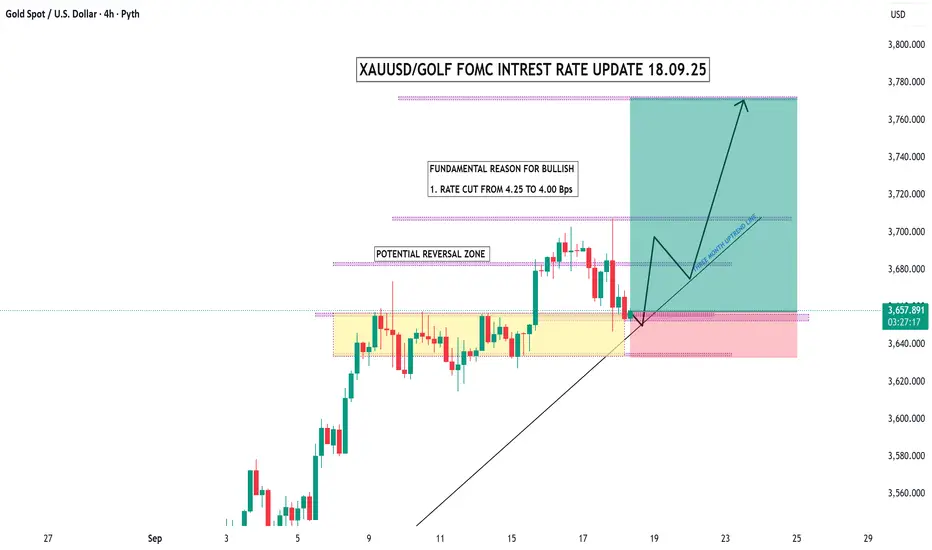
XAUUSD / Gold FOMC Interest Rate Update – 18.09.25Fundamental Reason for Bullish:
The Federal Reserve cut rates from 4.25% → 4.00%.
This supports gold’s bullish momentum since lower rates reduce the opportunity cost of holding gold.
Technical Structure:
Potential Reversal Zone: Highlighted in yellow. Price is currently testing this area around 3645–3655.
A bounce from this zone aligns with the 3-month uptrend line (black trendline).
If price respects this support, bullish continuation is expected.
Bullish Projection Path:
First, a rebound from the reversal zone.
Then, a push towards 3700–3720 with a possible retest.
Final Target Price Zone: ~3750–3780.
Risk Area (Stop Loss Zone):
If price breaks below the reversal zone and trendline (~3640–3635), bullish outlook weakens and downside risk opens.
🎯 Summary
Bias: Bullish (Fundamental + Technical confluence).
Reason: Rate cut + uptrend line support.
Targets: 3700 → 3750 → 3780.
Invalidation: Break below 3640.
XAUUSD Gold can move big as indicated in chart , we can plan accordingly
I think this will react same as I have planned
This is the best opportunity
Disclaimer; I will not be responsible for any kind of loss or profit
This idea is purely for observation purpose only

Gold XAUUSD feeling exhausted start sell on rise Gold sell on rise until recent high high 3705 not break and sustain above, profit booking will come , if break 3615 then short term downtrend will start , 3560, 3515 ,3480 downside target
Avoid any buy trade at current price risk of trapping on buy side at top

Gold Breaking Limits – Trend Speaks for ItselfGold Breaking Limits – Trend Speaks for Itself
Gold Market Outlook
Gold continues to demonstrate a well-structured bullish cycle, characterized by steady momentum and clean trend development. The market has transitioned from a prolonged consolidation phase into a sustained directional move, where each breakout is validated by controlled retracements. This reflects strong participation and confidence from larger players.
The sequence of market shifts and break-of-structure signals highlight how short-term pullbacks are consistently absorbed, turning into fuel for further expansion. Price action is orderly, with no signs of erratic volatility, showing that buyers remain in control and liquidity is being managed efficiently.
Overall, gold is moving in line with the broader macro sentiment. The rhythm of accumulation, expansion, and continuation suggests that the current cycle has not yet exhausted its potential. While interim pauses are expected, the structural integrity of the trend continues to favor upside development over the medium term.

XAUUSD/GOLD 30 MIN BUY PROJECTION 23.09.25XAUUSD/Gold 30-min buy projection chart you shared for 23.09.25. Here’s the breakdown of what the chart indicates:
🔎 Chart Analysis
Trend: Price is moving within a bullish (upward) channel, shown by the blue trend lines.
Entry Zone: Around 3749.687 (marked as ENTRY, just above Support 1).
Stop Loss (SL): Around 3743.131, below the 30-min FVG (Fair Value Gap).
Supports:
Support 1: ~3749 zone
Support 2: ~3755–3757 zone
Take Profits:
TP1: Around 3765–3767 level (mid-channel target).
TP2 (ATH – All-Time High for this projection): Around 3783–3785.
Projection Path:
Price expected to bounce near entry zone → rise towards TP1 → possible pullback → continue bullish momentum towards TP2 ATH following the 30-min uptrend line.
⚡ Trading Idea (based on chart)
Buy Entry: ~3749
Stoploss: ~3743
TP1: ~3765
TP2: ~3783
This setup offers a risk-reward ratio > 1:3, which is strong for an intraday buy trade.
👉 Do you want me to calculate the exact risk-to-reward ratio (RRR) for this setup so you can evaluate position sizing?

XAUUSD – Strategic Selling Zone and Detailed Trading ScenarioTechnical Analysis
Gold (XAUUSD) is experiencing a strong upward trend and has now reached the Fibonacci extension zone of 1.618 – 2.618, a region often associated with profit-taking and short-term distribution.
Sell Zone Fibo 2.618 (3,730–3,735): The first potential supply area, if a bearish confirmation candle appears on H1/H4, a corrective phase is likely to commence.
Sell Zone Swing (3,745–3,750): A strong supply zone confluencing with multiple Fibonacci extensions, posing a higher reversal risk.
Short-term Buy Zone (3,690–3,700): An intermediate support area after breaking the previous peak, suitable for short-term buy orders if the price retests and confirms.
Buy Swing (3,645–3,650): The main support zone, confluencing with EMA200 H1 and an old trendline, considered a 'safe buying point' if a deep correction occurs.
The RSI (14) is currently at 77, indicating that the price has entered the overbought territory. Historically, whenever the RSI exceeds 75, a significant correction follows. This serves as a warning signal for traders to consider gradually taking profits on short-term Buy positions and preparing for Sell or Buy scenarios at lower price levels.
Trading Scenario
Scenario 1 – Sell at Supply Zone:
Entry: 3,732–3,735 (Fibo 2.618) or extend to 3,745–3,750 (Sell Zone Swing)
SL: above 3,740
TP1: 3,707
TP2: 3,690–3,700 (Buy Zone)
TP3: 3,661
TP4: 3,645
Scenario 2 – Short-term Buy (regression scalping):
Entry: 3,670–3,700 (after H1 confirmation candle)
SL: below 3,690
TP1: 3,718
TP2: 3,730
Scenario 3 – Long-term Buy Swing:
Entry: 3,645–3,648 (EMA200 + main support zone)
SL: below 3,640
TP1: 3,690
TP2: 3,707
TP3: 3,730
Price Levels to Watch
3,730–3,750: The strongest current supply zone, suitable for a Sell scenario based on Fibonacci extensions.
3,690–3,700: Short-term Buy Zone, a crucial retest area to confirm the trend.
3,661: An intermediate level, if breached, could lead to a decline towards EMA200.
3,645: Potential Buy Swing, the main support of the upward structure.
Overall Assessment
The main trend on H1 remains upward; however, the current price level has entered the overbought zone, indicating a likely correction towards support before continuing the trend.
The most suitable strategy at this time: Monitor for short-term Sell opportunities at the supply zone – take profits at the support zone, then wait for Buy Swing at lower levels to follow the main trend.

XAUUSD – The Decisive Zone and Trading ScenariosTechnical Analysis
Gold prices on the H4 chart are in a recovery phase after retesting the support at 3,661–3,662. The latest candle has rebounded strongly to the 3,684 zone, yet the structure still indicates a clear tug-of-war.
The upward trendline was breached in the previous decline, and currently, the price is retracing to test this area again. This is a crucial point to determine whether the short-term uptrend will continue.
The Fair Value Gap (FVG) formed around the 3,613–3,626 zone, along with the Fibonacci extension, becomes a point of interest for deeper pullbacks.
The Volume Profile indicates the main Point of Control (POC) lies lower, around 3,551, a potential target for gold to revisit if selling pressure increases.
The RSI (14) is at ~59, leaning towards the buyers but hasn't crossed into the overbought territory → the current momentum is more of a recovery rather than a sustainable uptrend.
Trading Scenarios
Scenario 1 – Buy following the short-term trend:
Entry: wait for a retest at 3,673–3,662
SL: below 3,655
TP1: 3,690–3,700
TP2: 3,708–3,715 (2.0–2.618 Fib extension)
Scenario 2 – Short sell after confirmed failure:
If the price fails to hold above 3,661 and there is a reversal signal on H4, consider selling.
Entry: 3,661–3,650 (after confirmation candle)
SL: above 3,673
TP1: 3,626–3,613 (FVG + support)
TP2: 3,579
TP3: 3,551 (POC Volume Profile)
Key Price Levels to Watch
3,708–3,715: extended resistance zone, Fibonacci confluence, important target for buyers.
3,661–3,662: short-term support, the boundary to determine the next trend.
3,613–3,626: FVG + intermediate support, a zone prone to reactions.
3,551: volume POC, a deeper target if the market breaks all support.
I will apply the long-term trading scenario in the new week, give me a follow for motivation to write more!
