Gold XAUUSD Trading Strategy July 29, 2025Gold XAUUSD Trading Strategy July 29, 2025:
Yesterday's trading session, gold prices continued to fall as expected. After approaching the resistance area of 3300, gold prices are recovering.
Basic news: The market is almost unlikely to see the possibility of the FED cutting interest rates in July and about 40% chance that the FED will continue to keep interest rates unchanged in September, up from about 10% the previous month. US non-farm payrolls are likely to continue to increase rapidly, showing a rapid recovery in the labor market.
Technical analysis: Gold prices continue to stick with the MA lines, the downtrend channel has not been broken. Currently, the 3280 - 3285 area may be a support area for gold prices to recover after the previous sharp decline. We will mainly trade according to the short-term trend and wait for a long-term buying point.
Important price zones today: 3330 - 3335, 3350 - 3355 and 3280 - 3285.
Today's trading trend: SELL.
Recommended orders:
Plan 1: SELL XAUUSD zone 3333 - 3335
SL 3338
TP 3330 - 3320 - 3300 - 3280.
Plan 2: SELL XAUUSD zone 3353 - 3355
SL 3358
TP 3350 - 3340 - 3320 - 3300.
Plan 3: BUY XAUUSD zone 3283 - 3285
SL 3280
TP 3288 - 3300 - 3320 - 3340 - Open.
Wish you a safe, successful and profitable trading day.💗💗💗💗💗
CFDGOLD trade ideas

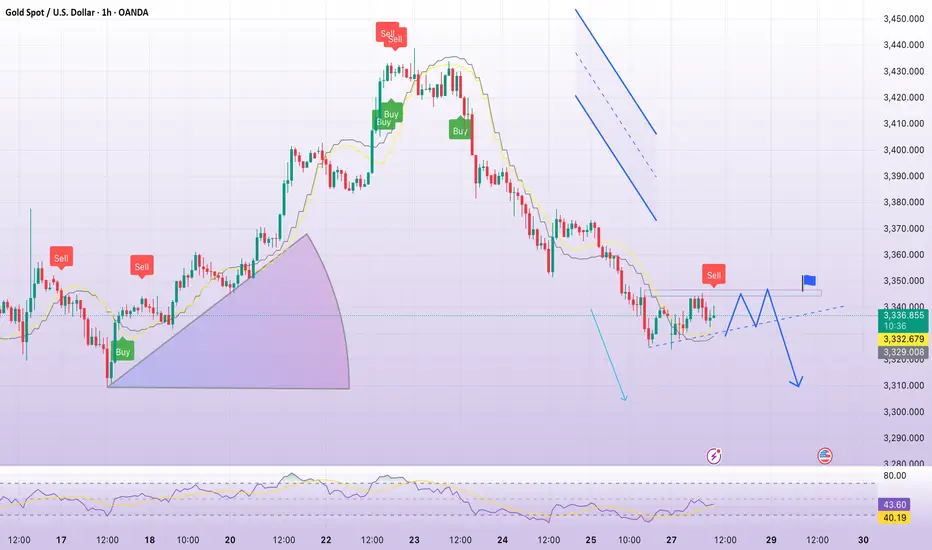
Elliott Wave Analysis – XAUUSD – July 28, 2025📊
________________________________________
🔍 Momentum Analysis:
• D1 Timeframe: Momentum has entered the oversold zone. This strongly suggests a potential bullish reversal today, which could lead to a rally or sideways movement lasting around 4–5 days.
• H4 Timeframe: Momentum is reversing upward. This indicates a likely bullish or sideways move in the short term, at least until momentum reaches the overbought zone (estimated within the next 2 H4 candles).
• H1 Timeframe: Momentum is currently overbought, so we may first see a pullback or sideways movement until a clearer reversal signal appears.
________________________________________
🌀 Wave Structure Analysis:
• On the H4 chart, as noted in previous plans, the assumption that price is forming a contracting triangle (abcde) is still valid. Price is currently in the final leg (wave e) of this triangle.
• On the H1 chart, we can observe a channel structure, within which an abc corrective pattern is unfolding.
• The lower boundary of the triangle (marked by the green trendline) combined with support zones will be critical areas to monitor for the end of wave e.
🔺 Note: Wave e does not necessarily end precisely at the triangle boundary – it can slightly overshoot. Hence, we’ll rely on smaller wave structures to identify potential reversal zones.
________________________________________
🎯 Key Price Zones to Watch:
• Target 1: 3329
• Target 2: 3309
• Target 3: 3290
________________________________________
🔎 Lower Timeframe Structure (M10):
From the current price action (as shown in the chart), we can see a leading diagonal triangle structure forming. This is a pattern commonly seen in wave 1. If this pattern is confirmed, a sharp and steep decline toward the 3329 zone is likely.
________________________________________
⚖️ Combining Momentum & Wave Structure:
• D1: Signals a potential reversal → favors Buy setups.
• H4: Momentum is rising, but price hasn’t confirmed a new bullish trend → need to stay alert and tighten Stop Loss.
• H1: Overbought + possible leading diagonal → Expecting a pullback for wave 2 toward 3329 → this would be the optimal Buy zone.
________________________________________
🧭 Trade Plan:
• For experienced traders:
→ Wait for price to reach key levels and watch for reversal signals before entering.
• For beginners:
→ Use the following Limit Buy setup:
✅ Setup 1:
• Buy zone: 3330 – 3328
• Stop Loss: 3320
• TP1: 3351
• TP2: 3370
• TP3: 3385
✅ Setup 2:
• Buy zone: 3310 – 3308
• Stop Loss: 3300
• TP1: 3328
• TP2: 3351
• TP3: 3370

GOLD: Is This Just the Calm Before a Bigger Move? – GOLD: Is This Just the Calm Before a Bigger Move?
Gold has dropped nearly $50 in the last 4 sessions — showing strong bearish momentum, but is the downside exhausted? Or is this just a pause before continuation?
🔍 Macro Drivers:
Recent US–EU defense and trade agreements have weighed on gold's safe-haven appeal.
Strong US economic data has pushed USD and equities higher, redirecting flows out of precious metals.
Market sentiment is leaning short-term risk-on, which is bearish for gold – but key technical levels are approaching.
📊 Technical Context – H12 Structure:
Price broke below 3,342 key support, retested it and rejected — validating short-term supply zone.
Price is now consolidating between Sell-side liquidity (3,301–3,292) and deeper FVG/OBS zone around 3,270.
Above, multiple sell zones align at Fib 0.5–0.618 retracement with order blocks and fair value gaps.
🔧 Trade Scenarios (Plan for Reaction – Not Prediction):
🟢 BUY SCALP – Quick bounce off demand zone
Entry: 3,292 – 3,290
SL: 3,285
TPs: 3,296 → 3,300 → 3,305 → 3,310 → 3,315 → 3,320 → 3,325 → 3,330
📍Low-risk intraday bounce play from liquidity pocket
🟢 BUY SWING – Deeper test of FVG/OBS zone
Entry: 3,272 – 3,270
SL: 3,265
TPs: 3,276 → 3,280 → 3,284 → 3,288 → 3,292 → 3,294 → 3,300 → open
📍Higher R:R setup if price sweeps final liquidity zone
🔴 SELL SCALP – Rejection from short-term resistance
Entry: 3,340 – 3,342
SL: 3,346
TPs: 3,335 → 3,330 → 3,325 → 3,320 → 3,310
📍Reaction-based trade if price fails to reclaim the zone
🔴 SELL SWING – Deeper pullback into macro zone
Entry: 3,370 – 3,372
SL: 3,376
TPs: 3,365 → 3,360 → 3,355 → 3,350 → 3,345 → 3,340 → 3,330 → 3,320
📍FVG + CP zone overlap with strong OB; ideal for patient sellers
⚠️ Risk Notes:
Watch for false breakouts/liquidity traps near session opens.
Wait for price confirmation; reaction over prediction.
Maintain disciplined risk management – this is a volatile area.
🧭 I’ll be tracking price behavior at these zones closely.
If this approach to mapping price action resonates with you —
Feel free to stay connected or share your bias in the comments.

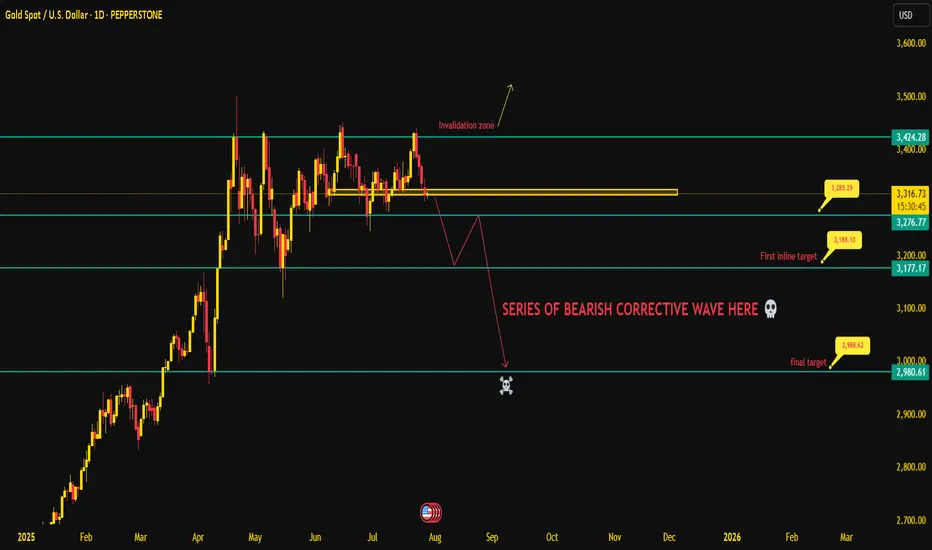
Gold Outlook One Wrong Close Away from a FlushGold's been quietly coiling for weeks inside this suffocating structure between 3340 and 3270. Every single rally got sold into. No follow-through. No real demand. Just mechanical rebounds off liquidity zones textbook signs of exhaustion. Today, price is balancing right on the edge of the final support shelf: the 3285– 3310 structure base. If that shelf cracks on a daily close… lights out.
This isn’t a breakdown you chase this is one you position into. Because what follows is not just a flush it’s a multi-leg corrective sequence that the market’s been setting up since early May. The first wave draws down to 3190. That’s the soft zone. The real demand void begins after that, and if momentum accelerates price will seek that 3000–2980 final liquidity pocket. That’s the zone where the algo stops checking for bids and starts breaking them.
And make no mistake It’s a price action recalibration of a market that ran way ahead of itself. Monthly candles show rejection after rejection from HVZ tops. Weekly structures are screaming divergence. Liquidity’s been drying up since June. This isn’t fear it’s precision distribution.
Now, flip side? Yes the invalidation zone is brutally clear. Any daily breakout + close above 3430 is the line in the sand. That’s when the bearish thesis goes straight to the bin. Until then, every bounce is a liquidation opportunity.
The script is ready. The waves are drawn. The risk is compressed. All it needs is one close just one below this zone. And then, the sequence begins.
This ain’t a dip. It’s a descent. Stay sharp. 🩸
Gold dives toward 3,320 as Fed decision loomsHello everyone, what are your thoughts on gold prices?
Gold's decline is accelerating, dragging the precious metal down toward the 3,320 USD mark. A stronger U.S. dollar and further developments on the trade front following the U.S.-EU agreement have significantly impacted demand for safe-haven assets.
From a technical perspective, the break below the rising price channel could mark the beginning of a deeper correction. Oscillators on the chart have just started turning negative, suggesting that the path of least resistance for gold is now downward.
Looking ahead, Wednesday’s key FOMC decision—along with the accompanying policy statement and Powell’s press conference—will be closely scrutinized for clues on the Fed’s interest rate cut roadmap.
Additionally, investors will face several important U.S. macroeconomic data releases this week, which will play a vital role in shaping the USD’s trajectory and provide new momentum for XAUUSD.
What do you think about the precious metal? Share your thoughts below!

Gold plunges as Fed stays firm, war fails to boost XAUUSD is showing clear signs of weakness after peaking at 3,375 and consistently forming lower highs. On the H2 chart, the price action confirms a completed distribution pattern and is now consolidating ahead of a potential breakdown below 3,283.
News highlights:
The US ADP and GDP reports exceeded expectations, strengthening the case for the Fed to keep interest rates higher for longer – putting significant pressure on gold.
Although the JOLTS job openings dipped slightly, the figure remains above 7 million, offering little support for gold recovery.
Conflict news between Thailand and Cambodia might offer some support, but the impact is limited due to the small regional scale.
Trading strategy: Prioritize SELL if price pulls back to 3,339 and fails to hold. The next target is around 3,252.
The main trend remains bearish unless XAUUSD breaks above 3,360.
Do you think XAUUSD will break the bottom this week?

XAU/USDThis XAU/USD trade setup is a buy trade, indicating an expectation that gold prices will rise. The entry price is 3318, the stop-loss is set at 3307, and the exit price is 3346. This setup shows a bullish outlook on gold, with the trader aiming to capture an upward move of 28 points from entry to exit. The stop-loss at 3307 limits the downside risk to 11 points, providing a reasonable risk-to-reward ratio of more than 1:2.
Buying at 3318 suggests that the trader expects gold to gain strength due to factors such as a weaker US dollar, lower Treasury yields, or increased demand for gold as a safe-haven asset. The target of 3346 is set at a key resistance level, where the trader expects to book profits.
Proper risk management is essential because gold can be volatile, especially during major economic news releases or geopolitical events. The trade should be monitored closely, ensuring that market conditions support a bullish move.
Overall, this setup provides a structured plan to enter long at 3318, place a tight stop-loss at 3307, and exit at 3346, aiming for disciplined and profitable trading in XAU/USD.

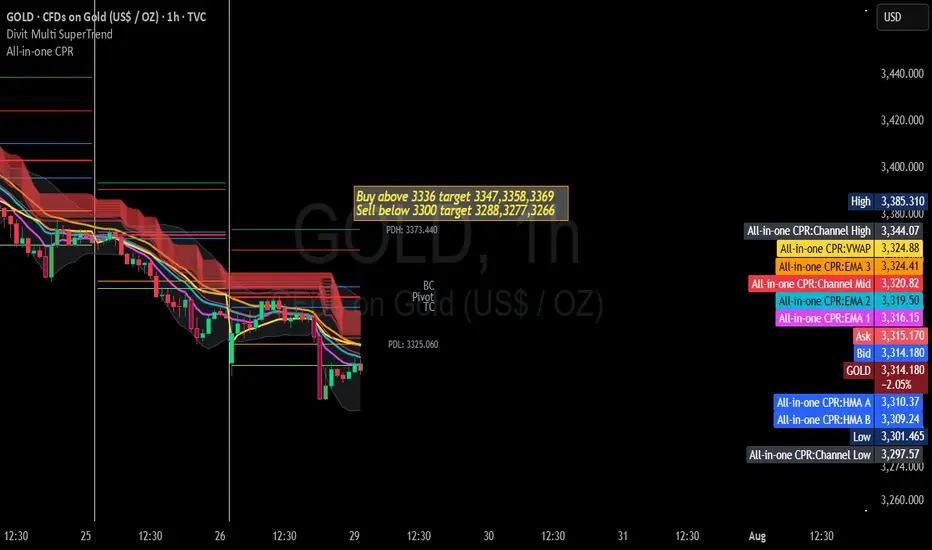
Gold Trading Strategy for 29th July 2025📢 GOLD Intraday Trade Setup📢
💰 Instrument: GOLD (XAU/USD)
📊 Strategy Type: Price Action Breakout (Candle Confirmation)
🕒 Recommended Timeframes: 15-Min, 30-Min or 1 hour Charts
✅ Buy Setup (Bullish Breakout Strategy)
🟢 Buy Above: $3336
📌 Entry Rule:
Wait for a strong bullish candle to close above $3336.
📈 Enter above the high of that closing candle for confirmation.
🎯 Targets:
🔹 Target 1: $3347
🔹 Target 2: $3358
🔹 Target 3: $3369
🔐 Stop-Loss: Just below the breakout candle's low or below $3330 support area.
🔻 Sell Setup (Bearish Breakdown Strategy)
🔴 Sell Below: $3300
📌 Entry Rule:
Wait for a strong bearish candle to close below $3300.
📉 Enter below the low of that closing candle for confirmation.
🎯 Targets:
🔸 Target 1: $3288
🔸 Target 2: $3277
🔸 Target 3: $3266
🔐 Stop-Loss: Just above the breakdown candle's high or above $3307 resistance.
🧠 Pro Tips for Today:
Use Volume and RSI to confirm breakout strength.
Avoid entries during high impact news events (check economic calendar).
Maintain risk-reward ratio of at least 1:2.
🧰 Tools to Use:
📍 Support/Resistance Levels
📉 Trendlines
🔁 Moving Averages (EMA 20/50)
📊 Volume Profile
⚠️ Disclaimer:
This content is for educational purposes only. Trading in financial markets involves substantial risk and is not suitable for all investors. Please conduct your own research or consult a certified financial advisor before making any trading decisions. We are not liable for any financial loss or gain based on this information.
Gold Trading Strategy | July 28-29✅ During the U.S. session, gold broke below the key support level of 3320, extending the bearish trend. It then found initial support around 3301, where prices stabilized in the short term.
✅ From a daily chart perspective, gold posted a solid bearish candle today, indicating a confirmed break below the ascending trendline that had held since June 30. If the price continues to stay below 3300, the 3250 zone will likely become the next key downside target for this correction.
✅ If gold fails to reclaim the 3325 level, the short-term outlook will remain bearish. Structurally, the current move is considered a corrective rebound within a broader downtrend, and overall pressure to the downside is expected to persist.
✅ For short-term trading, the strategy remains focused on selling into rebounds. Look for short opportunities during the Asian and European sessions if the price rebounds into resistance zones. If gold breaks below the 3300 psychological level, pay close attention to support in the 3275–3285 region.
🔴 Resistance levels: 3315 – 3325 – 3338 – 3347
🟢 Support levels: 3305 – 3300 – 3285 – 3275
✅ Trading Strategy Reference:
🔰If the price rebounds to the 3338–3350 zone, consider building short positions in batches. Light entry around 3338, add main positions in the 3347–3350 range.
⛔️Set a stop-loss above 3358–3365, in line with the Bollinger mid-band and previous highs.
🎯First target: 3310; If broken, extend the target to the 3285–3275 support zone.
✅ Overall, gold remains in a bearish trend. In the short term, we recommend sticking with a trend-following strategy: selling on rallies and following through on breakdowns. Key levels to watch include resistance in the 3325–3347 zone and support between 3300–3285. Unless there is a significant shift in market sentiment, gold may continue testing lower support levels.

Gold holding sell from 3410 continuesly, downside target 3285-80Gold sell on rise active from 3410 , sell on rise until 3355 not break and sustain , downside target 3285-3280 then we will see 3245-3240 , if break 3220 then more fall will come to 3190, 3160,3130

GOLD LongWe can clearly see the gold is making an ascending triangle in an uptrend. This is the daily timeframe. We can see a small dip of around 3200 and later on. Once the breakout above the horizontal level. It can go up to 3800 to 4000.

XAU/USD 1H – Range Consolidation Below Ichimoku Cloud. Chart Review & Technical Insight
1. Ichimoku Cloud & Overall Structure
Price is below the Ichimoku Cloud, with the cloud ahead sloping downward—indicative of bearish short‑term momentum and resistance overhead as long as the cloud holds above price.
The Kijun-sen (blue) line is above the Tenkan-sen (red), reinforcing the bearish bias on this timeframe.
2. Price Action & Key Zones
A support zone around 3,327–3,330 USD/oz is visible, underpinned by multiple rejection taps and price consolidation (“$$$” zone). A clean break below could open the path toward the 3,320’s or lower imbalance region.
On the upside, resistance lies near 3,339–3,340, backed by the cloud’s lower boundary and the Kijun-sen level.
The highlighted green rectangle appears to signal a potential bullish breakout target zone toward 3,365–3,392, contingent on recovery above the cloud.
3. Momentum & Trade Considerations
Momentum is weak, with price moving sideways inside a low‑volatility rectangle on diminishing volume and few directional impulses.
Possible ABC corrective structure is forming as marked, suggesting price may oscillate sideways or continue correcting within established bounds.
A bullish scenario would require clearing the Ichimoku Cloud and resistance at 3,340–3,360 USD.
Conversely, a bearish breakdown below ~3,327 could confirm continuation deeper into the 3,320s or toward the next significant demand zone near 3,300 USD.
✅ Summary
Bias: Slightly bearish to neutral until price can clear the Ichimoku Cloud.
Key Levels to Watch:
Support: 3,327–3,330 (immediate), then 3,320–3,300.
Resistance: 3,339–3,365, cloud top near 3,365, further target zone 3,392.
Scenarios:
Bullish breakout: Close above cloud → potential rally toward 3,365–3,392.
Bearish breakdown: Close below 3,327 → deeper correction toward 3,320 and lower imbalance areas.

Gold price accumulation, price reduction rangePlan XAU day: 28 July 2025
Related Information:!!!
Gold prices (XAU/USD) have stalled their intraday rebound from a more than one-week low and are trading around the $3,335 level during the early European session on Monday, marking a decline for the third consecutive day. Renewed strength in the US Dollar (USD) continues to weigh on the precious metal, serving as a primary headwind. Additionally, a broadly positive market sentiment—supported by recent trade-related optimism—is further limiting the upside potential for the safe-haven asset.
That said, USD bulls may exercise caution and refrain from initiating aggressive positions ahead of further clarity on the Federal Reserve’s (Fed) monetary policy outlook. As such, market participants are expected to closely monitor the outcome of the upcoming two-day FOMC meeting concluding on Wednesday, which is likely to influence USD dynamics and provide fresh directional impetus for non-yielding gold. Moreover, this week’s key US macroeconomic data releases will be instrumental in determining the next leg of movement for the XAU/USD pair
personal opinion:!!!
Very important news this week, gold price is forecast to continue to fall sharply below 3300 with the almost certain result that the FED will continue to keep the current interest rate unchanged.
Important price zone to consider : !!!
resistance zone point: 3340, 3358 zone
Sustainable trading to beat the market
Gold (XAU/USD) Daily Trading Plan - 28th July 2025🔺 Technical Analysis
Gold started the Asian trading week with a small pullback, testing the 0.382 Fibonacci Retracement level. However, it quickly bounced back strongly to last week's closing price, which was around 3339. This movement confirms the price action from a technical point of view.
Importantly, gold has broken above a minor resistance on the M15 timeframe. This cancels out the previous bearish pattern and has formed a strong H1 candle. This indicates that a potential corrective uptrend might begin now.
On the Daily timeframe, the initial dip in the session retested the bullish trendline and bounced back within the boundaries of the flag pattern. It is likely that this week, the price will continue moving towards the end of this pattern, which will give a clearer confirmation of the medium-term trend.
🔺 Key Macroeconomic News
This week is expected to be quite volatile due to several important economic announcements, especially as it's the end of one month and the start of a new one. Traders should pay close attention to two key events:
FOMC Interest Rate Decision: This is always a major focus for the market and has a big impact on safe-haven assets like gold.
Non-Farm Payroll (NFP) Report: This is crucial US labour market data, and it can cause significant movements in both the US Dollar (USD) and gold.
Therefore, be ready for possible market shocks and make sure to manage your risks carefully.
📈 Trading Strategy & Considerations
Considering the current technical setup and the upcoming macroeconomic events, here are some points to keep in mind:
Possible Corrective Uptrend: The cancelled bearish pattern on M15 and the strong H1 candle suggest a short-term bullish bias for a corrective move.
Daily Flag Pattern: Keep an eye on how the price behaves as it approaches the end of the flag pattern on the Daily timeframe. This will help confirm the medium-term trend.
High Volatility Expected: Be extremely cautious around the FOMC and NFP announcements. These events can lead to large and quick price changes.
Risk Management: It's very important to manage your risks strictly. Consider reducing your position sizes or using wider stop-losses during high-impact news events.
Disclaimer: This analysis is only for information purposes and should not be considered financial advice. Trading involves significant risk, and you should only trade with money you can afford to lose.

GOLD BUY TRADE SETUP 📌 GOLD (XAU/USD) 15-Min Analysis – Range Breakout Setup
🔹 Current Structure: Gold is currently trading inside a tight range between 3348.830 (resistance) and 3322.895 (support) on the 15-minute timeframe.
This consolidation shows price compression after a previous downtrend, signaling a potential breakout move.
---
⚡ Key Level to Watch: 3348.830
📍 If price breaks above 3348.830 with a strong displacement candle (clear body, volume-backed), it confirms bullish breakout intentions.
📌 Plan After Breakout:
✅ Wait for retracement back to the breakout zone (3348.830)
✅ Look for bullish confirmation (bullish candle pattern or SMC-type entry)
✅ Enter Long Position
🎯 Target 1: 3360
🎯 Target 2: 3375+
🛑 SL: Below Retest Zone / Structure Low
---
🧠 Why This Works:
Break of structure after consolidation signals momentum shift
Liquidity is likely resting above the range
FVG + OB + Breakout confluence gives a high probability
---
⚠️ Invalidation:
If price fails to break 3348.830 or does a fakeout, then avoid any longs. Wait for a new setup or breakdown below 3322.

XAUUSD – final bounce before the drop?Gold is trapped in a sideways box, and the bounce from the $3,330 zone looks like nothing more than a technical reaction – with no strong buying momentum. The dense cluster of FVGs signals that selling pressure hasn’t been fully absorbed yet.
Fresh data from the U.S. strengthens the bearish case: jobless claims have hit a 3-month low, indicating a resilient labor market. This paves the way for the Fed to keep rates steady at 4.25–4.50%. Meanwhile, Trump’s tariff policies are stoking inflation risks.
If gold fails to break above $3,437 in the next few sessions, sellers may step in aggressively. In that case, the next target could be $3,280.

Latest Gold Price Update TodayIn the most recent trading session, global gold prices dropped over 31 USD per ounce, closing at 3,337 USD. This sharp decline follows a three-day rally and reflects profit-taking by investors and a shift in capital flow.
Newly released economic indicators show that the U.S. labor market remains strong, with jobless claims falling for the sixth consecutive week — the longest streak since 2022. This helped the U.S. dollar rebound slightly, putting pressure on gold, a non-yielding asset.
At the same time, investor sentiment has tilted toward riskier assets like equities, as trade talks between the U.S., EU, and Japan show positive progress. Stock markets in the U.S. and Europe surged, drawing capital away from gold.
Although expectations remain for a potential Fed rate cut in September, gold faces short-term headwinds. The 3,300 USD zone is now a key level to watch. Traders should look for reversal signals and volume confirmation before considering long entries.
Personal view: USD strength, rising stock markets, and profit-taking are creating a short-term correction for gold. However, in the longer term, there is still upside potential if the Fed signals a policy shift in the coming months.
And you — what’s your take on gold prices today?

XAU/USDTrading XAU/USD, which represents gold priced in US dollars, requires a well-planned strategy that includes a defined entry price, stop-loss, and exit price. In this trade setup, the entry price is set at 3332, the stop-loss is placed at 3311, and the exit price or target is 3376. This setup suggests a bullish outlook on gold, meaning the trader expects the price to rise after entering the trade.
Entering at 3332 indicates that the trader is confident in buying gold at this level, expecting upward momentum. The target price of 3376 is approximately 44 points higher than the entry, offering a good potential profit. By setting the stop-loss at 3311, which is 21 points below the entry, the trader is managing risk in case the market moves against the position. The risk-to-reward ratio in this trade is favorable, as the potential reward is about twice the risk.
Gold prices are often influenced by factors such as inflation, interest rates, US dollar strength, and global economic uncertainty. A bullish position might be supported by weaker US economic data, lower Treasury yields, or geopolitical tensions that increase demand for gold as a safe-haven asset.
This trade setup is best executed with proper risk management, ensuring that only a calculated portion of the trading capital is risked. It is important to monitor market conditions closely, as gold prices can be volatile due to sudden news events or changes in investor sentiment.
Overall, the trade aims to capitalize on upward momentum from 3332 to 3376, while limiting potential losses with a well-placed stop-loss at 3311. Following the plan with discipline and avoiding emotional trading is key to achieving consistent results in XAU/USD trading.

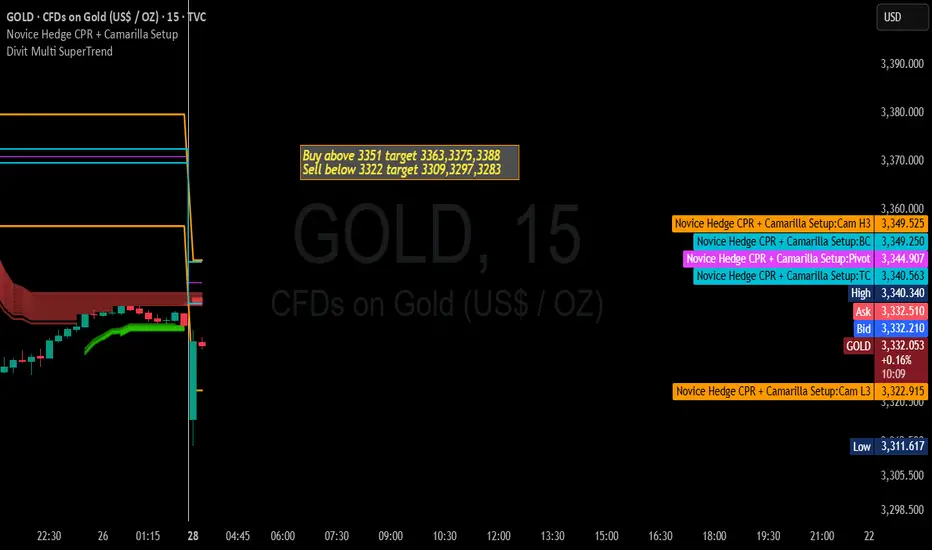
Gold Trading Strategy for 28th July 2025🟡 GOLD Trading Plan
💱 Instrument: Gold Spot
💲 Currency: USD
🟢 BUY Setup (Bullish Scenario)
📈 Buy ABOVE the high of the 1-hour candle that closes above $3351
🎯 Target Levels:
✅ Target 1: $3363
✅ Target 2: $3375
✅ Target 3: $3388
🔰 Example:
If a 1-hour candle closes at $3353 and its high is $3354, place a buy stop order above $3354.
🔴 SELL Setup (Bearish Scenario)
📉 Sell BELOW the low of the 1-hour candle that closes below $3322
🎯 Target Levels:
✅ Target 1: $3309
✅ Target 2: $3297
✅ Target 3: $3283
🔰 Example:
If a 1-hour candle closes at $3320 and its low is $3318, place a sell stop order below $3318.
🧠 Tips
🕐 Wait for the 1-hour candle to close above $3351 (for buys) or below $3322 (for sells).
📊 Use candlestick charts on platforms like TradingView or MetaTrader.
📏 Set stop-loss below the breakout candle’s low (for buys) or above its high (for sells).
📉 Always manage risk — don’t risk more than 1-2% of your capital per trade.
⚠️ DISCLAIMER ⚠️
This analysis is for educational purposes only and not financial advice.
📌 Always do your own research and consult a certified financial advisor before trading.
📉 Trading involves significant risk, including potential loss of capital.
Gold Trading Strategy Reference On Monday✅ Gold Market Weekly Summary
Gold prices experienced significant volatility this week and ultimately closed lower on the weekly chart, failing to hold above the key $3400 level. Although the price briefly achieved a bullish breakout earlier in the week, the rally lacked follow-through, indicating weak bullish momentum and growing market indecision from a technical perspective.
✅ Detailed Review
Gold surged by 2.4% in the first two trading days of the week, but gave back nearly 3% over the last three sessions. The reversal was primarily driven by renewed optimism surrounding trade negotiations led by former President Trump, which boosted risk appetite and dampened safe-haven demand for gold.
✅ Outlook for Next Week
Investors will closely monitor the Federal Reserve’s policy meeting scheduled for July 29–30. Market expectations suggest an extremely low probability of a rate cut during this meeting, with the likelihood of holding rates steady in September rising to approximately 40%, up sharply from around 10% a month ago.
✅ If Fed Chair Jerome Powell highlights progress in trade agreements as a reduction in economic uncertainty—thereby leaving the door open for a September rate cut—U.S. Treasury yields may fall sharply, potentially boosting gold prices. Conversely, if Powell cites rising inflation data and avoids signaling any easing at the next meeting, gold may come under renewed pressure.
✅ Technical Analysis
Gold suffered a sharp decline on Friday, breaking below the key 4-hour trendline support at the $3335 level, which we previously identified. This triggered renewed bearish momentum, and the current price action reflects a clear downtrend. Unless a firm bottom is established, the bearish trend is likely to continue.
✅ Hourly Chart Structure
Volatility between bulls and bears was apparent this week. The price followed an ascending channel during the first half of the week but reversed sharply in the latter half, erasing gains and forming a new descending channel. The $3350 level now acts as a critical pivot point and will serve as the key resistance level for bearish strategies next week.
✅ Conclusion
Given that both the 4-hour and daily charts have broken major support levels, the outlook has shifted from a mildly bullish consolidation to a trend-following bearish stance.
✅ Trading Strategy Reference:
🔰 Entry: Consider initiating short positions around the $3350 level
⛔ Stop-Loss: Place stops above $3360
🔰 Targets: Initial target at $3325; if broken, look for further downside toward the $3310 area
🔥Trading Reminder: Trading strategies are time-sensitive, and market conditions can change rapidly. Please adjust your trading plan based on real-time market conditions. If you have any questions or need one-on-one guidance, feel free to contact me🤝

POSITIVE Vision!IF Prices stands over 3406! We can expect a bullish months ahead.
Else in a big TF we are in super over bought conditions. We can see a big free fall at any times. Happy Monday folks!

“Still losing? It’s not your system – it’s your state of mind.”Still Losing Money? It's Not Your Strategy – It’s Your Mind That’s Failing You
Let’s be brutally honest.
Have you been repeating the same mistakes over and over… even though you know they’re wrong?
You know you shouldn’t enter trades without confirmation – but you do.
You know your stop-loss should be fixed – yet you keep moving it.
You know your mental state isn’t stable today – but you open the chart anyway and… trade again.
Don’t blame the market.
You’re not losing because it’s “manipulated.”
You’re losing because your emotions are in control – not your logic.
💣 The most dangerous mindset: Knowing it’s wrong… and still doing it
It’s not about lacking knowledge.
It’s not about having a weak strategy.
It’s about being hijacked by your own emotional reactions.
Ask yourself sincerely:
Are you trading to avoid boredom, anxiety, or emotional pain?
Do you open charts just to escape from real-life stress?
Are your trades a form of self-soothing rather than strategic action?
If yes, then it’s no longer about technical skills.
It’s about emotional management – and inner healing.
👹 Three psychological traps that silently ruin your trading every day:
1. FOMO – Fear of Missing Out
You see price running.
You see others winning.
You panic – “I cannot miss this one!”
→ You enter the trade impulsively, not logically.
FOMO means you don’t trust yourself to wait for better chances.
It’s fear-driven, not system-driven.
2. Revenge Trading – You just can’t stand losing
One loss and your ego is bruised.
You want to "get it back" instantly.
So you fight the market like it owes you something.
But the market doesn’t care.
You’re just venting your frustration – and losing even more in the process.
3. Overtrading – You tie your self-worth to every single trade
You feel valuable only when you’re placing trades.
Doing nothing feels like failure.
So you keep clicking – even without a plan.
Overtrading reflects your need to feel in control, even if it costs you your capital.
🔍 Harsh truth: You’re not losing to the market – you’re losing to your expectations
You expect to win fast.
To become rich fast.
To prove something to others – or to yourself.
And when that doesn’t happen, you spiral.
You're not really trading the charts.
You're trading your emotions.
✅ So what’s the solution?
Stop immediately when you feel emotionally unstable – no matter if you're in profit or loss.
Maintain a journal for your thoughts, not just your trades – track what you feel, not just what you did.
Ask yourself honestly:
Am I trading for profit, or to escape something?
Is this setup real, or am I afraid of missing out?
Invest in your inner self: meditation, walks, talking to a coach or mentor, resting properly.
💬 Final message:
Losing is not the problem.
Refusing to confront the real reason behind your losses – that’s the real danger.
You don’t need a new indicator.
You don’t need a magical strategy.
You need one decent system – and a calm, emotionally neutral mind to execute it.
The game is not on the screen.
It’s inside your head.
#TradingPsychologyIndia #MindsetForSuccess #FOMOTrading #RevengeTrading #OvertradingIssues
#ForexIndia #NSETrader #DisciplineInTrading #TradingStruggles #EmotionalAwareness #TradeLikeAPro
#MentalStrengthInMarkets #TradingMindsetMatters #ConsistencyInTrading
Commit to the Shift next week - focuse on becoming consistent
For the next week, we’re focusing on two powerful tasks that will move you closer to becoming a consistently profitable trader:
✅ Task 1: Deep self-reflection. Understand your strengths, demons, and bad habits—the things holding you back from consistency. Identify your triggers and write them down. Awareness is the first step to control.
✅ Task 2: Pure execution. When you know your edge, the next step is flawless execution. Commit to taking 30 trades, track every single one, and review them with complete honesty.
This challenge may not sound flashy—there’s no fancy technical talk here—but it’s a game changer. If you take it seriously, this one week can push you seven steps ahead in your journey and set you on the path to join the top 5% of traders.
Take the challenge. Do the work. Your future self will thank you.
