GOLD(XAU/USD) BULLISH - 1 HR Bullish OutlookGold (XAU/USD) – 1H Bullish Outlook
Gold continues to maintain a bullish structure on the 1-hour timeframe after sweeping liquidity from recent lows.
Currently, price is showing strength, but the best risk-reward entry would be on a retest of:
- 🟢 Breaker Block (3340/3345) / FIB 0.5 Level around 3327
### Key Points:
- ✅ Market already bounced strongly from the 4H Order Block, confirming higher-timeframe demand.
- ✅ Waiting for a lower timeframe (5-min) confirmation is important to avoid false entries.
- 🎯 If 3345 area holds (Breaker Block), we could see continuation toward higher liquidity levels.
### Trading Plan:
- 📍 Buy Zone: 3327 (Breaker Block + FIB 0.5)
- ⏳ Confirmation: 5-min structure shift
- 🎯 Target: Higher liquidity zones above recent highs
CFDGOLD trade ideas

Part 1 Ride The Big Moves Call and Put Options in Action
Call Option Example
Reliance is trading at ₹2500.
You buy a 1-month call option with strike price ₹2550, premium ₹50, lot size 505.
If Reliance rises to ₹2700 → Profit = (2700 - 2550 - 50) × 505 = ₹50,500.
If Reliance falls below 2550 → You lose only the premium (₹25,250).
Put Option Example
Nifty is at 20,000.
You buy a 1-month put option, strike 19,800, premium 100, lot size 50.
If Nifty falls to 19,200 → Profit = (19,800 - 19,200 - 100) × 50 = ₹25,000.
If Nifty rises above 19,800 → You lose premium (₹5,000).
Participants in Options Trading
Option Buyer – Pays premium, has limited risk and unlimited profit potential.
Option Seller (Writer) – Receives premium, has limited profit and potentially unlimited risk.
Example:
Buyer of call: Unlimited upside, limited loss (premium).
Seller of call: Limited profit (premium), unlimited loss if stock rises.

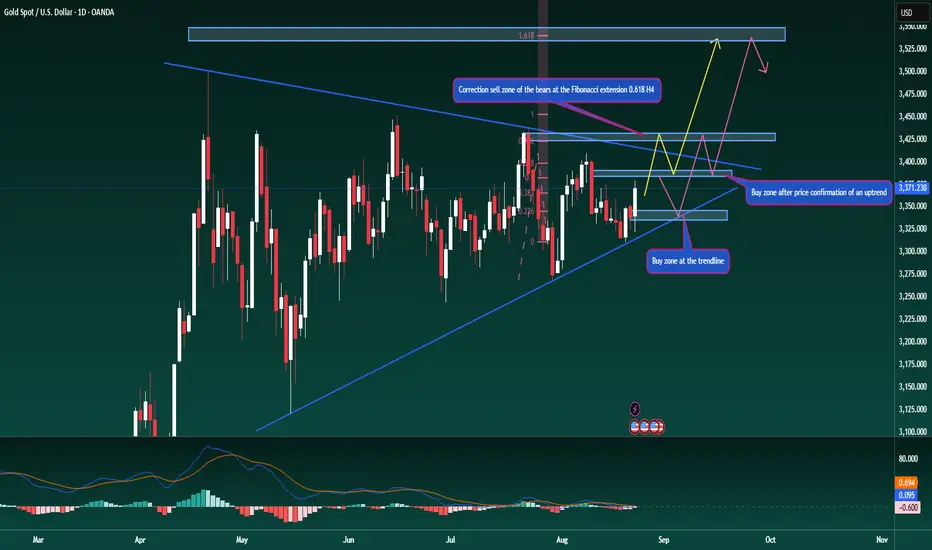
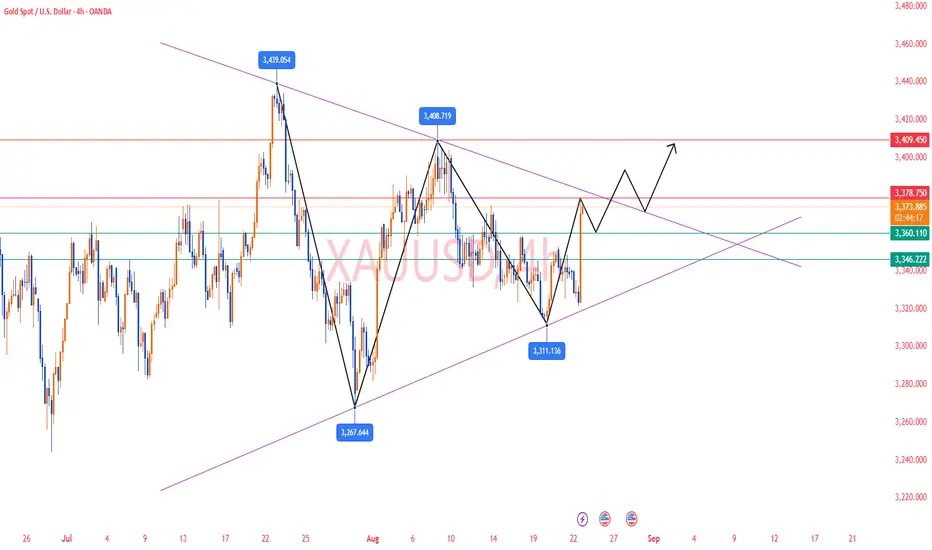
Gold Daily Chart – Final Week of AugustGold Daily Chart – Final Week of August
Hello traders, let’s discuss the gold outlook for the coming week.
Gold has continued its strong bounce after touching the ascending trendline on the D1 chart, in line with the outlook shared earlier. This move also makes the triangle pattern more valid. For the week ahead, price is likely to trade within the 3330–3410 range, about 80 dollars of movement.
While the long-term expectation is for gold to push towards new ATH levels, a confirmed breakout from this triangle is required first. After such a breakout, a short pullback is possible before the next leg higher (as shown on my chart).
On the H4 chart, Friday’s rally allows us to draw a Fibonacci Extension, pointing towards 3390 and 3430 as higher levels to watch. These zones could act as short-term selling opportunities, based on profit-taking sentiment from buyers.
On the daily timeframe, if the breakout from the triangle plays out, gold could extend as high as 3540, creating a new ATH – this is the long-term scenario. On the downside, if price pulls back, the ascending trendline around 3341 remains a key area to look for new buying opportunities.
Also note, this is the last week of August. On Friday, there could be a liquidity grab to rebalance gold’s value and settle large institutional flows, so caution is advised.
This is my personal outlook for XAUUSD for the week ahead. I hope it helps in building your own trading plan.
Share your thoughts in the comments so we can learn from each other.
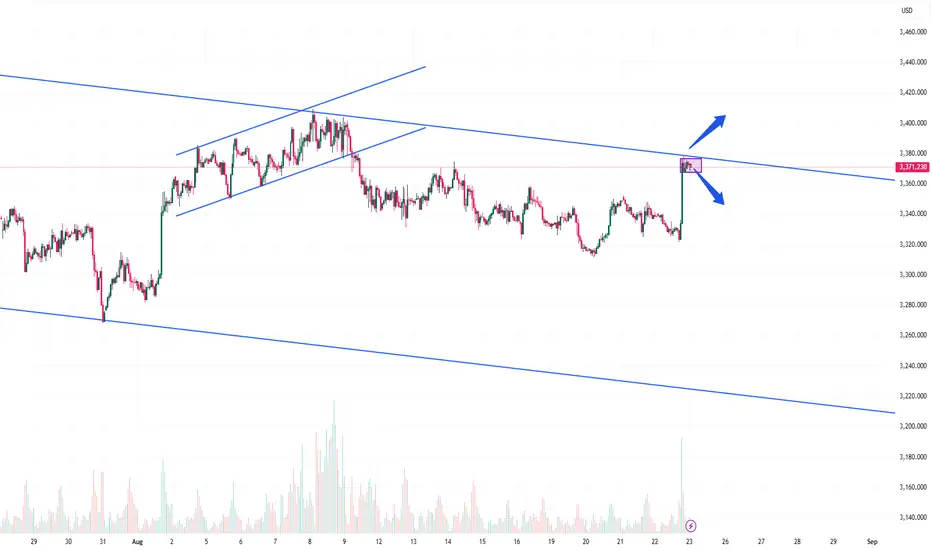
XAUUSD – At Critical Trendline | Breakout vs. RejectionDescription:
Gold has reached a major descending channel resistance where the next move could define short-term direction.
🔹 Market Context:
Price has been respecting the broader descending channel.
Recent sharp rally has brought price into the upper boundary of this structure.
Volume has picked up, showing strong participation at this zone.
🔹 Key Levels to Watch:
Upper Trendline Resistance: Potential breakout zone (monitor for candle closes above with volume).
Immediate Support Zone: Near current consolidation area – holding this level keeps bullish pressure alive.
Mid-Channel Level: Acts as a pivot; rejection could bring price back here as the first downside target.
Lower Channel Support: Remains the major bearish target if rejection extends further.
🔹 Scenarios:
Bullish: A clean breakout above the descending trendline with follow-through momentum could trigger upside continuation.
Bearish: Failure to break higher and rejection from this zone could re-align price back into the channel, targeting mid- and lower boundaries.
👉 This is a high-probability decision point. Confirmation will be key before aligning with either direction.
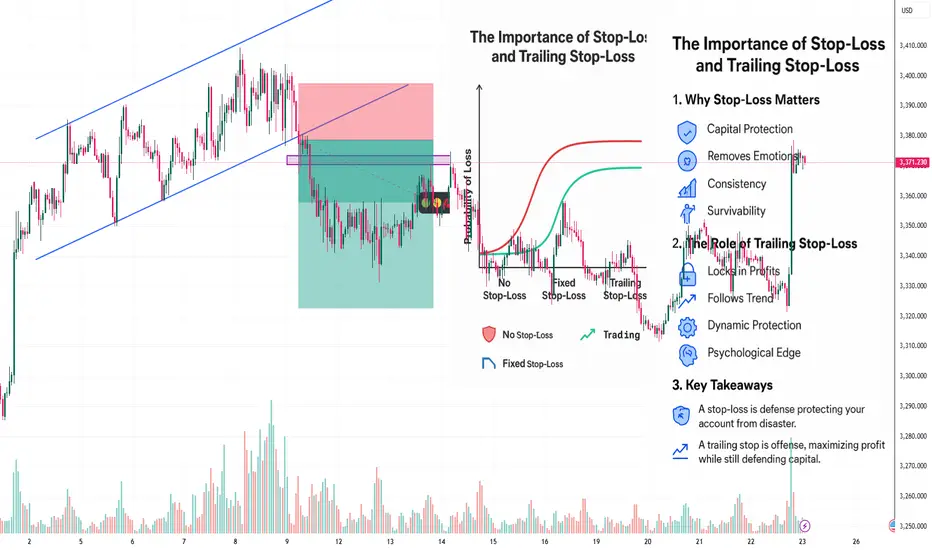
The Importance of Stop-Loss and Trailing Stop-Loss📊
🔹 1. Why Stop-Loss Matters
Capital Protection: Prevents small losses from turning into account-destroying drawdowns.
Removes Emotions: Cuts the trade automatically, avoiding fear/hope-driven decisions.
Consistency: Keeps your risk per trade fixed, aligning with your strategy.
Survivability: The #1 rule in trading is not to lose big; stop-loss ensures you stay in the game.
🔹 2. The Role of Trailing Stop-Loss
Locks in Profits: Moves along with price to secure gains while keeping the trade open.
Follows Trend: Keeps you in winning trades longer, capturing extended moves.
Dynamic Protection: Adjusts with market momentum instead of staying static.
Psychological Edge: Reduces the stress of “when to exit,” as the market decides for you.
🔹 3. Key Takeaways
A stop-loss is defense, protecting your account from disaster.
A trailing stop is offense, maximizing profit while still defending capital.
Together, they form a balanced risk management system:
Stop-loss = Control the downside.
Trailing stop = Let the upside run.
XAU/USD – Bullish Breakout: Buy Dips Toward $3,409 Target📊 XAU/USD (Gold) – 2H Analysis
Gold has just broken out of its descending channel, showing a clear change of character (CHOH) around the $3,348–$3,358 support zone. This breakout suggests bullish momentum is taking control after weeks of compression.
Key Observations:
✅ Support Zone: $3,348–$3,358 is now a strong demand zone (previous rejection area flipped to support).
✅ Moving Averages: Price is above both the EMA 70 ($3,342) and EMA 200 ($3,346), strengthening the bullish bias.
✅ Projection: A potential continuation rally toward $3,409 (major liquidity target).
⚠️ Risk: If the support zone fails, price could re-test $3,334 or even $3,326.
Trading Plan (Short-Term):
Entry (Buy): Around $3,358–$3,348 (support retest).
Stop Loss: Below $3,342 (under EMAs).
Target 1: $3,390
Target 2: $3,409
👉 In summary: Gold is in a bullish reversal phase, and buying dips into the support zone offers the best risk-reward setup.

Gold Spot (XAU/USD) – 4H Chart AnalysisCurrently, Gold is trading at $3,371 after a strong bullish push. Price action is forming a symmetrical triangle pattern, with resistance from the descending trendline (red) and support from the ascending trendline (green).
Key levels to watch:
🔴 Resistance: $3,377 – $3,380 (confluence with trendline & horizontal resistance)
🟢 Support: $3,310 (strong horizontal support zone)
The RSI (14) is currently at 68.45, approaching the overbought region, which could suggest a short-term pullback unless strong momentum continues.
📌 Bullish Scenario: A breakout above $3,380 could open the door for continuation toward $3,420 – $3,440.
📌 Bearish Scenario: Failure to break resistance may lead to a retest of the $3,310 support, and a breakdown below could push price toward $3,260.
⚖️ Overall, Gold is consolidating within a tightening range – a breakout is likely soon. Traders should watch for confirmation before entering positions.

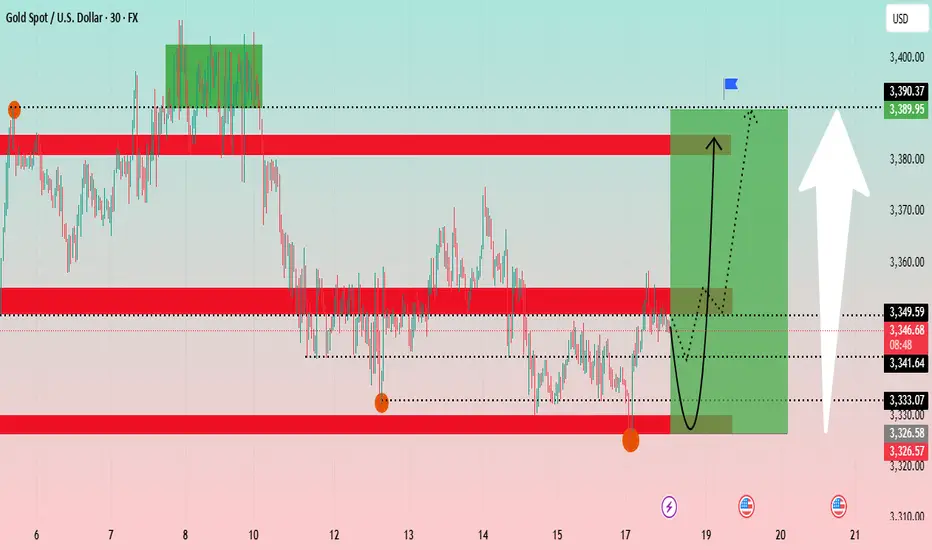
Gold Technical Analysis: Navigating Key Support ?The Gold chart shows a 30-minute timeframe analysis, highlighting recent price consolidation and potential future trends. The analysis suggests a potential V-shape recovery for gold.
Key Levels: The price is currently at a critical juncture, having tested a support zone around 3,326 - 3,333 USD. This zone has proven to be a strong base. Above it, a significant resistance zone is identified between 3,349 - 3,353 USD. Further up, another major resistance is at approximately 3,389 USD.
Price Action: The price has recently experienced a sharp decline and is now in a consolidation phase. The chart projects a potential bounce from the current levels, indicated by the black curved arrow, with the target being the upper resistance zone around 3,389 USD. The green shaded box illustrates the potential upward movement from the current position.
Conclusion: Gold appears to be at a key support level and could be poised for a rally if it successfully breaks above the immediate resistance zone.
Bitcoin (BTC/USDT) 4-Hour Chart Analysis
The Bitcoin chart shows a 4-hour timeframe analysis, focusing on a short-term uptrend channel.
Key Levels: The price is trading within an ascending channel. A significant support zone is identified between 112,000 - 114,000 USDT. A "weak supply zone" is marked around 118,000 USDT, which is currently acting as support. A major resistance is at approximately 124,564 USDT.
Price Action: After a strong push towards the channel's upper boundary, the price has pulled back and is now retesting the "weak supply zone." The blue and red arrows project two possible scenarios: a bounce back up towards the channel's high, or a deeper retracement towards the channel's lower trendline. The price movement appears to be following the blue projected path.
Indicators: The Ichimoku cloud and RSI strategy are used to confirm the trend and identify entry/exit points. The price is above the Ichimoku cloud, indicating a bullish trend.
Conclusion: Bitcoin is at a pivotal point within its uptrend channel. Its ability to hold the 118,000 USDT level will be crucial for a potential re-test of the 124,564 USDT resistance.
Xau USD Gold 15 min Chart Xau USD gold Chart - given good return yesterday in buy side. Buy was near 3321 with SL . U can see all in chart . Demand zone was at bottom. Now it's in a Range as u can see. If range is broke up or down , we can see trade . Thanks 🙏

Gold: Strong Upside Potential Above $3,350Hello traders,
Looking at the current market setup, gold is hovering near the key resistance zone between $3,340 and $3,350. This area acts as a decisive barrier, and a clear breakout could trigger strong bullish momentum.
Recent price candles with higher trading volumes signal that buyers are becoming more aggressive, suggesting that gold may soon overcome $3,350 and move towards $3,370 or beyond.
On the macro side, expectations of a Federal Reserve rate cut continue to weigh on the US dollar, providing additional support for gold as a safe-haven asset. If the Fed’s meeting minutes or Jerome Powell’s speech at Jackson Hole confirm a dovish stance, it could further fuel the rally.
What’s your view on this move? Do you believe gold can break above $3,350 and extend its rally?
Share your opinion—I’d love to hear your thoughts!

XAUUSD: Downtrend Under Pressure from Strong USDCurrently, XAUUSD is trading around 3,328.400, with resistance at 3,369.000 and support at 3,313.000. The price is forming a downtrend within a price channel, and if it breaks the support at 3,313.000, it could push the price lower towards the 3,300.000 target. The EMA indicators show that the downward momentum continues, and if the price fails to break through the resistance at 3,369.000, the downtrend will remain in place.
Market Context:
Recent news has caused XAUUSD to drop, mainly due to the recovery of the USD after positive economic signals. Higher-than-expected unemployment claims data strengthened the USD, putting downward pressure on XAUUSD.

Gold Analysis and Trading Strategy | August 22✅ After a period of consolidation, gold posted a strong bullish candlestick today, sparking short-term bullish sentiment. Our buy positions placed in the 3323–3326 range also successfully gained nearly 300 pips. Overall, gold remains in a wide high-level consolidation range (around 3310–3400).
🔹 Moving Averages: MA5 and MA10 have formed a golden cross, but the price is still capped by MA20 and MA60, meaning the medium-term trend has not fully reversed yet.
🔹 Indicators: MACD shows a bullish crossover at the lows, but histogram momentum has not expanded; RSI is near the mid-range, reflecting strong competition between bulls and bears.
✅ On the 4-hour chart, gold rebounded sharply after bottoming at the 3311 level, reaching as high as 3378, but faced rejection at upper resistance. It is now consolidating between 3340–3375. The Bollinger Bands are slightly opening, and price is trading around the mid-band. If gold can hold above 3350–3360, it may continue toward 3375–3400. However, a drop below 3340 could trigger further downside risk.
🔴 Resistance Levels: 3380–3384
🟢 Support Levels: 3355–3360
✅ Trading Strategy Reference:
🔰 If price pulls back and holds at 3355–3360, consider light long positions, targeting 3375–3380.
🔰 If price rebounds to 3380–3385 and faces rejection, consider light short positions, targeting 3370–3360.
🔰 If price breaks above and holds 3375–3380, further upside toward 3400 is possible.
Gold – Medium-Term Buy StrategyGold – Medium-Term Buy Strategy
Hello traders,
Gold continues to move within wave B under Elliott Wave structure. I expect price to retest the trendline once more, with the strong support around 3325 — which already triggered a sharp bounce yesterday — likely to play a key role before wave C begins.
According to Elliott theory, wave C is often the strongest, and in this case, it could extend towards the 339x region. This offers a swing buy opportunity with a reasonable target of 30–40 dollars.
The MACD also supports this outlook, with volume holding above the average line and the MACD (green) remaining on top.
Key Resistance: 3348–3352, must be broken to open the way towards 339x.
Key Support: 3313, if broken, the scenario shifts and longer-term selling pressure could return.
Buy Zone: Around 3327, with profit potential of 40–60 dollars.
This is my personal outlook for gold this week. I hope it helps you align your trading plan.
What do you think about gold’s direction here? Share your views in the comments below.

Sell Gold with SL of 3390Gold Technical Outlook – Post Jackson Hole
Despite expectations that the Jackson Hole Symposium and renewed talk of rate cuts might lift bullion, gold has failed to decisively cross its key resistance at $3,388. This inability to break higher indicates that near-term bullish momentum is weakening.
🔎 Market & Technical Context
Resistance: Multiple technical analyses (DailyForex, OANDA, FXOpen) confirm that $3,388–$3,390 remains the critical ceiling for gold. A sustained break above could open the path toward $3,500, but until then, sellers dominate.
Support Zones: Initial support is seen around $3,330–$3,328, aligning with the 100-day SMA. Deeper downside levels lie at $3,280–$3,270, which also coincides with strong trader interest.
Bearish Trigger: InvestingLive highlights that a failure at $3,388 often activates a short trade setup, reinforcing the bearish risk below this zone.
📉 Outlook & Scenarios
If resistance at $3,388 holds, gold is likely to correct lower toward $3,330 and potentially retest $3,280–$3,265.
A close above $3,390 would negate this bearish view and could revive upside momentum toward $3,450–$3,500.
📝 Summary
Gold’s inability to rally past its critical resistance—despite supportive macro headlines—suggests the market may already be pricing in rate cut optimism. Unless $3,388 is broken decisively, the bias leans toward a correction.
Key Levels:
Resistance: $3,388–$3,390
Support: $3,330, then $3,280–$3,265

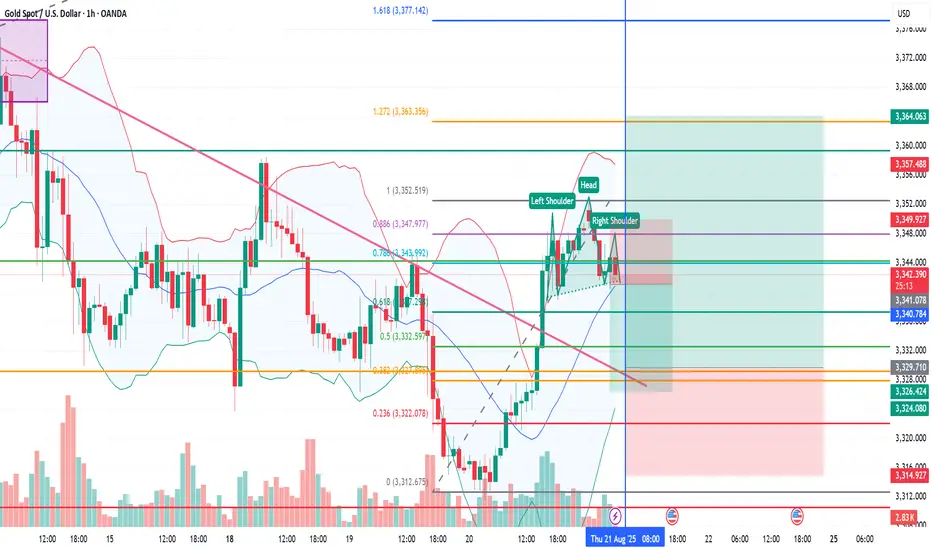
XAUUSD- H&S reversal followed by entry at fib kill zone levelTrade idea 1) 21/08/25 Asian session Waiting for a H&S reversal on the break of the neckline on XAUUSD, take profit at H1 demand zone.
Trade idea 2)Then entry at key fib level (with candle confirmation). TP1 at 1.27 TP2 at 1.618 fib extension.
Gold (XAUUSD) – Key Support Zone in Play: 3330–3315Gold is currently approaching a critical support zone at 3325–3315, where buying interest is expected to build. A confirmed bounce from this area could trigger a potential bullish reversal and a move toward higher targets.
🔻 Trade Setup
Entry: Buy at 3327 | Add on dips near 3310
Targets: Refer to marked zones on the chart
Invalidation: Setup invalid if price closes below 3304
📌 Risk-Reward Outlook:
Tight downside risk with strong upside potential. Stick to your risk management rules and adjust your position size accordingly.
👍 If this setup resonates with you, give it a like and share your thoughts below. Let’s grow and win together!
Happy Trading,
– The InvestPro Team

up🟢 Gold (XAUUSD) – Support Hold & Possible Upside Move
Price has been consolidating inside a falling wedge pattern with multiple retests of support. The recent candles show buyers stepping in around the 3325–3328 support zone (highlighted in purple).
🔑 Key Points:
Double bottom structure forming (circled areas).
Price respecting wedge support trendline.
Upside target around 3336–3342 (first resistance zone).
Stop loss below 3325 support.
📈 Setup:
Entry: Near current support (3328–3330)
SL: Below 3325 (purple box)
TP1: 3336
TP2: 3342+
This setup looks favorable if buyers continue to defend the lower levels. A clean breakout above the wedge resistance could trigger momentum towards the upper resistance zones.
⚠️ Note: If 3325 support fails, expect a deeper correction towards 3315–3308.

XAU/USD Price Action Zones & Trade Setup (Aug 20, 2025)Analysis:
The market recently made a CHoCH (Change of Character), signaling a possible bearish structure.
First Selling Zone (3340 – 3350): Strong resistance area where sellers may push price down.
Second Selling Zone (3350 – 3360): A deeper liquidity grab area for confirmation shorts.
First Buying Area (3308 – 3320): Demand zone where buyers might step in for a short-term bounce.
Second Buying Area (3270 – 3280): Stronger demand, ideal for swing buy opportunities if price dips further.
Price is currently around 3323, hovering near equilibrium, likely to retest selling zones before dropping to buying areas.
📈 Trade Plan:
Sell Entries
🔹 First Short: Around 3340 – 3350 (First Selling Zone).
🔹 Second Short (confirmation): Around 3350 – 3360 (Second Selling Zone).
🎯 Targets:
TP1: 3320 (First Buying Area)
TP2: 3280 (Second Buying Area)
🛑 Stop Loss: Above 3365
Buy Entries
🔹 First Buy: Around 3310 – 3320 (First Buying Area) for a small bounce.
🔹 Second Buy (stronger): Around 3270 – 3280 (Second Buying Area).
🎯 Targets:
TP1: 3340 (back to resistance)
TP2: 3355 (liquidity above first selling zone)
🛑 Stop Loss: Below 3260

XAU/USD: Bearish Bias Ahead of Fed SpeechesHello everyone,
Today the market awaits speeches from Collins, Powell, Hammack, and even the U.S. President. With such anticipation, risk appetite remains cautious and the USD is seeing mild support. In this context, I lean towards a bearish scenario for gold on the daily chart: price is stuck below the dense resistance cluster around 3340–3355 (supply FVG + Ichimoku cloud/volume area), where repeated attempts to push higher have failed.
The sideways–to–downward structure, marked by lower highs since early this month, combined with the latest candle closing under the red FVG zone, signals fading buying momentum. Unless we hear clear dovish tones from the Fed, the 3340–3355 supply zone is likely to continue capping price. My preferred scenario is a pullback to 3315–3305, with an extension to 3295–3285 if USD strength persists. This outlook will be invalidated if we see a daily close above 3350, in which case a move back toward 3370 becomes possible.

Gold Plan 22/08 – Captain Vincent ( IN )Background
On the H1 timeframe , Gold continues to move sideways within the 3328 – 3350 range, sweeping liquidity again and again, making it difficult for retail traders to spot a clear trend.
Currently, Gold has absorbed almost all liquidity from the Nonfarm FVG .
Therefore, the next price action will largely depend on smart money moves and upcoming news catalysts .
Even though the overall trend is still unclear, we can still build trading setups around these key levels .
🪙 Key Levels
🔹 Storm Breaker 🌊 (Sell Zone 3368 – 3370)
SL: 3376
TP: 3365 → 3360 → 3355 → 3350 → 33xx
🔹 Golden Harbor 🏝️ (Buy Zone 3313 – 3315)
SL: 3305
TP: 3320 → 3325 → 3330 → 33xx
📌 Trading Outlook
On higher timeframes, sellers still hold the advantage .
However, Gold may need to test resistance zones again to confirm.
If price reaches Storm Breaker 🌊 → Watch for reaction and prepare to Sell.
If price drops to Golden Harbor 🏝️ → Strong support remains for short-term Buy opportunities.
⚓ Captain Vincent’s Note
"When the sharks sweep the waves, retail traders panic. But those holding the key level map will always know where the safe harbor lies."

Gold (XAU/USD) Intraday Buy Plan - ICT PerspectiveGold continues to respect bullish order flow on the higher timeframes, aligning well with the 4H bullish bias. Currently, price has created an Order Block (OB) at 3330.500, which provides the best intraday buy opportunity.
---
🔑 Key ICT Concepts in Play
✅ Order Block Alignment – The buy zone at 3330.500 sits perfectly within a higher-timeframe 4H order block, adding confluence to the setup.
✅ Liquidity Pool Above 3340 – There is a cluster of equal highs / liquidity pool sitting above 3340. Price is highly likely to target and sweep that zone.
✅ Liquidity Sweep Model – Once the 3330.500 OB holds, we can expect market makers to push price into the liquidity resting above 3340, with potential extension to 3347+.
---
📊 Trade Plan
📍 Buy Zone: 3330.500 (4H aligned Order Block)
⛔ Stop Loss: 3325.400 (below OB invalidation)
🎯 Target 1: 3340 (liquidity pool)
🎯 Target 2: 3347+ (extended liquidity sweep)
---
⚡ Notes for Intraday Traders
Always wait for lower timeframe confirmation (5m or 1m CHoCH / BOS) at the OB for precision entry.
Protect capital → move stop to breakeven once first liquidity is taken at 3340.
This setup aligns with ICT’s Order Block + Liquidity Pool model, offering high RR potential.
👉 This is a textbook example of HTF bias + OB entry + liquidity sweep target, ideal for day traders using Smart Money Concepts.

Money and Mind in Trading1. Introduction
Trading is often viewed as a battle between the trader and the market. But in reality, the market is neutral—it doesn’t care about you, your opinions, or your predictions. The true battle is internal, between your money (how you manage your capital) and your mind (how you handle emotions and psychology).
Think about this:
A trader with a brilliant strategy but poor money management will eventually lose all capital.
A trader with enough money but a weak mindset will panic and make irrational moves.
Only when money management and psychological discipline align, can trading become consistently profitable.
Thus, the formula for success in trading can be summarized as:
Trading Success = Money Management × Mind Management × Strategy
2. The Role of Money in Trading
a) Importance of Capital
Money is the fuel of trading. Without adequate capital, even the best strategies can fail.
Undercapitalized traders often take excessive risks to make meaningful returns.
Well-capitalized traders can afford patience, better position sizing, and discipline.
For example, if you only have ₹10,000, risking ₹5,000 on a single trade feels tempting but dangerous. With ₹10 lakh, you can risk just 1% per trade and still earn consistently without emotional stress.
b) Risk Management
Risk management is about protecting capital first and focusing on profits second.
Golden rules:
Never risk more than 1-2% of capital per trade.
Always set a stop-loss before entering.
Diversify trades instead of going “all in.”
This ensures survival. Because in trading, survival = opportunity to win tomorrow.
c) Position Sizing
Position sizing determines how much to trade given your account size and risk tolerance.
Formula example:
If you have ₹1,00,000 capital and risk 1% per trade (₹1,000), and your stop-loss is ₹10 per share, you can buy 100 shares (₹1,000 ÷ ₹10).
This systematic approach removes emotional guessing.
d) Compounding and Capital Growth
The real wealth in trading comes from compounding small gains consistently.
A trader making 1% per week can grow capital by over 67% annually (with compounding).
Patience + consistency beats “get rich quick.”
e) Common Money Mistakes in Trading
Over-leverage (borrowing excessively to trade).
No risk/reward planning.
Chasing losses (“revenge trading”).
Putting all money in one stock/option.
Trading without capital backup (no emergency funds).
Money mistakes often lead to psychological pressure, which worsens decision-making.
3. The Role of Mind in Trading
If money is the fuel, then the mind is the driver. Even with perfect capital management, a weak mindset can wreck results.
a) Psychology of Decision-Making
Trading decisions are influenced by:
Fear – “What if I lose?”
Greed – “Let me hold longer for bigger profit.”
Hope – “Maybe it will recover.”
Regret – “I should’ve sold earlier.”
These emotions distort rational thinking.
b) Common Psychological Biases
Overconfidence Bias – After a few wins, traders feel invincible.
Loss Aversion – People hate losing ₹1 more than they enjoy gaining ₹1.
Confirmation Bias – Seeking news that supports your view while ignoring opposite evidence.
Gambler’s Fallacy – Believing a losing streak must end soon.
Recognizing these biases helps neutralize them.
c) Discipline Factor
Discipline = Following your trading plan no matter what.
Without discipline, traders exit winners too early and hold losers too long.
With discipline, traders follow stop-loss, stick to risk per trade, and wait for setups.
d) Patience vs Impulsiveness
Great trades don’t appear daily. Impulsive traders overtrade, while patient traders wait for high-probability setups.
As Jesse Livermore said: “It was never my thinking that made me money. It was always my sitting.”
e) Building Mental Resilience
Trading is stressful because of uncertainty. To build resilience:
Accept that losses are part of the game.
Detach ego from trades.
Focus on the process, not outcome.
Develop habits outside trading (exercise, meditation, journaling).
4. The Money-Mind Connection
Money and mind are deeply linked in trading:
Lack of money → stress, fear, over-leverage.
Too much greed for money → reckless decisions.
Emotional mind → bad money management.
Example: A trader with ₹20,000 risks ₹10,000 in a single option trade. Why? The mind says: “I need quick profits.” But when the trade goes against him, fear takes over and he exits at maximum loss. This is the money-mind trap.
Thus, the solution is balance:
Adequate capital.
Strict money management.
Calm psychology.
5. Practical Framework: Money + Mind Balance
Here’s a practical blueprint:
Step 1: Define Capital Rules (Money)
Risk per trade: 1% of account.
Risk per day: 3% max.
Keep emergency funds separate.
Step 2: Define Psychological Rules (Mind)
Accept losses without revenge trading.
No overtrading after big wins.
Stick to trading hours and avoid burnout.
Step 3: Journaling
Keep a trading journal tracking not just trades, but also your emotions. Example:
“Exited early due to fear.”
“Didn’t follow plan because of greed.”
This self-awareness improves both money and mind management.
6. Case Studies & Examples
Case 1: The Undisciplined Trader
Rahul starts with ₹50,000. He risks ₹20,000 on a single option trade. It fails. Capital halves. In desperation, he doubles down and loses everything.
Lesson: Poor money management + emotional revenge trading = wipeout.
Case 2: The Disciplined Trader
Meera starts with ₹1,00,000. She risks only 1% per trade. She loses 5 trades in a row, but her account is still ₹95,000. On the 6th trade, she wins 5R (₹5,000). Net balance: profit.
Lesson: Risk control and patience protect the trader until a winning streak comes.
7. Conclusion: The Balanced Trader’s Blueprint
Trading is not just charts, patterns, or strategies. It is a test of two inner resources:
Money – How you allocate, risk, and grow your capital.
Mind – How you manage emotions, discipline, and psychology.
Without money, you can’t trade. Without the right mind, you can’t trade successfully. Together, they form the foundation of long-term trading success.
The secret is not to chase quick riches, but to survive, grow steadily, and let compounding work. And survival comes only when your money rules protect your capital and your mind rules protect you from yourself.
In short: Master the money, master the mind, and the market will reward you.