Watch for a Potential Pullback (July 23) - GOLD PLAN XAUUSD – Is the Bullish Wave Losing Steam? Watch for a Potential Pullback (July 23)
📰 Market Overview
Gold made a strong rally last night, fueled by:
Fed Chair Powell’s speech, which avoided any controversial remarks or hints about stepping down.
Rising geopolitical tensions between the US, China, and the EU, with August 1st looming as a critical deadline.
A dip in US bond yields and the dollar, giving risk assets — including gold — room to rise.
While there’s no major news on today’s calendar, the market could remain volatile within a wide range.
📉 Technical Outlook
Gold seems to be wrapping up its bullish wave as seen on the H4 chart. On the H1 and M30 timeframes, reversal candles are starting to form — an early signal of potential correction.
The short-term support at 3412 – 3410 is the key zone to watch. If that breaks and we get a clean breakdown from the trendline, a deeper pullback could be underway — possibly heading toward liquidity zones lower down.
Two main Fair Value Gap (FVG) areas on H1 are also in play as high-probability liquidity targets.
Down at the 335x region, we have a confluence of FIB 0.618 retracement and historical buying interest — making it an attractive zone for long setups if the price reacts properly.
📌 Trade Setups for Today
🔻 SELL ZONE: 3469 – 3471
Stop Loss: 3475
Take Profits: 3465, 3460, 3455, 3450, 3445, 3440, 3430, 3420
→ Ideal zone to look for bearish setups after a retest.
🔸 BUY SCALP: 3385 – 3383
Stop Loss: 3379
Take Profits: 3390, 3394, 3398, 3402, 3406, 3410
→ Short-term buy for intraday traders catching the pullback.
🔹 LONG-TERM BUY ZONE: 3356 – 3354
Stop Loss: 3350
Take Profits: 3360, 3364, 3368, 3372, 3376, 3380, 3390, 3400
→ This is the deep liquidity zone worth watching for high-conviction buy entries.
⚠️ Risk Reminder
With fewer news catalysts, gold may trap traders by sweeping liquidity in both directions.
Stick to your plan, follow TP/SL strictly, and avoid chasing price. Let the market come to you.
💬 Sometimes the best trade is waiting for the right level. Stay patient, stay sharp.
CFDGOLD trade ideas

XAU/USDXAU/USD presents a promising intraday trade setup with a well-defined entry, stop-loss, and exit level. The entry is placed at 3389 targeting an upside move toward 3373, with a protective stop-loss at 3396 to limit downside risk. This setup offers a favorable risk-to-reward ratio, aligning with disciplined trading principles.
Gold remains supported by global uncertainties and a softer dollar, and the price action near 3389 suggests a potential bounce from minor support, confirmed by bullish momentum on lower timeframes. The stop-loss at 3396 is strategically placed below the immediate support zone to avoid getting caught in minor noise, while protecting capital if the trend reverses.
The target at 3373 corresponds with the next resistance zone and a recent swing high, making it a realistic and technically sound exit. Traders should monitor key economic releases during the session, such as US PMI or Fed commentary, as they can trigger volatility in gold.
Stick to the plan: enter at 3389 when price confirms, use the stop-loss at 3396 to cap risk, and exit at 3373 to lock in profits. Avoid chasing moves and ensure proper position sizing to maintain risk discipline on this XAU/USD trade.

GOLD - PULLBACKS LIKELY BEFORE CONTINUED UPSIDE - UPTREND INTACTSymbol - XAUUSD
CMP - 3369.50
Gold has been advancing steadily since the start of the trading session, moving toward the 3374 area of interest. Following a breakout above prior consolidation resistance, the metal may now be poised to retest this breakout level before continuing its upward trajectory.
The current rally is supported by heightened trade related risks and a softening US dollar. After briefly declining to 3310, gold resumed its upward momentum, with a key objective at the 3368 resistance level. The recovery is underpinned by ongoing uncertainty surrounding Trump’s trade policy, market anticipation ahead of Powell’s upcoming speech, and broader geopolitical tensions - including trade disputes with the EU, political instability in Japan, and recent criticism of the Federal Reserve from the White House. These factors have prompted a temporary flight to safety, benefiting gold.
From a technical perspective, gold is in a post-breakout realization phase following the consolidation breakout. However, resistance at 3368 has capped further gains for now, and a near-term pullback remains possible. The 3350–3355 support zone is currently in focus. Sustained bullish control above this level could reignite upward momentum and reestablish the breakout continuation.
Key Resistance Levels: 3368, 3374
Key Support Levels: 3345, 3332
The broader market bias remains bullish, bolstered by dollar weakness and persistent risk aversion. Market participants are closely monitoring developments involving Trump and remarks from Powell. Should Powell signal a dovish shift - such as a potential rate cut announcement (e.g. during tomorrow’s 12:30 GMT statement) - gold may extend its gains.

Target Hit in XAU/USDHELLO FRIENDS.,
XAU/USD presents a promising intraday trade setup with a well-defined entry, stop-loss, and exit level. The entry is placed at 3428, targeting an upside move toward 3390, with a protective stop-loss at 3434 to limit downside risk. This setup offers a favorable risk-to-reward ratio, aligning with disciplined trading principles.
Gold remains supported by global uncertainties and a softer dollar, and the price action near 3428 suggests a potential bounce from minor support, confirmed by bullish momentum on lower timeframes. The stop-loss at 3434 is strategically placed below the immediate support zone to avoid getting caught in minor noise, while protecting capital if the trend reverses.
The target at 3390 corresponds with the next resistance zone and a recent swing high, making it a realistic and technically sound exit. Traders should monitor key economic releases during the session, such as US PMI or Fed commentary, as they can trigger volatility in gold.
Stick to the plan: enter at 3428 price confirms, use the stop-loss at 3434 cap risk, and exit at 3390 to lock in profits. Avoid chasing moves and ensure proper position sizing to maintain risk discipline on this XAU/USD trade.

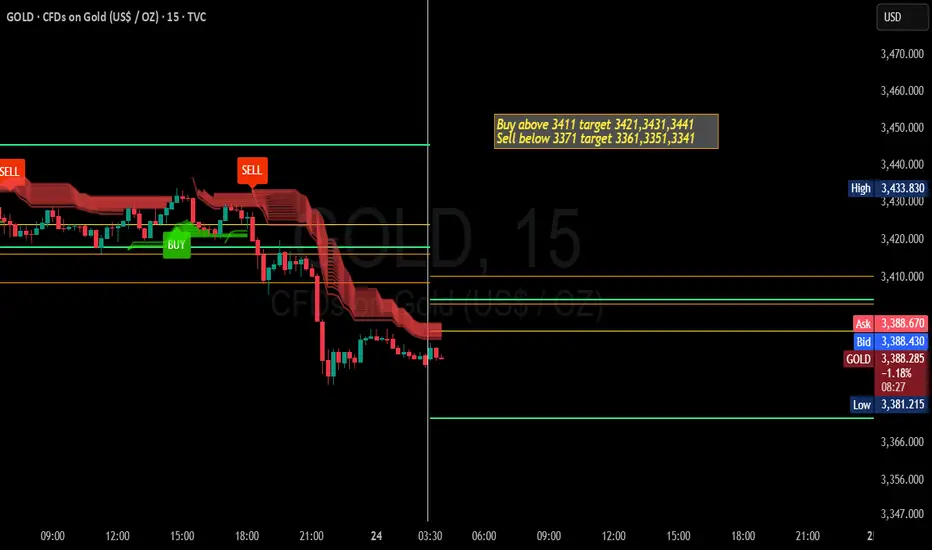
Gold Trading Strategy for 24th July 2025🟡 GOLD TRADING
Timeframe: 🕐 1-Hour Candle
Strategy: Breakout Method (Buy above High / Sell below Low)
✅ BUY SETUP – LONG TRADE
📌 Condition to Buy:
Wait for a 1-hour candle to close above $3411.
Then, Buy above the high of that candle.
📍 Example:
A 1-hour candle closes at $3412
The high of that candle is $3415
Your Buy Entry = $3415.10 (just above the high)
🎯 Target Levels:
Target 1: $3421
Target 2: $3431
Target 3: $3441
🛡️ Stop Loss: Below the low of the breakout candle (e.g., $3405)
🟢 Reason to Buy:
A close above $3411 followed by a breakout of the high suggests bullish momentum.
🔻 SELL SETUP – SHORT TRADE
📌 Condition to Sell:
Wait for a 1-hour candle to close below $3371.
Then, Sell below the low of that candle.
📍 Example:
A 1-hour candle closes at $3370
The low of that candle is $3368
Your Sell Entry = $3367.90 (just below the low)
🎯 Target Levels:
Target 1: $3361
Target 2: $3351
Target 3: $3341
🛡️ Stop Loss: Above the high of the breakdown candle (e.g., $3376)
🔴 Reason to Sell:
A close below $3371 followed by a breakdown of the low suggests bearish pressure.
📘 TIPS
🧠 Don’t enter early – wait for the candle to close above/below the level
🎯 Set alerts at the entry points or use pending orders
📉 Always use a stop loss – never trade without it
💰 Risk only 1–2% of your capital per trade
🕒 Avoid trading during news events – use an economic calendar
📊 Practice first on a demo account if you’re new to trading
⚠️ DISCLAIMER
💬 This trading idea is shared for educational purposes only. Trading gold or any financial instrument carries risk of capital loss. Please do your own analysis or consult a certified financial advisor before entering trades. We are not responsible for any financial gains or losses that may result from your decisions.
XAUUSD (Gold) Short term bearish biasLooking at a short term bearish side trade on XAUUSD, to take down the level after a continuous long rally from yesterday.

XAUUSD GOLD Analysis on(23/07/2025)#XAUUSD UPDATEDE
Current price - 3385
If price stay above 3370 then next target 3405,3425,3450 and below that 3350
Plan;If price break 3385-3380 area,and stay above 3387,we will place buy order in gold with target of 3405,3425,3450 & stop loss should be placed at 3370

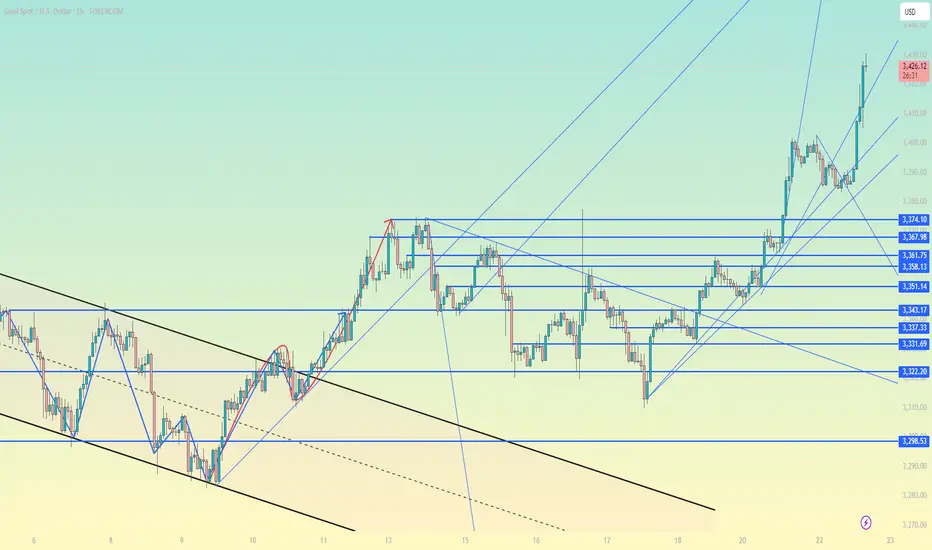
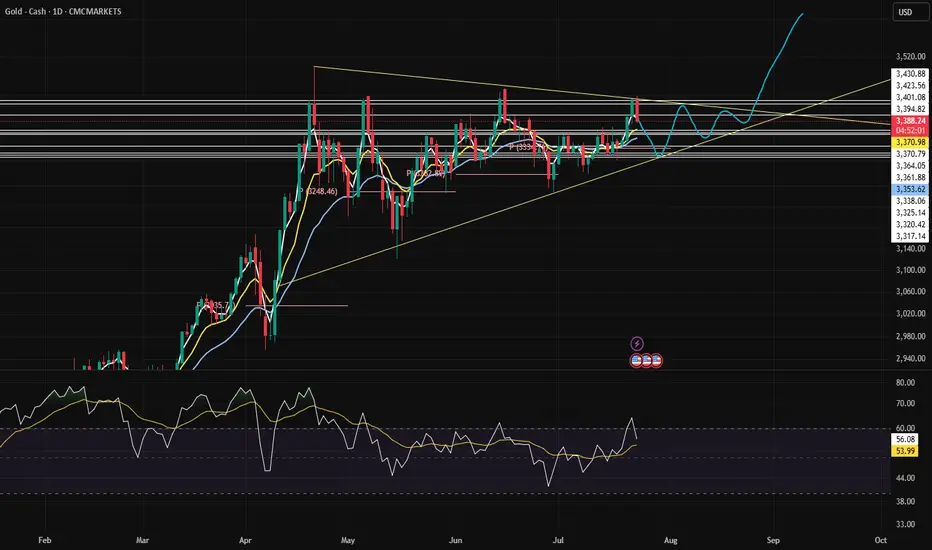
Gold Price Forecast: Watching for a Breakout from the Triangle PDate: July 23, 2025
Instrument: Gold (XAU/USD)
Chart Type: Daily (1D)
Source: TradingView
The price of gold is currently consolidating within a symmetrical triangle pattern, suggesting a potential breakout in the coming weeks. As of July 23, gold is trading around $3,390, down by 1.21% on the day. The chart highlights key support and resistance levels, trendlines, and a possible breakout path, providing valuable insight into future price action.
Technical Overview
Pattern Forming: A symmetrical triangle formed since early April, with higher lows and lower highs converging toward an apex.
Support Levels: $3,371.36, $3,370.79, and the lower ascending trendline.
Resistance Levels: $3,395.78, $3,401.08, and the horizontal zone near $3,430.88.
Indicators:
Moving Averages (likely EMA or SMA): Price is interacting with short- and mid-term MAs.
RSI (Relative Strength Index): Currently around 56, indicating bullish momentum without being overbought.
Forecast and Price Path
The chart includes a forecasted price path (in blue) that outlines a possible movement:
A short-term dip to retest the triangle’s lower support area near $3,370.
A bounce followed by sideways consolidation within the triangle.
A bullish breakout projected around early August.
A sharp upward trajectory targeting levels above $3,500, suggesting a strong bullish continuation if the breakout occurs as expected.
Conclusion
This symmetrical triangle is a classic continuation pattern, and given the overall bullish trend from earlier this year, the market may lean toward a breakout to the upside. However, confirmation is crucial: a strong daily close above $3,430 would validate the bullish breakout, while a drop below $3,370 could invalidate this scenario and hint at further consolidation or a downside move.
Traders should watch for volume spikes and RSI behavior near the triangle's apex for clearer breakout signals. Until then, gold remains in a tightening range—preparing for its next major move.
XAUUSD GOLD Analysis on(23/07/2025)#XAUUSD UPDATEDE
Current price - 3422
If price stay below 3435, then next target 3403,3390 and above that 3450
Plan;If price break 3422-3428 area,and stay below 3422,we will place sell order in gold with target of 3403 and 3390 & stop loss should be placed at 3435

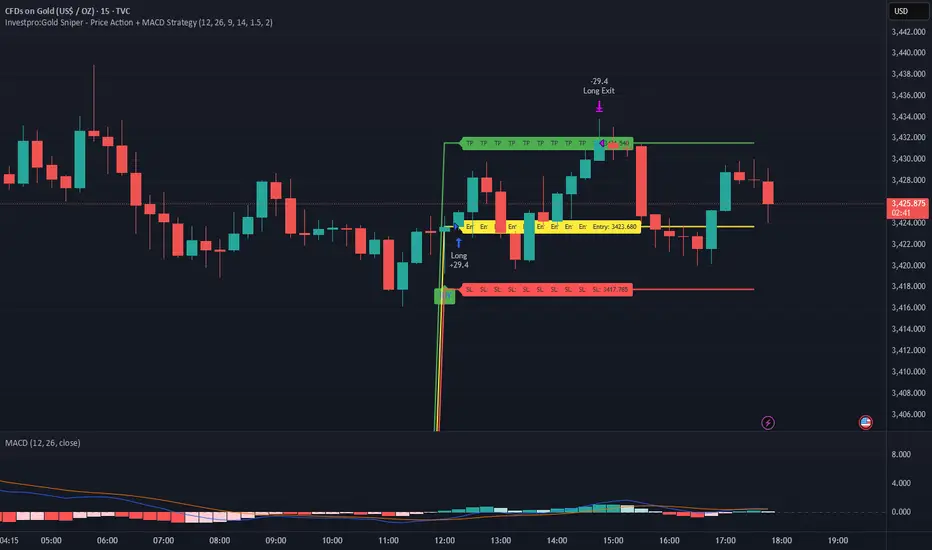
Perfect Short Setup Nailed – Again | 828 Pips Profit in XAUUSDHello Traders,
We’ve crafted a high-probability trading strategy designed specifically for XAUUSD. With over 65% accuracy and a 1:1.33 risk-reward ratio, Gold Sniper delivers reliable signals that traders can trust.
Our latest signal alone secured a profit of 828 pips.
📈 Ready to level up your trades?
DM now to get access and start using Gold Sniper on your charts.
To motivate us, Please like the idea If you agree with the analysis.
Happy Trading!
InvestPro India


Introducing the Gold Sniper Strategy | Your Edge in the MarketHello Traders,
We’ve crafted a high-probability trading strategy designed specifically for XAUUSD. With over 65% accuracy and a 1:1.33 risk-reward ratio, Gold Sniper delivers reliable signals that traders can trust.
Our latest signal alone secured a profit of 786 pips.
📈 Ready to level up your trades?
DM now to get access and start using Gold Sniper on your charts.
To motivate us, Please like the idea If you agree with the analysis.
Happy Trading!
InvestPro India
XAUUSD – When Buying Pressure FadesGold attempted to break above a key resistance zone but quickly lost momentum, signaling that bullish strength is weakening. Meanwhile, strong U.S. economic data continues to support the dollar: the labor market remains robust and manufacturing activity is expanding — giving the Fed more reason to keep interest rates high for longer. This has put downward pressure on gold.
Currently, the market is approaching a critical support area. If this zone breaks, the bearish trend could accelerate further. Price structure no longer shows clear bullish momentum, and any pullbacks appear to be merely technical corrections.
Given this outlook, I favor a SELL setup if price breaks below support. The downside could expand significantly if buyers fail to return. Gold is now standing on the edge — either it holds the range, or a sharp drop may follow.

Live Test : XAUUSD - TP Hit - 15/7/25Entry planned after 15 min candle gave fake out near resistance
Anticipated wick fill - sells taken

Live test : XAUUSD - TP hit - 18/07/25Entered during Pre-london session
anticipated up move for 20-30 pips because candle flipped from red to green

Live : XAUUSD : TP Hit - 23/07Breakout entry taken during London session
Trailing sl hit
secured 50% profit
Happy Trading .! 🙂

Elliott Wave Analysis – XAUUSD July 23, 2025
________________________________________
🔍 Momentum Analysis:
• D1 Timeframe: Daily momentum is showing signs of a potential bearish reversal. We need to wait for today’s daily candle to close to confirm this. It signals that the bullish momentum is weakening.
• H4 Timeframe: Momentum is turning down. It may take around 2 more bearish H4 candles to push momentum into the oversold zone → suggesting continued downside movement today.
• H1 Timeframe: Momentum is already in the oversold zone and the indicators are “clinging” together → implying possible continued minor declines or sideways movement.
________________________________________
🌀 Elliott Wave Structure Update:
• On the H1 chart, a 5-wave structure (yellow) is unfolding.
o Wave 3 (yellow) appears completed, supported by a clear 5-wave internal structure in blue.
o The market is currently in Wave 4 (yellow) – a corrective move.
🔸 Potential Wave 4 (yellow) targets:
• Target zone 1: Around 3412
• Target zone 2: Around 3402
📌 Once Wave 4 (yellow) completes, we anticipate the market will form Wave 5 (yellow).
🔸 Projected Wave 5 (yellow) targets:
• TP1: 3461
• TP2: 3492 (in case of an extension)
________________________________________
🔄 Combining Momentum & Wave Structure:
• The potential bearish reversal in D1 momentum suggests the current bullish trend may be nearing its end – consistent with Wave 5 being the final push before a broader correction.
• H4 and H1 momentum support the ongoing correction in Wave 4.
✅ Wave 4 typically takes the form of a zigzag, flat, or triangle → Wait for a strong bullish H1 candle to confirm the end of Wave 4 and initiate a buy entry.
________________________________________
📊 Trade Plan:
🟩 Buy Zone 1:
• BUY ZONE: 3414 – 3412
• SL: 3407
• TP1: 3439
• TP2: 3461
• TP3: 3492
🟩 Buy Zone 2:
• BUY ZONE: 3403 – 3401
• SL: 3393
• TP1: 3439
• TP2: 3461
• TP3: 3492

XAU/USDXAU/USD presents a promising intraday trade setup with a well-defined entry, stop-loss, and exit level. The entry is placed at 3428, targeting an downside move toward 3390, with a protective stop-loss at 3434 to limit downside risk. This setup offers a favorable risk-to-reward ratio, aligning with disciplined trading principles.
Gold remains supported by global uncertainties and a softer dollar, and the price action near 3428 suggests a potential bounce from minor support, confirmed by bullish momentum on lower timeframes. The stop-loss at 3434 is strategically placed below the immediate support zone to avoid getting caught in minor noise, while protecting capital if the trend reverses.
The target at 3390 corresponds with the next resistance zone and a recent swing high, making it a realistic and technically sound exit. Traders should monitor key economic releases during the session, such as US PMI or Fed commentary, as they can trigger volatility in gold.
Stick to the plan: enter at 3428when price confirms, use the stop-loss at 3434 to cap risk, and exit at 3390 to lock in profits. Avoid chasing moves and ensure proper position sizing to maintain risk discipline on this XAU/USD trade.

Gold Trading Strategy for 23rd July 2025🟡 GOLD Trading Plan
✅ Buy Setup (Breakout Upwards)
Condition to Enter Buy:
→ Wait for the 1-hour candle to close, and if the high of that candle is above $3,446,
→ Then place a buy order above that high (i.e., buy if price breaks above the candle’s high).
Entry Example:
If the 1-hour candle has a high of $3,448, place a buy stop order at $3,449.
Targets:
🎯 Target 1: $3,460
🎯 Target 2: $3,475
🎯 Target 3: $3,490
Stop Loss (Risk Management):
→ Place a stop-loss below the low of that 1-hour candle (to minimize risk).
❌ Sell Setup (Breakdown Downwards)
Condition to Enter Sell:
→ Wait for the 1-hour candle to close, and if the low of that candle is below $3,408,
→ Then place a sell order below that low (i.e., sell if price breaks below the candle’s low).
Entry Example:
If the 1-hour candle has a low of $3,406, place a sell stop order at $3,405.
Targets:
🎯 Target 1: $3,395
🎯 Target 2: $3,383
🎯 Target 3: $3,371
Stop Loss:
→ Place a stop-loss above the high of that 1-hour candle.
📝 Step-by-Step Instructions (For Beginners)
Open your chart on TradingView or any trading platform.
Select the 1-hour timeframe.
Wait for a full candle to complete.
Check the high and low of the closed candle:
If the high > $3,446, prepare a buy above that high.
If the low < $3,408, prepare a sell below that low.
Set the correct entry, stop-loss, and targets as explained.
Use a risk-to-reward ratio of at least 1:2.
Avoid trading during major news events for safer execution.
⚠️ Disclaimer
This strategy is for educational purposes only and not financial advice. Trading gold or any financial instrument involves high risk, and you can lose money. Always use proper risk management, and never trade with money you can’t afford to lose. Past performance does not guarantee future results.

GIf the ascending triangle is broken, $GOLD will blast upside! Gold Price Alert: Ascending triangle breakout near $3450 if sustained for one day. Potential targets at $3663, $3800, $ 3900 on the cards.

Gold Trading Strategy | July 22-23✅As anticipated in our morning analysis, Gold prices pulled back during the Asian and European sessions, precisely touching the key support zone around 3385. In the U.S. session, futures prices once again drove a strong rally, pushing gold through the 3400–3402 resistance zone and reaching the measured move target after the breakout. The bullish trend remains intact, and our strategy of buying on pullbacks has once again proven effective.
✅Key Technical Levels:
🔴Resistance:
🔸3445–3450: Key resistance zone for swing trades and the primary upside target;
🔸3430: Intraday one-ATR projection level and previous daily closing high;
🟢Support:
🔹3420: Short-term support level; if the price holds above, further upside is likely;
🔹3402–3405: Key support zone and critical stop-loss area for breakout long positions;
🔹3383–3385: Critical support zone and today's low;
🔹3371–3375: Previous resistance turned support; if broken, the bullish structure needs reassessment.
✅Trading strategy reference:
🔰The overall trend remains strongly bullish, with buying on dips as the primary strategy.
🔰Shorting is only suitable for experienced traders and should be approached with caution and tight risk control.
🔰If gold pulls back but holds above 3405, buying opportunities remain valid;
🔰If the price reaches the 3445–3450 zone and shows signs of exhaustion or bearish reversal, consider reducing long exposure or testing shorts with strict stop-losses.
🔥Trading Reminder: Trading strategies are time-sensitive, and market conditions can change rapidly. Please adjust your trading plan based on real-time market conditions. If you have any questions or need one-on-one guidance, feel free to contact me🤝

Update gold 23/7My gold trading plan, target is 3498 But before reaching that point, I will sell and wait to collect at lower price.

Gold technical analysis and operation strategyGold technical analysis and operation strategy
Market review and current trend
Gold fell from $3402 as expected in the morning trading today. After the price rose in resonance in the evening, it chased more again at 3397.8. The current gold price has broken through the short-term acceleration line. The key resistance above is at $3420 (the pressure of the convergent triangle trend line). If it is touched for the first time, you can try shorting. The support below focuses on 3400-3405. After stabilization, it is still bullish. Breaking through 3420 is expected to challenge the previous high of 3452.
Key driving factors of fundamentals
Fed policy expectations: The market focuses on the speech of Fed Chairman Powell at 20:30 tonight. If he releases dovish signals (such as hinting at a rate cut), it may boost gold; if he maintains a hawkish stance, gold prices may be under pressure by 37.
Geopolitical and trade risks:
The escalation of the conflict between Russia and Ukraine has boosted safe-haven demand, and gold open interest has surged by 23%5.
As trade frictions between Europe and the United States intensify, the EU may impose retaliatory tariffs of $72 billion on the United States, exacerbating market volatility6.
US dollar and US Treasury yields: The US dollar index fell below 98, and the 10-year US Treasury yield fell back below 2%, reducing the cost of holding gold and supporting the gold price of 610.
Key points of technical analysis
Support level:
3400-3405 (short-term long-short watershed)
3385 (today's low, key defensive position)
3360-3350 (daily moving average support) 18
Resistance level:
3420 (convergent triangle upper track, short short for the first time)
3452 (previous high pressure, may accelerate upward after breaking through) 10
Operation strategy
Short-term short order: first touch 3430 light position short, stop loss 3438, target 3415-3410.
Pullback long: 3410-3405 stabilizes and then long, stop loss 3395, target 3430, break to see 3430-3452.
Breakout strategy: If it stands firm at 3420, you can follow up with long orders, with the target being 810 above 3450.
Risk warning
Powell's speech may cause violent fluctuations. It is recommended to control positions and avoid heavy positions in the data market.
If it falls below 3385, the short-term bullish structure may be destroyed, and we need to be vigilant about further corrections to 3360-3350.