GOLD PLAN 21/07 – START OF THE WEEK FACES STRONG RESISTANCE GOLD PLAN 21/07 – START OF THE WEEK FACES STRONG RESISTANCE – WAIT FOR CONFIRMATION!
Market Overview:
Gold rebounded swiftly after a minor correction late last week, mainly fueled by ongoing geopolitical tensions. While there are no major economic events scheduled this week, macro headlines and global conflicts will likely drive volatility and direction for gold prices in the coming sessions.
Technical Outlook:
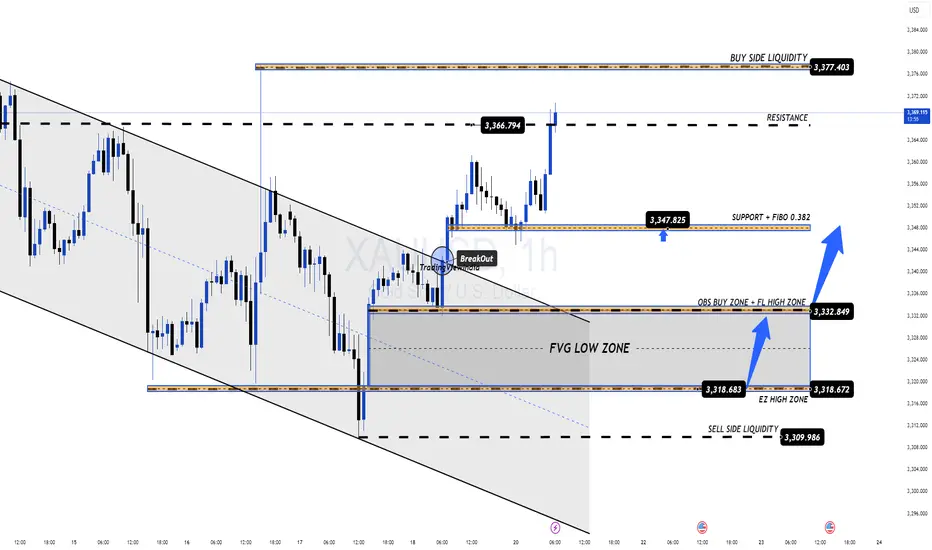
Price is quickly approaching a key resistance zone and may retest the Buy Side Liquidity area around 3377 – 3380.
A short-term reaction from sellers is possible, aiming to fill the Fair Value Gaps (FVG) below.
⚠️ Selling at current levels carries higher risk unless clear reversal signals appear. Patience is key!
Trading Plan for Today:
🔹 BUY ZONE: 3331 – 3329
SL: 3325
TP Targets:
3335 – 3340 – 3344 – 3348 – 3352 – 3358 – 3364 – 3370
🔹 SELL ZONE (risky – confirmation needed): 3377 – 3379
SL: 3383
TP Targets:
3372 – 3368 – 3364 – 3360 – 3350
Key Notes:
The 3347 zone currently acts as short-term support for bulls. If this breaks, gold may slide back to fill lower FVG zones.
Watch closely for volume activity during the London session to confirm intraday bias.
Always respect your SL/TP levels to protect your capital, especially early in the week when volatility can spike unpredictably.
💬 Stay patient, trust the structure, and let price come to your zones. Trading is a game of waiting, not chasing!
Good luck, traders!
CFDGOLD trade ideas
Elliott Wave Analysis – XAUUSD | July 21, 2025🔍 Momentum Analysis
- D1 Timeframe: Momentum is currently rising → the dominant trend over the next 3 days is likely to remain bullish.
- H4 Timeframe: Momentum is approaching the oversold area → just one more bearish H4 candle could complete the entry into oversold territory.
- H1 Timeframe: Momentum is about to reverse downward → suggesting a short-term corrective pullback in the current session.
🌀 Elliott Wave Structure Update
On the H4 chart, price continues to consolidate within a corrective triangle structure. According to our previous plan, price approached the 3358 zone, and we expect:
- Wave 1 (black) may have completed at the 3358 high.
- Currently, Wave 2 (black) is likely unfolding:
+ Wave A appears to have completed.
+ The current upward leg is part of Wave B.
+ A final drop in Wave C is expected, with two key target zones:
- Target 1: 3342
- Target 2: 3332
🔎 Combining Momentum & Wave Structure
- If price breaks above 3358, we want to see a sharp, impulsive, and steep rally to confirm the beginning of Wave 3.
- If price movement remains choppy or overlapping, the market is likely still in a corrective phase.
- Key resistance zone to monitor: 3390–3402 – a clean breakout above this range would significantly strengthen the Wave 3 scenario.
📌 Trade Plan
1️⃣ BUY Setup #1
Entry Zone: 3343 – 3341
Stop Loss: 3337
Take Profit 1: 3358
Take Profit 2: 3390
2️⃣ BUY Setup #2
Entry Zone: 3333 – 3331
Stop Loss: 3323
Take Profit 1: 3358
Take Profit 2: 3390
📎 Note: Prioritize entries that come with clear confirmation signals from price action and momentum. Avoid buying during choppy or indecisive market conditions.

XAUUSD - ASCENDING TRIANGLE BREAKOUT POSSIBLEXAUUSD - BULLISH BREAKOUTS
We can see a good momentum above the marked levels with a possible breakout of Ascending triangle pattern.
Wait for a candle CLOSE above the marked levels i.e. 3368-3369.
Expected targets can be 100$ from the marked levels or more can be captured by trailing SL.
Stoploss could be placed at 3268.
1st Target - $3468
2nd Target - $3500
3rd Target - $3568
Please consult your advisor before taking any trade.
#swingtrade
#xauusd
#technicals

Gold price increased, broke 3360Plan XAU day: 21 July 2025
Related Information:!!!
Gold prices (XAU/USD) are extending their upward momentum for the second consecutive session on Monday, as buyers remain cautiously optimistic and await a decisive breakout above a multi-week trading range before committing to further gains. The US Dollar (USD) begins the new week on a softer footing amid mixed signals regarding the Federal Reserve’s (Fed) interest rate outlook—an important factor currently supporting the precious metal.
Additionally, persistent concerns over the potential economic consequences of former President Donald Trump’s unpredictable trade policies are bolstering gold’s appeal as a safe-haven asset.
personal opinion:!!!
Short term H1 frame, gold price breaks 3360 forming bullish structure. Uptrend continues to maintain
Important price zone to consider : !!!
resistance zone point: 3377 zone
Sustainable trading to beat the market

Long XAU/USD when the geopolitical context is complexUS President threatens to fire FED chairman and Russia-Ukr war could push gold price back to old peak 3450 - 3480

XAUUSD – Breakout or Continued Accumulation?Gold continues to respect a solid bullish structure within an ascending price channel. After a healthy pullback from recent highs, the price has retested a key technical support area and is showing signs of a strong rebound.
Current price action reveals that the market is respecting both the FVG zone and the rising support line—clear signals that smart money is still leaning toward the buy side. The next bullish targets lie around the upper resistance zone.
From a macro perspective, weaker-than-expected U.S. retail sales have placed downward pressure on the dollar, fueling speculation that the Fed may soon pivot toward easing. This adds momentum to gold’s upside potential.

Gold Prices Rise Amidst USD WeaknessAmong precious metals, prices are increasing due to the weakening of the USD. There are no negative scenarios for gold in the medium term, considering the current developments: US government spending is out of control, ongoing trade tensions, uncertain inflation, and increasing criticism aimed at the Fed.
As of the time of writing, gold has risen by 0.3% in the past 24 hours, equivalent to an increase of 100 pips, currently trading at 3,350 USD.
The current environment is highly favorable for gold, especially as investors lose confidence in the stability of US monetary policy. If the Fed begins to concede to political pressure, gold prices could break previous highs and head toward 3,440 USD/ounce in the short term.
Do you agree with this view?

XAU/USDGold (XAU/USD) is a popular trading pair due to its liquidity and safe-haven appeal. A good entry in XAU/USD begins with proper analysis. First, identify the overall trend on the daily or 15-mint chart. If the trend is bullish, wait for a price pullback to a key support level
For example, if gold has been trending up and pulls back to $ 3346while RSI dips below 30, you can plan an entry around $ 3350–$ 3343 with a stop-loss below recent swing low Set a target near resistance, like $3403.
Alternatively, if the trend is bearish,
Always trade with risk management — never risk more than 1–2% of your account per trade. Combining price action, trend confirmation, and momentum indicators improves your chances of a successful entry. Patience and discipline are key when trading XAU/USD.

Gold Trading Strategy for 21st July 2025 🌟 GOLD INTRADAY TRADING PLAN (1-HOUR CANDLE STRATEGY)
(Ideal for beginner traders – Easy to follow)
🟢 BUY TRADE – When to Enter a Long Position?
🕒 Step 1:
Watch the 1-hour candle on the chart. Wait patiently.
📈 Buy only if a full 1-hour candle closes above ₹3366.
🔍 This means the candle opens, moves up, and finishes (closes) above 3366 — not just a spike or a shadow.
🎯 Profit Targets:
✅ Target 1: ₹3375
✅ Target 2: ₹3387
✅ Target 3: ₹3401
🛡️ Suggested Stop Loss: ₹3355
This is to protect yourself if the trade moves against you.
🔻 SELL TRADE – When to Enter a Short Position?
🕒 Step 1:
Watch the same 1-hour candle closely.
📉 Sell only if a full 1-hour candle closes below ₹3330.
🔍 The candle must finish below 3330 — not just touch it during the hour.
🎯 Profit Targets:
✅ Target 1: ₹3315
✅ Target 2: ₹3300
✅ Target 3: ₹3290
🛡️ Suggested Stop Loss: ₹3340
To limit loss in case the market reverses.
🧠 Beginner Tips:
✅ Don’t Rush: Wait for the candle to fully close above or below the trigger level before you enter a trade.
✅ Use Limit Order or Market Order wisely after confirmation.
✅ Stick to 1–2 trades per day. Overtrading can lead to losses.
✅ Use proper lot size based on your capital – never risk more than 1–2% of your money on a single trade.
✅ Check gold-related news and global sentiment before the market opens.
📜 DISCLAIMER (Read Carefully):
⚠️ This strategy is shared for educational and informational purposes only.
It is not a recommendation to buy or sell any financial instrument.
All trading involves risk, and past performance does not guarantee future results.
📌 Always consult your financial advisor before making trading decisions.
📉 You are responsible for your own trading actions.
Gold Trading Strategy For Next Week✅ Gold exhibited an irregular box-range consolidation this week, with frequent directional shifts and weak trend continuity. The price tested the 3375 level twice but failed to break through effectively, followed by significant pullbacks each time—indicating clear selling pressure around that area. On the technical side, the Bollinger Bands on both the daily and 4-hour charts have contracted simultaneously, suggesting that gold is currently in a consolidation phase, awaiting a breakout to define the next direction. Overall, gold remains trapped within a broad range, with neither the upside nor downside achieving a decisive breakout. Whether the range will be broken—and in which direction—will likely be determined next week.
✅ On Friday, gold mainly trended higher within a narrow range, in line with previous expectations. During the session, we initiated a short position around 3341–3343, took profit near 3333, and subsequently shifted to a long bias. Gold then climbed to around 3361 before entering a sideways consolidation phase, closing the day near 3350. In the absence of major geopolitical news over the weekend, the bullish momentum is expected to continue into next week.
✅ From a technical perspective, the 4-hour moving average system shows a bullish divergence pattern, supporting the current upward trend. Combined with the continuation of the overnight rebound momentum, gold may target the 3380 level in the coming week. The MACD fast line is turning upward near the high zone and may soon form another bullish crossover. Meanwhile, the shrinking green histogram bars suggest that positive momentum could emerge soon. The KDJ indicator still has room to rise before reaching the overbought zone.
✅ Key short-term support levels lie at 3345 and 3340. As long as this zone holds, it can be considered a valid entry point for long positions. On the upside, attention should be paid to the 3375–3380 resistance range, which aligns with previous highs. A successful breakout above this zone could pave the way for further upside potential.
🔴 Key resistance zone: 3375–3380
🟢 Key support zone: 3340–3345
✅ If the 3340 support holds, consider entering long positions on dips, with a target near 3380. If prices approach 3380 and show signs of losing momentum—such as divergence in indicators—it may be appropriate to consider shorting near the top, and then reassess after a pullback toward support.

Good buy above 3360 sell below 3330 on sustaining basisHow My Harmonic pattern projection Indicator work is explained below :
Recent High or Low :
D-0% is our recent low or high
Profit booking zone: D13% -D15% is
range if break them profit booking start on uptrend or downtrend but only profit booking, trend not changed
SL reversal zone : SL 23% and SL 25% is reversal zone if break then trend reverse and we can take reverse trade
Target : T1, T2, T3, T4 and .
Are our Target zone

GOLD WEEKLY OUTLOOK | JULY 21–25 GOLD WEEKLY OUTLOOK | JULY 21–25
Get Ready for a New Trading Week 🇮🇳
🔍 Market Recap:
Gold showed a strong bullish reversal late last week after sweeping liquidity around the FVG ZONE near 3310. Price quickly surged toward the OBS SELL ZONE around 335x–336x.
By Friday’s close, however, price reacted sharply to a confluence of technical zones (OBS + FIBO) and settled below the VPOC, hinting at a potential short-term top.
📉 Outlook for July 21–25:
📌 No major economic events are lined up next week.
⚠️ However, geopolitical tensions, global trade policies, and military news could bring sudden volatility.
Stay alert for unexpected liquidity spikes!
🧠 Technical Setup – H1 Mid-Term View:
Gold has been forming multiple Fair Value Gaps (FVGs) due to aggressive bullish moves.
While price has reached new highs, lower FVG zones remain unfilled – creating a strong possibility of a retracement.
🔁 Expected Scenario:
We may see price retrace to the 3310–3305 zone to fill these gaps, then potentially resume bullish movement.
📍 Trading Strategy for the Week:
🔸 Wait for price to enter lower FVG zones
🔸 Look for early BUY signals at key confluence areas such as:
CP zones
Fibonacci retracement levels
Volume/price reaction levels
🎯 Bullish Target Zones:
Primary target remains: 333x – 336x
If momentum continues after the pullback, we could see a move toward the Buy Side Liquidity near 3371.749
✅ Key Reminders for Indian Traders:
🚫 Avoid emotional buying at highs (no FOMO!)
📏 Stick to your TP/SL rules – risk management is critical, especially during uncertain global headlines
📊 Stay focused and trade with a plan
🌟 Wishing you a restful weekend. Come back refreshed and ready to dominate the charts next week!
🚀 Good luck & happy trading

Gold (XAU/USD) – Symmetrical Triangle Formation Near Breakout ZGold is currently consolidating within a well-defined symmetrical triangle pattern on the 4-hour chart, indicating a potential breakout scenario in the near term.
Resistance Levels:
🔺 $3,350 – Immediate resistance
🔺 $3,451 – Key historical resistance
Support Levels:
🟢 $3,245 – Strong horizontal support
🟢 Rising trendline – Dynamic support
Technical Indicators:
📉 Price is hovering around the 50-period EMA (currently at $3,338), suggesting indecision.
📊 RSI at 51.24 reflects a neutral momentum, awaiting confirmation.
Key Insight:
The price is nearing the apex of the triangle, where a breakout or breakdown is likely imminent. A decisive move above resistance may trigger bullish continuation, while a drop below the rising support could open the door to further downside.
Watch for:
✅ Break and close above $3,350 (bullish confirmation)
❌ Breakdown below $3,245 (bearish confirmation)

XAUUSD: breakout risk is approachingXAUUSD has been consolidating in a tight range since early July. Despite multiple bounces from support, price has failed to deliver a clear breakout, signaling weakening buying pressure. The current structure leans bearish, with momentum turning increasingly negative.
On the news front, the U.S. economy continues to show strong recovery: rising consumer demand, falling unemployment, and surging USD and bond yields. This puts significant pressure on gold – a non-yielding asset in a high-interest environment.
If price breaks below the bottom of the range, the downside could accelerate sharply in the near term. Buyers should remain extremely cautious in this setup.

Gold wavers under pressure from strong U.S. retail dataXAUUSD is currently fluctuating within a price box, showing weaker bullish attempts and failing to break above the nearest resistance zone. Selling pressure is mounting as price continues to be rejected at the top and is approaching the medium-term ascending trendline — a key support level.
On the news front, U.S. core retail sales surged, boosting expectations for a stronger USD, which in turn weighs on gold prices. However, a slight uptick in unemployment claims may help slow the dollar’s momentum.
If buyers fail to defend this critical support, the bullish structure risks being broken, potentially signaling a shift toward a clearer downtrend. On the flip side, the price box could still act as a consolidation phase before another bullish leg.

XAUUSD 1H – Watching for a Bounce Inside the ChannelGold is still moving nicely inside this big ascending channel. After hitting resistance, price is pulling back toward the lower support area and trendline.
👉 My Plan:
Waiting to see if price holds around $3,310–$3,320 zone.
If we get bullish signs (strong candle, rejection wick), I’ll look for longs back up toward $3,350–$3,370 and maybe higher.
✅ Key Levels:
Support: $3,310 area
Resistance: $3,345 – $3,370
Break below support could invalidate this idea.
Just being patient and letting price action confirm the next move. Let’s see how it plays out!

XAUUSD – The Bullish Wave Emerges, Target Closer Than Ever!Gold has broken out of its previous descending channel, confirming a trend reversal. Current price action is forming higher lows while consistently filling Fair Value Gaps (FVGs) – a clear sign that institutional money is flowing back in.
The next key target is the previous high near 3,399, where some short-term profit-taking may occur. However, if buyers can defend the support zone around 3,348, the chances of breaking above resistance will increase significantly.
On the news front, the U.S. dollar is weakening as housing and industrial production data show signs of slowing, fueling speculation that the Fed may pause further rate hikes this year.

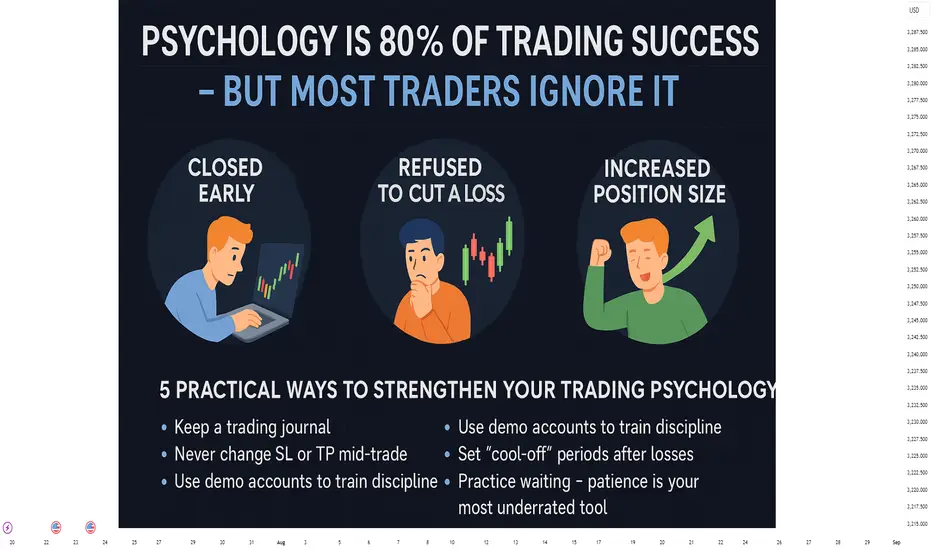
Psychology Is 80% of Trading Success But Most Traders Ignore ItPsychology Is 80% of Trading Success – But Most Traders Ignore It
“Have you ever entered a perfect trade… and still lost?”
Right direction.
Clear technical setup.
Trend confirmation was there.
Yet you closed early.
Or held a losing trade too long.
Or jumped back in out of revenge after a loss.
It wasn’t your system’s fault.
It was your psychology.
💡 Most traders don’t fail because of bad analysis – they fail because of poor emotional control
Let’s walk through some common real-life situations every trader has experienced at least once:
🎯 1. You closed your trade early – afraid the market might reverse
Case study:
A trader entered a long position on XAUUSD at a support zone (2360), aiming for TP at 2375.
But when price reached 2366, he closed out early – afraid to “lose profits.”
The market later hit his original TP perfectly.
➡️ This is classic loss aversion – the fear of losing what you’ve already gained.
🎯 2. You refused to cut a loss – hoping the price would come back
Case study:
A trader shorted EURUSD expecting a pullback, but price broke resistance and continued up.
Instead of cutting the loss, he widened his stop loss, holding onto hope.
The result? A bigger loss than planned.
➡️ This is denial – a refusal to accept you’re wrong, leading to emotional attachment to the trade.
🎯 3. You increased your position size after a winning streak
Case study:
After two strong wins, a trader feels confident and increases position size on the next trade…
Even though the setup isn’t as strong.
That trade ends in a loss – wiping out earlier profits.
➡️ This is overconfidence bias – a dangerous psychological state after wins.
📊 Technical skills only account for 20% – the remaining 80% is mastering yourself
You might:
Understand price structure
Use advanced indicators
Follow a solid trading system
But if you:
Break your stop loss rules
Scale up recklessly
Enter trades impulsively
Then your edge vanishes.
Success becomes inconsistent.
🧠 5 Practical Ways to Strengthen Your Trading Psychology
✅ Keep a trading journal – especially track your emotions
Ask: “Did I follow my plan? Or was I trading to ‘feel better’?”
✅ Never change SL or TP mid-trade
Stick to your original plan. Discipline builds consistency.
✅ Use demo accounts to train discipline, not to prove profitability
Treat each demo trade as if real money is at stake.
✅ Set mandatory “cool-off” periods after consecutive losses
For example: 2 losses = no trades for 24 hours.
✅ Practice waiting – patience is your most underrated tool
Pro traders often wait days for a valid setup. That’s not inactivity – that’s control.
🔁 Trading is not a search for the perfect system – it’s a journey of mastering your own mind
A strategy with only 55% win rate can still be highly profitable
…if paired with discipline, risk management, and emotional control.
But…
A system with 70% accuracy can still blow your account
…if your psychology breaks down under pressure.
🎯 Final Thoughts:
The financial markets reward those who can control themselves – not just those who analyze well.
You don’t need to be smarter than others.
You don’t need to master 10 indicators.
But you must be able to stay calm, act rationally, and follow your rules.
Knowledge lets you see the opportunity – but psychology determines if you survive it.
18/07 Gold Outlook – Final Friday Liquidity Moves Ahead!🟡 Gold Outlook – Final Friday Liquidity Moves Ahead!
Will Gold maintain its bullish pace or face weekend volatility? Stay ahead of the market!Why Gold is Moving – Key Macro Drivers
Gold bounced back sharply after a dip caused by stronger-than-expected US economic data. Here’s what Indian traders need to keep in mind:
📊 Rate cut hopes remain high as US core inflation remains sticky.
💣 Middle East tensions continue, with Israel launching more airstrikes on Syria.
🌐 Trade war risks increase as EU threatens $84B in tariffs on US goods.
🟡 Gold is acting as a safe haven in times of inflation concerns and global uncertainty.
👉 All of these factors support gold’s upside — especially heading into the weekend when low liquidity can cause price swings.
📉 Technical Picture – Zones in Play
Gold reversed from FLZ H2 (3310) — a key liquidity and demand zone. Sellers took profits, triggering a surge in buy volume. The price has since tested the OBS Sell Zone + Continuation Pattern (CP) around 334x with strong resistance.
Today, we expect price to revisit lower liquidity pools on the M30–H2 timeframe before the next breakout.
🧭 Key Levels for Friday – Watch Closely
✅ Buy Zone: 3318 – 3316
SL: 3312
TP Targets: 3322 – 3326 – 3330 – 3335 – 3340 – 3345 – 3350 – 3360
💼 Scalp Buy Zone: 3326 – 3324
SL: 3320
TP: 3330 – 3335 – 3340 – 3345 – 3350 – 3360
⚠️ Sell Zone: 3363 – 3365
SL: 3370
TP: 3360 – 3355 – 3350 – 3346 – 3342 – 3338 – 3335 – 3330
🔔 Important Notes for Indian Traders
Today is Friday, and even though there’s no major economic news, the risk of liquidity sweeps and volatility is high. Protect your capital with solid risk management and stick to your TP/SL strategy.
📌 Plan your entries from strong technical zones and don’t chase price — let the market come to you.

Gold Analysis and Trading Strategy | July 18✅ Gold prices are currently oscillating around the 3355 level. This area coincides with the emotional rebound high seen on Wednesday. The current stagnation between 3355–3358 reflects market hesitation to push prices higher.
✅ As we approach the end of the week, traders are inclined to avoid weekend risk and remain on the sidelines, waiting for a clearer direction next week. Both bulls and bears are cautious, preferring to enter only at price levels offering a favorable risk-reward ratio.
🔴 Breakout Resistance Zone: 3365–3375
A breakout above this level could open the way toward 3390–3400.
🔴 Key Resistance Zone: 3355–3358
This is the high formed by Wednesday's rebound and has repeatedly capped price action during the U.S. session.
🟢 Key Support Level: 3345
This is the critical level for the U.S. session and serves as a pivot between bullish and bearish momentum.
🟢 Secondary Support: 3320–3325
Further downside may test this region if bearish pressure continues.
🟢 Strong Support: 3307–3310
Losing this zone would significantly damage the medium-term bullish structure.
✅ Trading Strategy Reference:
🔰 If gold closes the day above 3345, it suggests that bullish momentum remains intact. Next week, focus will remain on a potential breakout above 3355–3358. A successful break could lead to targets around 3390–3400.
🔰 If price fails to hold above the 3345 key support, it indicates weakening bullish momentum. In that case, the preferred strategy for next week would be to sell on rallies, with 3355–3358 as a key resistance area.
🔥Trading Reminder: Trading strategies are time-sensitive, and market conditions can change rapidly. Please adjust your trading plan based on real-time market conditions. If you have any questions or need one-on-one guidance, feel free to contact me🤝

XAUUSD SELLING PLAN INTRADAYBased on supply and demand marked from M15 Time Frame to 1M Timeframe for entry and exit.
Sell from 3357.300
Stop Loss 3361.600
Target 3339.300

GOLD (XAUUSD) 4H Analysis – Breakout Imminent from Rising Wedge!Gold is currently trading at 3353.39 after completing a well-defined ABCDE rising wedge structure on the 4H chart. The market is showing signs of exhaustion near the 3353–3373 resistance zone, with a potential bearish rejection likely to follow.
🔍 Key Highlights:
Pattern: Rising Wedge (ABCDE complete) – a classic bearish reversal setup.
Sell Zone: 3353.88 to 3371.62 – Expect high volatility and sharp rejection.
Target: 3296.36 – Marked as the first major support zone.
Risk Management: Strong R:R setup with invalidation above 3373.93.
Heikin Ashi candles show weakening bullish momentum near the top.
📉 What to Watch: If price confirms rejection below 3353 with bearish pressure, a sharp fall toward the 3296 level could follow. Breakout traders and swing traders should stay alert – this could be a textbook move.
📌 Professional Insight: This setup is not just a pattern – it's a psychological battlefield between bulls pushing exhaustion and bears waiting to strike. The next few candles could define the mid-term gold trend.
🚨 Don’t miss this potential opportunity. Mark your levels. Stay disciplined.
#GoldAnalysis #XAUUSD #ForexTrading #SwingTrade #TechnicalAnalysis #HeikinAshi #BreakoutSetup #SmartTrading #RiskReward #TradingEdge

XAUUSD SELL IDEAXAUUSD SELL IDEA trend is bearish and we have an supply zone so we can plan for sell to demand zone. Used H4 for trend and H1, M15 & M5 for entry exit zone.
