Gold Trading Strategy for 15th August 2025 (IST)🟡 Gold Trading Plan
📈 Buy Setup – Bullish Breakout Strategy
Entry Condition:
✅ Wait for the 1-hour candle to close above $3348.
✅ Only enter after the candle closes, not just during the spike.
Reasoning:
🔍 A close above $3348 indicates buyers are in control, confirming momentum.
Targets:
🎯 1st Target: $3360 – Quick scalp/profit-taking zone.
🎯 2nd Target: $3372 – Medium-term resistance area.
🎯 3rd Target: $3384 – Strong resistance; watch for reversal signals here.
Stop Loss:
🛑 Place SL below the breakout candle’s low or a safe support zone to reduce risk.
📉 Sell Setup – Bearish Breakdown Strategy
Entry Condition:
✅ Wait for the 15-minute candle to close below $3322.
✅ Avoid entering during a sudden drop without a candle close – prevents false breakdowns.
Reasoning:
🔍 A close below $3322 signals sellers dominating the market, possibly starting a downtrend.
Targets:
🎯 1st Target: $3310 – Short-term support level.
🎯 2nd Target: $3298 – Key intraday demand zone.
🎯 3rd Target: $3285 – Strong support; partial or full profit booking advised.
Stop Loss:
🛑 Place SL above the breakdown candle’s high or a recent swing high.
📌 Risk Management Notes
Use position sizing to keep risk per trade within 1–2% of your capital.
Don’t chase entries – let the candle close confirm the trade.
Book profits gradually; don’t wait for all targets to hit.
⚠️ Disclaimer:
This content is for educational purposes only and does not constitute financial advice. Trading gold, forex, or other financial instruments involves substantial risk and is not suitable for all investors. You may lose more than your initial investment. Always perform your own analysis and consult with a qualified financial advisor before trading.
CFDGOLD trade ideas

XAUUSD GOLD ANALYSIS ON(13/08/2025)#XAUUSD UPDATEDE
Sell Limited (3366 - 3375)
If price stay below 3388, then next target 3345,3320 and 3305 and above that 3410
Plan;If price break 3366-3375 area,and stay below 3365,we will place sell order in gold with target of 3345,3325 and 3305 & stop loss should be placed at 3388

Fed Set to Cut 50bps: Gold Gains as the Bullish Wave Forms Again📌 Macro Overview
US Treasury Secretary Bessent gives the green light for a potential 50-basis-point rate cut by the Fed in September.
July CPI remains soft → USD weakens, bond yields fall, boosting gold’s bullish outlook.
Gold briefly touched $3,370/oz, closing at $3,355.9/oz (+0.24%).
Gains capped as US equities continue to break records and geopolitical tensions ease.
Market focus now shifts to PPI data, jobless claims, and the anticipated Trump–Putin meeting for the next directional cues.
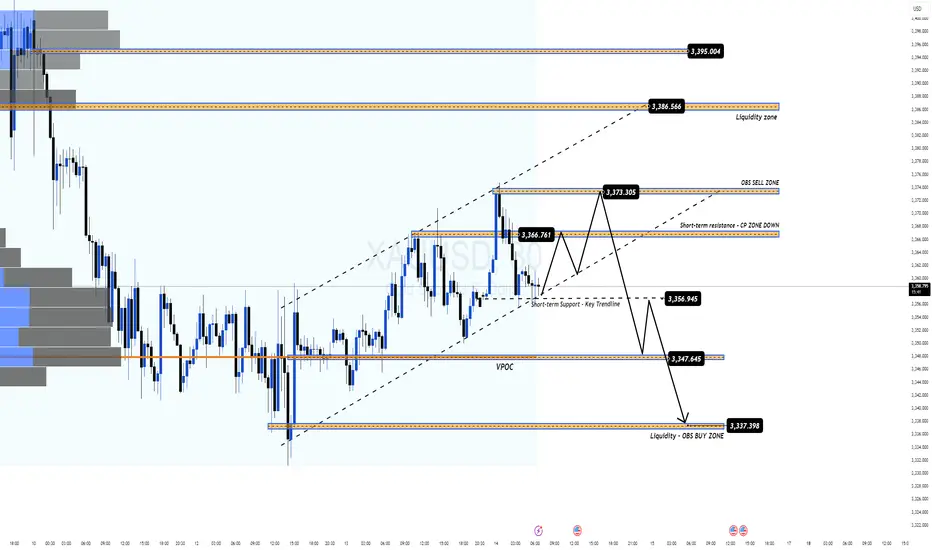
🧐 Technical Outlook – MMFLOW Analysis
The bullish recovery wave is clearly re-emerging after a corrective phase, with price hunting liquidity zones left behind in the recent retracement.
Preferred strategy: Trade around key liquidity levels or continuation zones for SELL opportunities; BUY entries will be taken earlier to catch the recovery wave within the current price channel.
Price Structure & Observation Zones:
Short-term uptrend channel intact, primary support at 3336 – 3334 (Liquidity – OBS BUY Zone).
Major resistance at 3394 – 3396 (Liquidity Grab Zone + H1 Supply).
🎯 MMFLOW Trading Plan
🔹 BUY SCALP – Catch the recovery wave
Entry: 3336 – 3334
SL: 3330
TP: 3340 – 3345 – 3350 – 3355 – 3360 – 3365 – 3370 – 3380 – ???
🔹 SELL SCALP – Counter-trend at resistance
Entry: 3394 – 3396
SL: 3400
TP: 3390 – 3385 – 3380 – 3370 – 3360
📊 Key Levels
Resistance: 3365 – 3370 – 3395
Support: 3340 – 3336 – 3330
💡 MMFLOW Strategy Tip:
Wait for price to retest the 3336 – 3334 BUY ZONE for trend-following BUY positions.
Watch for liquidity absorption signals at 339x – a potential SELL reversal zone.
August 14th Gold AnalysisAugust 14th Gold Analysis
Current Price Dynamics
Spot gold surged and then retreated, hitting a three-day high of $3,375/oz before encountering selling pressure. It is currently trading around $3,345, essentially unchanged from the previous day's closing price. Gold prices are caught in a short-term tug-of-war between bulls and bears: on the one hand, rising global risk sentiment is suppressing safe-haven demand; on the other, growing expectations of a Fed rate cut are providing key support.
I. Analysis of Core Drivers
1. Risk Appetite Suppresses Gold Prices
Optimistic expectations regarding two major geopolitical developments have significantly boosted risk assets:
- Expectations of a three-month extension of the US-China trade truce continue to build;
- The US-Russia summit (August 15th) could potentially help resolve the Russia-Ukraine conflict.
This has pushed the S&P 500 and Nasdaq indices to consecutive record highs, weakening gold's safe-haven appeal.
2. Fed policy expectations dominate bullish sentiment.
- The probability of a September rate cut is approaching 100%: The CME FedWatch tool shows that the market is betting on a 25 basis point rate cut in September, with the possibility of two cumulative rate cuts by the end of the year.
- Policy divergence is intensifying:
- Treasury Secretary Bensont called for a 50 basis point rate cut next month;
- Chicago Fed President Goolsbee expressed concerns about core inflation and hinted against a September action;
- Atlanta Fed President Raphael Bostic acknowledged weak employment but avoided a rate cut stance.
- The US dollar index fell to a two-week low under pressure, while US Treasury yields fell (10-year Treasury yield at 4.23%), further reducing the cost of holding gold.
3. Mixed technical signals:
- Positive signals:
- Successfully holding above the 200-period moving average on the 4-hour chart ($3343-3342);
- Breaking through the $3358-3360 resistance zone confirms a short-term bottoming structure.
- Hidden concerns emerge:
- Hourly and daily oscillators lack upward momentum;
- $3,375 forms a high point of resistance, suppressing any potential rebound.
II. Key Technical Levels and Path Analysis
Key Resistance Areas
1. $3,375 (intraday high) → A breakout would target the psychologically important $3,400 level;
2. $3,409-3,410 (last week's high) → A breakout would open up the intermediate resistance level of $3,422-3,423;
3. $3,434-3,435 → The ultimate target is the historical peak of $3,500.
Core Support Bands
1. $3343-3342 (200-period moving average on the 4-hour chart) → Short-term bullish-bearish watershed;
2. $3331 (this week's low) → A break below could trigger a decline towards $3300;
3. A break below $3300 would reverse the short-term technical structure to bearish.
III. Trading Strategy
Long Opportunity
- Entry Conditions: Gold price stabilizes at $3350 and the hourly MACD shows strong volume;
- Tactical Strategy: Build positions in batches within the 3345-3355 range, with a stop-loss below $3340;
- Target Level: $3375 → $3400 → $3422 (gradually reduce positions).
Short Strategy
- Trigger Scenario: Risk sentiment continues to rise;
- Reverse Signal: If the price falls below $3340, try shorting with a small position, with a stop-loss above $3355;
- Target Range: $3331 → $3310 → $3300.
Breakout Trend Following
- If the price breaks through $3380 on high volume, buy above $3400;
- If the price falls below $3330 with a long bearish trend, follow the trend and place a short position with a target below $3300.
Trade with caution and manage risk! Wish you good luck!

Gold Price Faces Key Resistance — Can Bulls Break $3,440?The XAU/USD (Gold vs. USD) 1-hour chart shows a strong bullish structure within an upward channel, supported by higher highs and a recent ATH (All-Time High) retest.
Resistance Zone: $3,410 – $3,440 is acting as a significant supply area. Price may face selling pressure here.
Support Levels: First support lies near $3,300 (supply zone), followed by the $3,225–$3,250 demand zone.
Trend: The price is respecting the upward trendline, but a break below could trigger a retest of the green supply zone.
Bullish Scenario: A breakout and close above $3,440 could lead to a continuation toward $3,475+.
Bearish Scenario: Rejection from the resistance zone with a break below $3,300 could push price toward the $3,225 support.
Overall, gold is currently in a bullish trend, but needs to overcome the $3,440 barrier for further upside momentum.

Support and ResistancePsychological Factors
Options trading is mentally challenging:
Overconfidence after a win can cause big losses.
Patience is key — many setups fail if entered too early.
Emotional control matters more than strategy.
Pro Tips for Successful Options Trading
Master 2-3 strategies before trying complex ones.
Use paper trading to practice.
Keep an eye on Option Chain data — OI buildup can hint at support/resistance.
Avoid holding long options to expiry unless sure — time decay will hurt.
Final Thoughts
Options trading is like a Swiss Army knife — powerful but dangerous if misused. With the right strategy, discipline, and risk management, traders can profit in any market condition. Whether you’re buying a simple call or building a complex Iron Condor, always remember: the market rewards preparation and patience.

Only one thing that rules the market and it's not LiquidityLiquidity is a very subjective but most of the time a baseless and useless concept because it is everywhere in the market. Also, there is nothing on the charts that tells a trader which liquidity is the price going to take and reverse or not. Even though if it worked 2 years ago, now it doesn't cos of your favourite youtubers and insta guru's that won't stop making videos on it just to make it saturated. There is only one thing that drives the price and it is not liquidity
Elliott Wave Analysis – XAUUSD August 14, 2025Elliott Wave Analysis – XAUUSD August 14, 2025
1. Momentum Analysis
• D1 timeframe: Momentum is showing signs of reversal. Although price may not reverse immediately when the two momentum lines converge, this is a clear signal that the current selling pressure is weakening.
• H4 timeframe: Momentum is declining and has only formed 2 H4 candles since the reversal began. It will likely take another 2–3 H4 candles to enter the oversold zone and potentially reverse upward.
• H1 timeframe: Momentum is also falling, suggesting a likely downward move during the Asian session.
________________________________________
2. Wave Structure
• On H1, price is moving in a choppy manner, indicating a corrective phase that has nearly reached its target.
• However, the D1 momentum preparing to reverse upward creates two possible scenarios:
Scenario 1: D1 momentum reverses upward and confirms → The uptrend could last for 4–5 days, conflicting with the current scenario of a corrective wave B. In this case, we would have an alternative scenario of an initial diagonal wave 1 as shown in the right-hand chart.
Scenario 2: D1 momentum enters the oversold zone and stays there → A strong drop would be needed to confirm that the current price action is wave B.
________________________________________
3. Two Potential Price Scenarios
1. WXY corrective pattern → Target for wave Y is around 3381.
2. Initial diagonal wave 1 → Wave 2 could decline toward 3345 before wave 3 rises again. This scenario currently aligns better with the D1 momentum signal.
________________________________________
Conclusion: At present, there is a conflict between momentum signals and wave structure. Further observation is required to determine a clearer trading plan, so no trade recommendation for today.

next xau moveThe short-term and medium-term forecasts for gold (XAU/USD) suggest a cautiously bullish trend, driven by macroeconomic factors and technical indicators
ONLY FOR PAPER TRADING

XAUUSD consolidates, awaiting a reboundFollowing last night’s US PPI data coming in higher than expected (0.2% vs. 0.0%), XAUUSD faced strong selling pressure as markets priced in expectations that the Fed will keep interest rates higher for longer. This boosted the US Dollar and Treasury yields, pushing gold down to around 3,346 USD.
Technically, price is still moving within a wide sideways range between 3,284 and 3,450 USD, but the short-term trend remains capped by a descending trendline from recent highs. The 3,346 USD zone is acting as a trendline touchpoint, potentially leading to a sideways accumulation around 3,312 – 3,346 before a mild rebound.
If the 3,284 USD support holds, the probability of a technical bounce toward 3,346 – 3,379 USD is high, especially as buyers may use the range’s lower boundary to accumulate positions. Conversely, a break below 3,284 USD could trigger stronger selling pressure toward 3,254 USD.

Gold Trading Strategy XAUUSD August 14, 2025Gold Trading Strategy XAUUSD August 14, 2025:
Gold prices continued to rise in the European session on August 13, 2025 as mild US inflation data raised expectations of a Federal Reserve rate cut in September, while a weaker US dollar also boosted demand for gold.
Fundamental news: The US labor market report earlier this month initially weighed on the greenback, but the latest US CPI data added pressure as it did not show a clear acceleration in inflation due to tariffs in July. The inflation data reinforced the possibility that the Fed will take a more dovish stance in September, which is what the market is expecting.
Technical analysis: After a deep correction to the 3330 area, gold prices showed signs of increasing again. On the H1 frame, an upward price channel has been formed, but the current MA lines are still moving sideways, not showing a clear trend. The 3350 - 3355 area will be the important area to decide whether this uptrend channel can hold or not. RSI on H1 and H4 timeframes has entered the buy zone, this is a very good condition for us to trade. We will trade at the support zones and large liquidity zones of gold prices.
Important price zones today: 3350 - 3355, 3335 - 3340.
Today's trading trend: BUY.
Recommended orders:
Plan 1: BUY XAUUSD zone 3350 - 3352
SL 3347
TP 3355 - 3365 - 3375 - 3390.
Plan 2: BUY XAUUSD zone 3335 - 3337
SL 3332
TP 3340 - 3350 - 3370 - 3390.
Plan 3: SELL XAUUSD zone 3388 - 3390
SL 3393
TP 3385 - 3375 - 3365 - 3355 (small volume).
Wish you a safe, successful and profitable trading day.🥰🥰🥰🥰🥰

Gold Plan 14/08 – Captain VincentGold Plan 14/08 – Captain Vincent ⚓
Background
Yesterday, Gold touched the Sell Scalp zone and cruised smoothly for 220 pips 🎯.
However, it failed to break the previous Buy Zone and is now maintaining a bullish structure on the H1 chart, with higher lows forming.
Today, the market may move slower as traders await the US PPI data , so each entry point must be taken with caution.
Zone 1 – Golden Harbor 🏝️ (Main Buy Zone – SMC Demand)
Entry: 3,334 – 3,332
SL: 3,327
TP: 3,338 → 3,342 → 3,346 → 33xx
Note: This is the main buy zone, aligned with the SMC Demand Zone. Enter only if there’s a clear reversal signal (Pin Bar / Engulfing) on M15/H1.
Zone 2 – Storm Breaker 🌊 (Sell Zone – SMC Supply)
Entry: 3,398 – 3,400
SL: 3,407
TP: 3,394 → 3,390 → 3,386 → 33xx
Note: Strong sell zone. Watch price reaction before entry. Prefer partial profit-taking along the way.
Today’s Scenarios
If price tests Golden Harbor → Wait for pin bar or engulfing, then Buy in line with the uptrend.
If price approaches Storm Breaker → Look for short-term sell setups on reversal signals.
If price stays in the mid-range → Stay on the shore, save energy for the golden moment.
Captain’s Note:
"Today, the golden sea still rides the bullish tide, but the PPI winds may shift without warning. Keep the helm steady, and anchor only at safe harbors." 🏴☠️📈

Retail vs Institutional Trading1. Introduction
In financial markets, traders can be broadly categorized into two groups: retail traders and institutional traders. While both operate in the same markets—stocks, forex, commodities, derivatives, cryptocurrencies—their goals, resources, and impact differ significantly.
Think of it like a chess game:
Retail traders are like passionate hobbyists, playing with personal strategies, smaller capital, and limited tools.
Institutional traders are like grandmasters with advanced chess engines, big teams, and massive resources.
Understanding the differences between these two groups is crucial for anyone involved in trading because:
It helps retail traders set realistic expectations.
It reveals how market moves are often driven by institutional flows.
It allows traders to align their strategies with the "big money" rather than fighting against it.
2. Defining the Players
Retail Traders
Who they are: Individual traders using their own capital to trade.
Examples: You, me, the average person with a brokerage account.
Capital size: Typically from a few hundred to a few hundred thousand dollars.
Trading style: Often short-term speculation, swing trading, or occasional long-term investing.
Motivation: Profit, financial freedom, hobby, or passive income.
Institutional Traders
Who they are: Professional traders working for large organizations, handling pooled funds.
Examples: Hedge funds, mutual funds, pension funds, banks, proprietary trading firms.
Capital size: Millions to billions of dollars.
Trading style: Long-term positions, algorithmic trading, arbitrage, high-frequency trading.
Motivation: Generate consistent returns for clients/investors, maintain market share, and manage risk.
3. Key Differences Between Retail & Institutional Trading
Aspect Retail Trading Institutional Trading
Capital Small, personal funds Huge pooled funds
Execution speed Slower, via broker platforms Ultra-fast, often via direct market access
Tools & technology Basic charting tools, retail brokers Advanced analytics, proprietary algorithms
Market impact Negligible Can move markets significantly
Risk tolerance Usually higher (due to smaller size) Often lower per trade but diversified
Regulations Fewer compliance rules Strict regulatory oversight
Information access Public data, delayed feeds Direct market data, insider networks (legal)
Strategy type Swing/day trading, small-scale strategies Large-scale arbitrage, hedging, portfolio balancing
4. Trading Infrastructure & Technology
Retail
Uses broker platforms like Zerodha, Upstox, Robinhood, E*TRADE.
Relies on charting software (TradingView, MetaTrader).
Order execution passes through multiple intermediaries, adding milliseconds or seconds of delay.
Limited access to Level 2 data and dark pool information.
Institutional
Uses Direct Market Access (DMA), bypassing middlemen.
Employs co-location — placing servers physically close to exchange data centers to reduce latency.
Custom-built AI-driven trading algorithms.
Access to Bloomberg Terminal, Reuters Eikon—costing thousands of dollars a month.
5. Market Impact
Retail Traders’ Impact
Individually, they have minimal effect on price.
Collectively, they can cause temporary market surges—e.g., GameStop 2021 short squeeze.
Often act as liquidity providers for institutional strategies.
Institutional Traders’ Impact
Can move prices by large orders.
Use order slicing (Iceberg Orders) to hide trade size.
Influence market sentiment through research, investment reports, and large portfolio shifts.
6. Trading Strategies
Retail Strategies
Day Trading – Quick in-and-out trades within the same day.
Swing Trading – Holding for days or weeks based on technical setups.
Trend Following – Buying in uptrends, selling in downtrends.
Breakout Trading – Entering when price breaches support/resistance.
Options Trading – Buying calls/puts for leveraged moves.
Copy Trading – Following successful traders’ trades.
Institutional Strategies
Algorithmic Trading – Automated, high-speed trade execution.
Market Making – Providing liquidity by quoting buy and sell prices.
Arbitrage – Exploiting price differences between markets.
Quantitative Strategies – Using statistical models for predictions.
Index Fund Management – Matching market indexes like S&P 500.
Hedging & Risk Management – Using derivatives to protect portfolios.
7. Advantages & Disadvantages
Retail Advantages
Flexibility: No need to report to clients.
Ability to take high-risk/high-reward bets.
Can enter/exit positions quickly due to small size.
Niche opportunities—small-cap stocks, micro trends.
Retail Disadvantages
Lack of insider or early information.
Higher transaction costs (relative to trade size).
Emotional trading—fear & greed affect decisions.
Lower technology access.
Institutional Advantages
Massive capital for diversification.
Best technology, research, and execution speeds.
Influence over market movements.
Access to private deals (private placements, IPO allocations).
Institutional Disadvantages
Large orders can move the market against them.
Regulatory and compliance burden.
Slower decision-making (bureaucracy).
Public scrutiny.
8. Regulatory Environment
Retail Traders:
Must follow general market rules set by SEBI (India), SEC (US), FCA (UK), etc.
Brokers are regulated; traders themselves are less scrutinized unless committing fraud.
Institutional Traders:
Heavily monitored by regulators.
Must follow reporting rules, such as 13F filings in the US.
Must ensure compliance with anti-money laundering (AML) and know-your-customer (KYC) laws.
9. Psychological Factors
Retail
Driven by emotions, social media hype, and news.
Prone to FOMO (Fear of Missing Out) and panic selling.
Often lack structured trading plans.
Institutional
Decisions made by teams, not individuals.
Uses risk-adjusted returns as a guiding principle.
Employs psychologists and behavioral finance experts to reduce bias.
10. Case Studies
GameStop 2021 – Retail Power
Retail traders on Reddit’s WallStreetBets caused a short squeeze.
Institutional short-sellers lost billions.
Showed that coordinated retail action can disrupt markets temporarily.
Flash Crash 2010 – Algorithmic Impact
Institutional algorithmic trading caused rapid market drops and rebounds.
Retail traders were mostly spectators.
Final Thoughts
Retail and institutional traders are two sides of the same market coin.
Retail traders bring diversity and liquidity, while institutional traders bring stability and efficiency—most of the time.
For retail traders, the key is to stop fighting institutional flows and instead follow their footprints. By understanding where big money is moving and aligning with it, retail traders can dramatically improve their odds of success.
In essence:
Institutional traders are the elephants in the market jungle.
Retail traders are the birds — smaller, more agile, able to grab quick opportunities the elephants can’t.
Algorithmic & AI-Powered Trading1. Introduction: The Shift from Manual to Machine
For centuries, trading was purely a human skill — traders watched ticker tapes, read news, and relied on gut instinct. But as markets grew faster and more complex, human reaction time simply couldn’t keep up.
Enter algorithmic trading — a world where trades are executed in milliseconds, strategies are tested on decades of data, and human bias takes a back seat.
Over the past decade, Artificial Intelligence (AI) has supercharged this process.
Now, trading systems not only follow pre-set rules but also learn from market data, adapt strategies in real time, and detect patterns invisible to human eyes.
In 2025, over 70% of all equity trades in developed markets are algorithmic. In some markets, AI-powered systems handle more trading volume than humans.
2. What is Algorithmic Trading?
At its core, algorithmic trading is:
The use of computer programs to execute trades based on a defined set of rules and parameters.
Key features:
Rule-based execution: Trades are placed when certain conditions are met (e.g., price crosses moving average).
Speed & automation: No waiting for human clicks; execution is near-instant.
Backtesting: Strategies can be tested on historical data before risking real money.
Scalability: Can handle hundreds of trades simultaneously.
Example:
If a stock’s 50-day moving average crosses above its 200-day moving average, buy 100 shares. If the reverse happens, sell.
3. What is AI-Powered Trading?
AI-powered trading takes algorithms further:
Instead of pre-programmed rules, AI systems can learn patterns, adapt strategies, and make predictions based on data.
Core difference:
Algorithmic trading = fixed rules.
AI trading = adaptive, self-learning rules.
AI capabilities in trading:
Pattern recognition – spotting trends in price, volume, sentiment, or macro data.
Predictive modeling – forecasting future price movements.
Reinforcement learning – improving strategies based on feedback from trades.
Natural Language Processing (NLP) – reading and interpreting news, social media, and financial reports.
4. Types of Algorithmic & AI Trading Strategies
There’s a wide range of strategies — some decades old, others made possible only by modern AI.
A. Trend-Following Strategies
Based on technical indicators like Moving Averages, RSI, MACD.
Goal: Ride the trend up or down until it shows signs of reversal.
AI twist: Deep learning models can predict trend continuation probability.
B. Mean Reversion Strategies
Assumes prices will revert to an average over time.
Example: If a stock is far above its 20-day moving average, short it; if far below, buy.
AI twist: Machine learning models detect the optimal mean reversion window dynamically.
C. Arbitrage Strategies
Exploiting price differences between markets or instruments.
Example: If a stock trades at ₹100 in NSE and ₹101 in BSE, buy low, sell high instantly.
AI twist: AI can scan thousands of instruments and markets for fleeting arbitrage opportunities.
D. Statistical Arbitrage
Uses correlations between assets (pairs trading).
Example: If Reliance and ONGC usually move together, but Reliance rallies while ONGC lags, trade expecting convergence.
AI twist: AI can detect shifting correlations and adapt.
E. High-Frequency Trading (HFT)
Ultra-fast trades exploiting tiny inefficiencies.
Requires low-latency infrastructure.
AI twist: AI can dynamically adjust order placement to reduce slippage.
F. Sentiment Analysis Trading
Uses NLP to gauge market sentiment from news, tweets, blogs.
Example: AI detects a surge in positive sentiment toward Tesla, triggering a buy.
AI twist: Transformer-based NLP models (like GPT) can analyze sarcasm, tone, and context better than older keyword-based systems.
G. Market Making
Posting buy and sell orders to earn the bid-ask spread.
Requires continuous price adjustment.
AI twist: Reinforcement learning optimizes spread width for profitability.
5. Key Components of an Algorithmic/AI Trading System
Building a profitable system is more than just coding a strategy. It needs an ecosystem:
Market Data Feed
Real-time & historical prices, volumes, order book data.
AI needs clean, high-quality data to avoid bias.
Signal Generation
Algorithm or AI model generates buy/sell/hold signals.
Could be purely quantitative or include sentiment and fundamentals.
Execution Engine
Sends orders to the exchange with minimal delay.
AI can optimize execution to avoid market impact.
Risk Management Module
Position sizing, stop-loss levels, portfolio diversification.
AI can dynamically adjust risk based on volatility.
Backtesting Framework
Tests strategy on historical data.
Important: Avoid overfitting — making the model too perfect for past data but useless in the future.
Monitoring & Maintenance
Even AI needs human oversight.
Models can degrade if market behavior shifts (concept drift).
6. Role of Machine Learning in Trading
Machine Learning (ML) is the backbone of AI-powered trading.
Popular ML techniques in trading:
Supervised Learning – Train on historical prices to predict next-day returns.
Unsupervised Learning – Cluster stocks with similar price behavior.
Reinforcement Learning – Learn by trial and error in simulated markets.
Deep Learning – Use neural networks to detect complex patterns in large datasets.
Example:
A neural network could take in:
Price data
Volume data
News sentiment
Macroeconomic indicators
…and output a probability of the stock rising in the next 5 minutes.
7. Advantages of Algorithmic & AI Trading
Speed – Executes in milliseconds.
Accuracy – No fat-finger trade errors.
No emotional bias – Sticks to the plan.
Scalability – Monitors hundreds of assets.
24/7 markets – Especially useful in crypto trading.
Pattern discovery – Finds relationships humans might miss.
8. Risks & Challenges
Not everything is a profit paradise.
A. Technical Risks
System crashes
Internet outages
Latency issues
B. Model Risks
Overfitting to historical data
Concept drift (market behavior changes)
C. Market Risks
Sudden news events (e.g., black swan events)
Flash crashes caused by runaway algorithms
D. Regulatory Risks
Exchanges and regulators monitor algo trading to prevent manipulation.
Some AI strategies might accidentally trigger market manipulation patterns.
9. Risk Management in AI Trading
A robust system must:
Use position sizing (risk only 1-2% of capital per trade).
Place stop-loss & take-profit levels.
Have circuit breakers to halt trading if unusual volatility occurs.
Validate models regularly against out-of-sample data.
10. Backtesting & Optimization
Before deploying:
Data cleaning – Remove bad ticks, adjust for splits/dividends.
Out-of-sample testing – Use unseen data to test robustness.
Walk-forward testing – Periodically re-train and test.
Monte Carlo simulations – Stress-test strategies under random conditions.
11. Real-World Applications
Hedge Funds: Renaissance Technologies, Two Sigma.
Banks: JPMorgan’s LOXM AI execution algorithm.
Retail: Zerodha Streak, AlgoTrader.
Crypto: AI bots analyzing blockchain transactions.
12. Future Trends in AI Trading
Explainable AI – Making AI’s decision-making transparent.
Hybrid human-AI teams – AI generates signals; humans validate.
Quantum computing – Potentially breaking speed and complexity barriers.
Multi-agent reinforcement learning – AI “traders” competing/cooperating in simulations.
13. Conclusion
Algorithmic & AI-powered trading is no longer just a Wall Street tool — it’s accessible to retail traders, thanks to low-cost cloud computing, APIs, and open-source machine learning libraries.
The key to success isn’t just having an algorithm — it’s about data quality, model robustness, disciplined risk management, and constant adaptation.

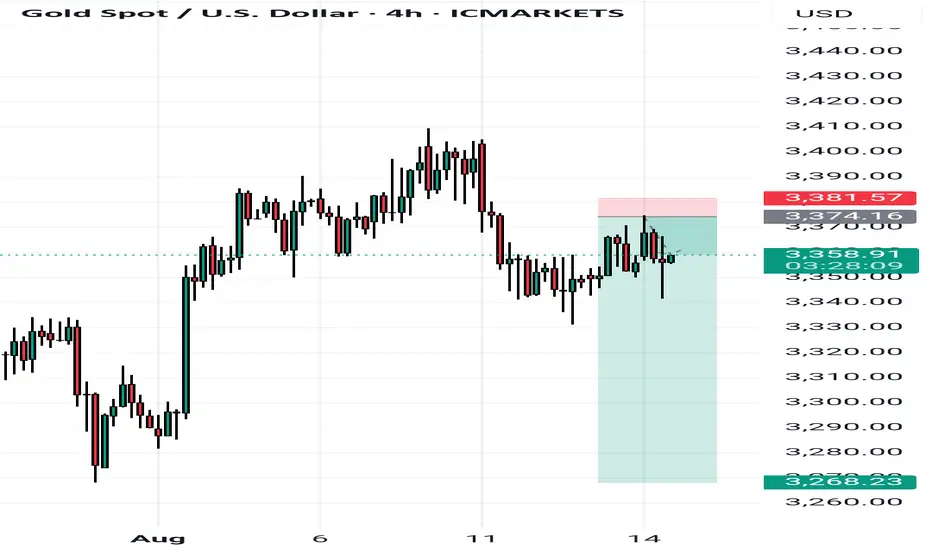
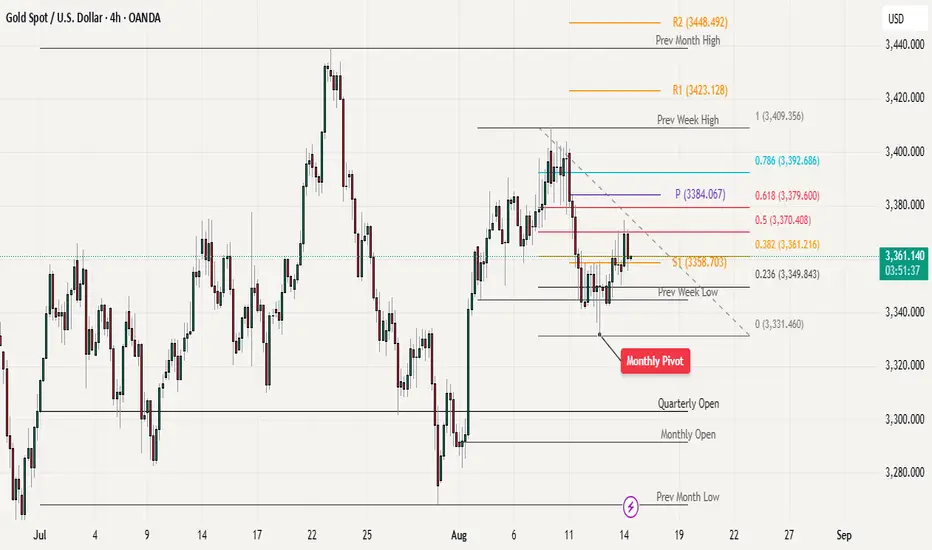
Gold Recovery Stalls at Fibonacci Resistance - Key Levels to WatWe have seen a strong recovery from the monthly pivot point, which acted as solid support. However, the price is now facing significant resistance in the Fibonacci golden zone between 3,370-3,379, based on the recent decline from 3,409 to 3,331. This resistance level presents the main challenge for bulls at this point.
For the bullish momentum to continue, buyers need to push the price above 3,379, which would confirm the upward trend and signal further strength. The positive sign is that gold has been holding steady above the 3,350 level, showing some underlying support at this price point.
Looking at key levels to watch, 3,350 serves as the immediate support level . If this level fails to hold, the next major support comes in at 3,331. A breakdown below these support levels could trigger further selling pressure and lead to additional declines in gold price.
Gold (XAU/USD) Strategy Analysis Gold (XAU/USD) Strategy Analysis: Buy/Sell Points and Potential Scenarios!
Market Overview & Primary Trend
As you can see on the chart, Gold (XAU/USD) on the H4 timeframe is moving clearly within a steady ascending channel. This indicates that the bullish momentum remains dominant. Therefore, in the short to medium term, I will continue to prioritize long positions to trade with this primary trend.
The target for these long positions could be quite distant, as this analysis is based on the H4 timeframe, making it suitable for swing or position traders.
Elliott Wave Analysis & Strategic Price Zones
According to Elliott Wave theory, Gold is showing signs of forming an ABC corrective structure. The price is currently in the process of completing Wave B. I anticipate Wave C will be an upward wave, which could push the price higher and potentially reclaim the price zone created by the previous NFP news.
Potential Sell Zone (Short): I have identified a clear Fair Value Gap (FVG) around the $3384 - $3390 area. This is a zone where I will consider looking for short-term sell signals (scalping) or trades based on a correction, but only with confirmation from price action.
Preferred Buy Zone (Long): With the ascending channel holding, I believe the current price area is quite reasonable for considering long entries if there is a confirming signal. However, if the price breaks below this trend channel, the scenario will change. In that case, a safer buy zone would be much deeper, around the $3308 - $3315 level.
Important News to Watch This Week
Today, we have the PPI (Producer Price Index) data coming out during the US session. Since the recent CPI (Consumer Price Index) report was unfavorable, it's likely that the PPI data will also show signs that inflation may be easing. This will directly impact the conclusion regarding the Fed's interest rate policy and could cause significant volatility in Gold. Please pay close attention to risk management and avoid trading during the news release.
Final Advice
For those who are hesitant to buy at the current price due to it being quite high, waiting for a sell signal at the $3384 - $3390 zone could also be a logical option for capturing short-term profits.
Finally, I wish you all a very effective and successful trading week with this analysis! Always remember that capital management is the most crucial factor.

niftyThe Nifty trade setup signals a buy entry at 24,634, aiming to capture potential upside momentum driven by positive sentiment or technical strength. The stoploss is placed at 24,604, restricting downside risk to 30 points, ensuring tight risk management if the market moves against the position. The target exit is set at 24,695, offering a profit potential of 61 points, giving a favorable risk-to-reward ratio of about 1:2. This setup may be supported by bullish technical patterns, upward trendline support, or strong buying interest near key levels. Traders should watch for intraday price action and market breadth to confirm the bullish bias. Strict adherence to the stoploss is essential to preserve capital, while timely profit booking at the target can lock in gains and ensure disciplined trading results.

#XAUUSDGOLD start it's correct from 22 April 2025 ,and complete a flat correction on 15 may 2025 , after that the price rise but not able to cross the high of B wave ,so it enter in a complex correction and form a X wave on 16 jun 2025 and make its A wave on 30 june 2025 , and rice to B wave and forming a double flat correction .the price is now in its C wave and expected to come lower to the level of 3200-3100.We can put over SL to the high of B wave.

XAU/USDThis XAU/USD setup is a buy trade, showing a bullish outlook for gold. The entry price is 3369, the stop-loss is 3364, and the exit price is 3379. The trade aims for a 10-point profit while risking 5 points, giving a favorable risk-to-reward ratio of 1:2.
Buying at 3369 suggests the trader anticipates upward momentum, potentially supported by a weaker US dollar, lower Treasury yields, or increased safe-haven demand. The target at 3379 is set near a resistance area, allowing profits to be booked before potential selling pressure appears.
The stop-loss at 3364 limits downside risk if the market turns bearish. This setup is ideal for short-term trading with disciplined execution and proper risk management.

Gold Trading Plan for 14th August 2025📈 Gold Buy Setup
Condition to Buy:
Enter a buy trade above the high of the 1-hour candle that closes above $3,370.
This means you must wait until a full 1-hour candle finishes forming and its closing price is above $3,370. After it closes, identify the highest price point of that candle and set your buy trigger slightly above that level.
Profit Targets:
🎯 First Target: $3,381
🎯 Second Target: $3,391
🎯 Third Target: $3,403
Risk Management Tip:
Place your stop-loss just below the low of the breakout candle or an important support zone. This helps control risk in case the breakout fails.
📉 Gold Sell Setup
Condition to Sell:
Enter a sell trade below the low of the 1-hour candle that closes below $3,342.
This means you must wait until a full 1-hour candle finishes forming and its closing price is below $3,342. After it closes, identify the lowest price point of that candle and set your sell trigger slightly below that level.
Profit Targets:
🎯 First Target: $3,331
🎯 Second Target: $3,319
🎯 Third Target: $3,305
Risk Management Tip:
Place your stop-loss just above the high of the breakdown candle or a nearby resistance zone to avoid large losses.
⚠ Disclaimer:
Trading in gold and other commodities involves substantial risk. These price levels are for educational and informational purposes only and do not constitute financial advice. Always perform your own analysis, use stop-loss orders, and trade within your risk tolerance. Past performance does not guarantee future results.
Elliott Wave Analysis – XAUUSD (August 13, 2025)
1. Momentum
• D1 Timeframe: Momentum is about to enter the oversold zone. By the end of today, it is likely to be fully in oversold territory. This stage often leads to strong price movement – either a sharp decline or a bullish reversal.
• H4 Timeframe: Momentum is preparing to turn upward. We need to wait for the current H4 candle to close for confirmation. If confirmed, a recovery move is likely to occur today.
• H1 Timeframe: Momentum is currently tightening and approaching the overbought zone – a typical sign of sideways price action. This explains why, despite the high probability of a recovery, H1 does not yet provide a good entry signal.
________________________________________
2. Wave Structure
• RSI shows a bullish divergence between price and the indicator – a pattern often seen in wave 3 or wave 5. This supports the view that wave 5 (black) has completed around the 3333 level.
• With a complete 5-wave structure, wave A (red) of the ABC (red) correction may already be in place.
• A recovery in wave B (red) is expected, which aligns with H4 momentum preparing to turn upward. Wave B typically forms a 3-wave corrective structure, where price moves in a choppy, overlapping manner rather than trending strongly.
• Wave B target zones:
1. 3371
2. 3381
These two levels are close to each other, so they can be treated as one combined zone. The plan is to take the first target as the base level while extending the SL to cover the second target. If price approaches these levels, it’s best to watch real-time price action before entering a trade.
• Alternative scenario: If wave 5 (black) is not yet complete, the 3323 zone remains a good Buy opportunity (as per the previous analysis).
________________________________________
3. Trading Plan
Sell Setup:
• Entry Zone: 3371 – 3373
• SL: 3385
• TP1: 3358
• TP2: 3331
• TP3: 3323
Buy Setup:
• Entry Zone: 3323 – 3321
• SL: 3313
• TP1: 3331
• TP2: 3357
• TP3: 3371
2. Wave Structure
• RSI shows a bullish divergence, often seen in wave 3 or 5, suggesting wave 5 (black) may have completed around 3333.
• Wave A (red) of the ABC cycle may be complete; wave B (red) is expected to recover in a 3-wave, choppy pattern.
• Wave B target zone: 3371–3381 (treated as one zone; monitor price action before entry).
• Alternative scenario: If wave 5 (black) is not yet complete, 3323 remains a potential Buy zone.

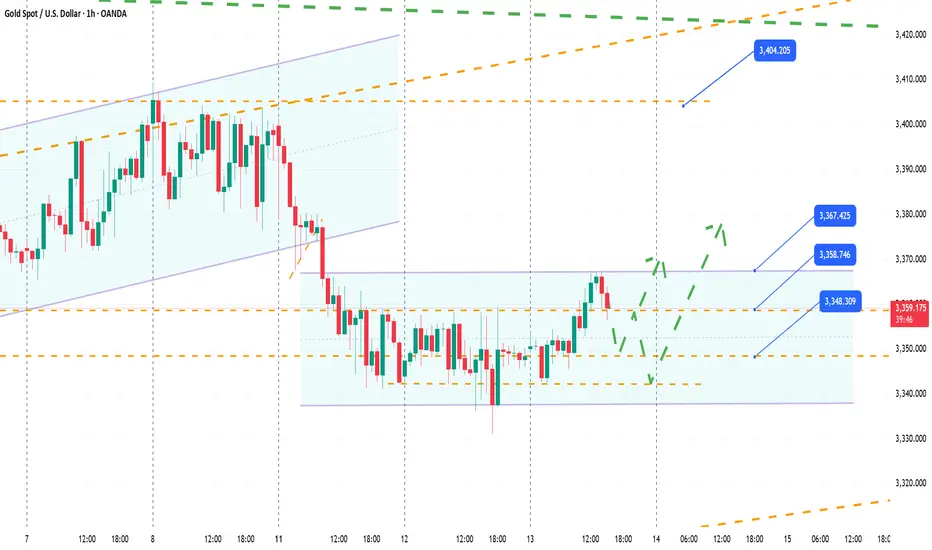
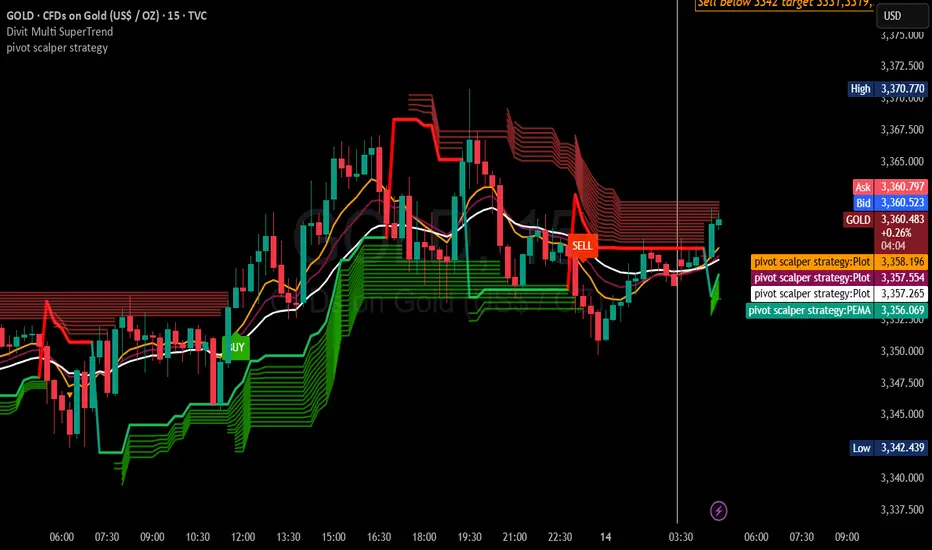
GOLD SURGES AFTER CPI – TARGETING 337x BEFORE SELL-OFF? MMFLOW TECHNICAL OUTLOOK
📌 Market Overview
Following the CPI release, gold reacted with strong buying momentum (FOMO BUY), pushing prices swiftly from the 333x area up to 335x.
The main driver here is the BUY side taking advantage of remaining liquidity gaps above, aiming to break through the critical 3358 resistance – the first major barrier before reaching 337x, a key equilibrium zone that previously acted as a strong price-holding area for SELL orders.
Current structure indicates:
Short-term trend: Bullish, but approaching key distribution levels.
Liquidity Hunt: A decisive break above 3358 with strong volume could trigger a rapid move towards 337x, activating SELL volume from pending limit orders.
Macro context: No major news events today, with expected daily range ~35–40 points, increasing the chance of range-bound traps before a breakout.
🧐 Technical Outlook – MMFLOW View
Market Structure: Gold has formed a Higher Low around 333x and is now testing short-term resistance.
Key Levels & Liquidity Zones:
Liquidity BUY ZONE at 3338–3336 has reacted well, confirming BUYers are still defending this zone.
Supply Zone / CP Zone at 3375–3377 aligns with an H1 Order Block, holding a high concentration of pending SELL orders.
Volume Flow: Increasing volume as price approaches resistance suggests a potential “last push” before a reversal.
🎯 MMFLOW Trading Plan
🔹 BUY SCALP – Following the main trend
Entry: 3338 – 3336
SL: 3332
TP: 3342 – 3346 – 3350 – 3355 – 3360 – 3370 – 3380
🔹 SELL SCALP – At the distribution zone
Entry: 3375 – 3377
SL: 3382
TP: 3370 – 3365 – 3360 – 3355 – 3350 – 3340
📊 Key Technical Levels
Resistance: 3358 – 3365 – 3376
Support: 3342 – 3337 – 3330 – 3310
💡 MMFLOW Insight: With the current setup, the optimal strategy is to wait for a BUY opportunity near early support (334x) to ride the short-term bullish momentum, then watch for price reaction at 337x to catch potential SELL entries once top-side liquidity is swept.

August 13 Gold AnalysisAugust 13 Gold Analysis
I. Intraday Market Trends and Key Drivers
- Gold Price Trend: Stable above $3,350 in the European session, regaining buying support after two consecutive days of pullback, leading to a short-term rebound.
- Key Catalysts:
1. US CPI Data: Headline inflation remained flat in July (2.7%), but core CPI rose to 3.1% (a five-month high). Market bets on the probability of a September rate cut rose to 93.4%, putting pressure on the US dollar and boosting gold.
2. Intensifying Policy Game:
- Trump pressured Powell to cut rates and threatened a lawsuit. Treasury Secretary Bensant advocated for a 50 basis point cut in September, and Bullard expressed his support.
- Disagreements emerged within the Federal Reserve: Barkin questioned the inflation-unemployment balance, while Schmid warned that tariffs would drive up inflation. Policy uncertainty amplified safe-haven demand.
3. Unexpected Disruptions: Anthony, the nominee for Director of the Bureau of Labor Statistics, proposed suspending the release of the employment report, coupled with Fed Governor Milan's optimistic inflation stance, exacerbating market volatility.
II. Key Technical Signals and the Bull-Bear Game
- The volatile pattern remains unchanged: Gold prices are in a consolidation phase after retreating from the $3,400 high, with support above $3,300 holding firm.
- Bull-Bear Tipping Points:
- Support Fortress: $3,340 (H4 200-day moving average + high trading volume area). If this fails, the $3,300 mark is likely to fall.
- Breakout Path: If it holds $3,350 and breaks through $3,360 resistance, it will open the way to $3,380-3,400. Further breakthroughs could challenge the historical highs of $3,420-3,500.
- Short-term Momentum:
- Gold prices rose after the overnight CPI data, then fell to $3,330. Trump's attacks on Powell triggered a V-shaped reversal, demonstrating high policy sensitivity.
- Currently, the Asian and European sessions are experiencing strong volatility, with $3,340-3,350 forming the intraday bullish support level.
III. Trading Strategy and Risk Management Key Points
Intraday Trading Logic
> 📌 Core Strategy: European trading continues to fluctuate and favor the bulls. Focus on the effectiveness of a breakout above $3,360. Follow the momentum in the US market.
- Aggressive Strategy:
- At the current price of $3,353, try a light buy position (or add to your position if it pulls back to $3,348). Stop-loss below $3,340, target $3,360 → $3,378**.
- If it breaks above $3,360, chase long positions to target the $3,380-3,400 range.
- Conservative Strategy:
- Wait for gold to break through $3,360 with significant volume before retracing to follow up with a long position. Alternatively, go short if it breaks below $3,340 (target $3,320-3,300).
Trade cautiously and manage risk! Wish you good luck!