August 13 Gold AnalysisAugust 13 Gold Analysis
I. Intraday Market Trends and Key Drivers
- Gold Price Trend: Stable above $3,350 in the European session, regaining buying support after two consecutive days of pullback, leading to a short-term rebound.
- Key Catalysts:
1. US CPI Data: Headline inflation remained flat in July (2.7%), but core CPI rose to 3.1% (a five-month high). Market bets on the probability of a September rate cut rose to 93.4%, putting pressure on the US dollar and boosting gold.
2. Intensifying Policy Game:
- Trump pressured Powell to cut rates and threatened a lawsuit. Treasury Secretary Bensant advocated for a 50 basis point cut in September, and Bullard expressed his support.
- Disagreements emerged within the Federal Reserve: Barkin questioned the inflation-unemployment balance, while Schmid warned that tariffs would drive up inflation. Policy uncertainty amplified safe-haven demand.
3. Unexpected Disruptions: Anthony, the nominee for Director of the Bureau of Labor Statistics, proposed suspending the release of the employment report, coupled with Fed Governor Milan's optimistic inflation stance, exacerbating market volatility.
II. Key Technical Signals and the Bull-Bear Game
- The volatile pattern remains unchanged: Gold prices are in a consolidation phase after retreating from the $3,400 high, with support above $3,300 holding firm.
- Bull-Bear Tipping Points:
- Support Fortress: $3,340 (H4 200-day moving average + high trading volume area). If this fails, the $3,300 mark is likely to fall.
- Breakout Path: If it holds $3,350 and breaks through $3,360 resistance, it will open the way to $3,380-3,400. Further breakthroughs could challenge the historical highs of $3,420-3,500.
- Short-term Momentum:
- Gold prices rose after the overnight CPI data, then fell to $3,330. Trump's attacks on Powell triggered a V-shaped reversal, demonstrating high policy sensitivity.
- Currently, the Asian and European sessions are experiencing strong volatility, with $3,340-3,350 forming the intraday bullish support level.
III. Trading Strategy and Risk Management Key Points
Intraday Trading Logic
> 📌 Core Strategy: European trading continues to fluctuate and favor the bulls. Focus on the effectiveness of a breakout above $3,360. Follow the momentum in the US market.
- Aggressive Strategy:
- At the current price of $3,353, try a light buy position (or add to your position if it pulls back to $3,348). Stop-loss below $3,340, target $3,360 → $3,378**.
- If it breaks above $3,360, chase long positions to target the $3,380-3,400 range.
- Conservative Strategy:
- Wait for gold to break through $3,360 with significant volume before retracing to follow up with a long position. Alternatively, go short if it breaks below $3,340 (target $3,320-3,300).
Trade cautiously and manage risk! Wish you good luck!
CFDGOLD trade ideas
Gold Trading Strategy XAUUSD August 13, 2025Gold Trading Strategy XAUUSD August 13, 2025:
Gold prices recovered slightly, currently trading around $3,351/oz, positive US inflation data for July has reinforced market expectations that the US Federal Reserve (FED) will cut interest rates in September, while a weaker US dollar has boosted gold's appeal.
Fundamental news: Data from the US Bureau of Labor Statistics showed that the Consumer Price Index (CPI) increased 2.7% year-on-year in July, lower than the expected 2.8% and unchanged from June. Core CPI increased 3.1% year-on-year and 0.3% month-on-month, the largest increase in six months.
Technical analysis: The sideways range of 3,340 - 3,360 has not been broken yet. The MAs are showing signs of moving sideways, showing the tug-of-war between buyers and sellers. RSI H1 has started to move towards the buy zone, RSI H4 is heading towards the average line. There is a high possibility that gold price will have a correction according to RSI of H4 and increase strongly again.
Important price zones today: 3340 - 3345, 3365 - 3370 and 3385 - 3390.
Today's trading trend: SELL.
Recommended orders:
Plan 1: SELL XAUUSD zone 3367 - 3369
SL 3372
TP 3364 - 3355 - 3345.
Plan 2: SELL XAUUSD zone 3387 - 3389
SL 3392
TP 3384 - 3374 - 3364 - 3345.
Plan 3: BUY XAUUSD zone 3340 - 3342
SL 3337
TP 3345 - 3355 - 3365 - 3385 - OPEN.
Wish you a safe, successful and profitable trading day.💗💗💗💗💗

Strong USD, Gold "Holding Its Breath" at Key ResistanceYesterday, gold prices continued to trade within a tight range of 3,340–3,355 USD , reflecting the tug-of-war between buyers and sellers. Selling pressure is still present but not strong enough to break the key support level.
On the news front: Both the U.S. Core PPI m/m and PPI m/m are forecast to rise 0.2% (vs. 0.0% previously), while unemployment claims are expected to dip from 226K to 225K . This signals inflationary pressure from the production side and a resilient labor market , which could prompt the Fed to maintain a tight monetary policy. A stronger USD puts short-term downward pressure on gold.
From the chart: Gold is moving within a sideway range of 3,340 – 3,363 USD after being rejected at the 3,363 USD resistance zone. The price structure shows consolidation with minor technical pullbacks. The 3,312 USD support remains intact; if it holds, buyers may step back in.
Suggested strategy:
Look for buy opportunities around 3,312 – 3,320 USD if support holds, with a target at 3,363 USD. Place stop-loss below 3,305 USD to limit risk.
Question: Do you think gold has enough momentum to break 3,363 USD and start a new bullish leg this week?

XAUUSD Buy setup Above 3360Description:
Gold (XAUUSD) is showing a promising bullish setup on the 4H timeframe after a period of consolidation and a clear liquidity sweep. The market structure suggests a potential continuation to the upside — but only once our key trigger is activated.
Trade Plan:
Buy Trigger: Above 3360 (Clean Break & Close)
Stop Loss: 3330
Reasoning: Consolidation followed by a liquidity sweep — often a sign of smart money accumulation before an impulsive move.
Timeframe: 4H bias, execution on lower timeframe confirmation.
Key Notes:
✅ Wait for a confirmed breakout above 3360 — avoid premature entries.
✅ Manage risk with defined SL at 3330.
✅ This is a market observation for educational purposes — not financial advice.
CTA (TradingView 2025 policy compliant):
📌 Always use your own trade plan and risk management. This idea is for educational purposes only.

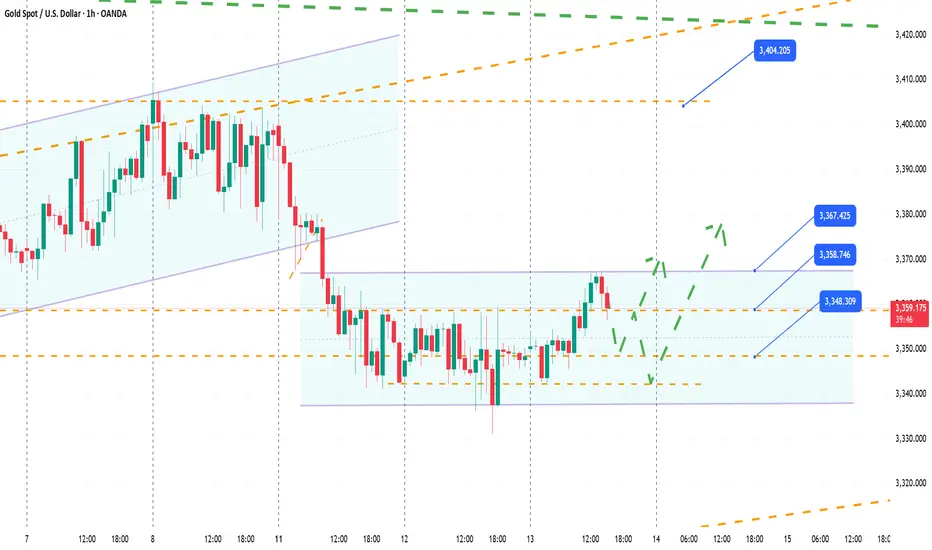
Gold Plan 13/08 – Captain VincentGold Plan 13/08 – Captain Vincent ⚓
News Background
📊 Gold is holding steady near $3,350/oz after the US July CPI release.
Headline CPI : 2.7% (below forecast of 2.8%) 📉
Core CPI: 3.1% (up from 2.9%) 📈
➡ This cools down inflation fears from tariffs and increases the probability of a 25 bps Fed rate cut in September , which is bullish for Gold.
Key factors to watch:
💼 Market awaiting more data: PPI, jobless claims, retail sales.
🔍 Tariff drama: Trump says no tariffs, but US Customs just listed 1kg & 100oz gold bars under taxable imports.
🌐 US extends the trade truce with China for another 90 days.
🕊 US–Russia talks on Ukraine scheduled for 15 Aug in Alaska.
News conclusion:
Lower-than-expected CPI + higher Fed cut chances = Gold remains positive.
But tariff and geopolitical risks must be tracked closely.
Yesterday’s Action (12/08)
Gold tapped the Buy Scalp – Quick Boarding 🚤 zone and bounced ~290 pips .
However, it failed to break decisively above the zone and moved sideways around support.
Technical Plan – 13/08
1. Sell Scalp – Quick Boarding Reverse ⚓
Entry: 3,374 – 3,376
SL: 3,382
TP: 3,368 → 3,362 → 3,355 → 3,3xx
Reason: Short-term resistance, suitable for quick sell scalps when price retests higher.
2. Sell Zone – Storm Breaker 🌊
Entry: 3,405 – 3,406
SL: 3,411
TP: 3,395 → 3,385 → 3,375 → 3,365
Reason: Major resistance zone aligned with previous highs and trend channel.
Scenarios:
Price likely to rise from current sideways range to test either Sell Scalp or Storm Breaker.
Priority: Sell if reversal signals (pin bar, engulfing) appear on M15/H1 at these zones.
If price breaks above Storm Breaker and holds above 3,411 → cancel sell plan, wait for new structure.
Captain’s Note:
"The CPI wave has anchored the Gold ship near 3,350. Today, the crew is ready to set sail towards Sell Scalp and Storm Breaker, waiting for the winds to shift for a profitable turn." ⚓🌊

Target hit on XAU/USD
On 13/08/2025, the XAU/USD trade successfully reached its target, delivering a strong and profitable outcome. The trade was planned using a combination of technical analysis and market fundamentals, focusing on key support-resistance levels and price action signals. Once the entry was triggered, gold prices moved consistently toward the target, showing clear momentum in the anticipated direction. A weaker U.S. dollar and ongoing global economic uncertainty further supported bullish movement in gold. The trade never came close to the stop loss, which reflects the accuracy of the setup and the effectiveness of the strategy. Achieving the target reinforced the importance of disciplined risk management and sticking to the trading plan without emotional interference. This win on 13/08/2025 not only provided a solid return but also strengthened confidence in the overall trading approach, proving that patience and precise execution can consistently lead to profitable results in XAU/USD trading.

xau/usd
This XAU/USD trade setup is a buy trade, designed for a very short-term move in gold prices. The entry price is 3346, the stop-loss is set at 3342, and the exit price is 3348. The trade aims for a small 2-point profit while risking 4 points, meaning the risk-to-reward ratio is lower than 1:1, which makes it suitable only for quick scalp trading strategies.
Buying at 3346 suggests the trader expects a slight upward movement, possibly triggered by short-term momentum, minor support holding, or quick price fluctuations during active market hours. The target at 3348 is very close to the entry, meaning this trade relies on precise timing and fast execution to capture small gains.
The stop-loss at 3342 is set just below the entry to limit losses if the market moves against the position. Given the tight range, any sudden volatility could hit the stop-loss quickly.
This type of trade requires constant monitoring, rapid decision-making, and disciplined risk control. While the profit target is small, consistent scalp trades like this can add up over time if executed with accuracy and strict trading discipline.

Gold Trading Strategy for 13th August 2025📈 Gold Buy Setup
Condition to Enter Buy:
Wait until the price closes above the high of a 1-hour candle.
✅ Example: If the high of a 1-hour candle is $3,360, enter only when the price closes above $3,360 — not just a spike.
Entry Price:
Buy above $3,360 after confirmation.
Targets:
🎯 Target 1 → $3,372
🎯 Target 2 → $3,383
🎯 Target 3 → $3,394
Logic:
This indicates bullish momentum — closing above the 1-hour high often triggers follow-through buying.
📉 Gold Sell Setup
Condition to Enter Sell:
Wait until the price closes below the low of a 15-minute candle.
✅ Example: If the low of a 15-minute candle is $3,340, enter only when the price closes below $3,340.
Entry Price:
Sell below $3,340 after confirmation.
Targets:
🎯 Target 1 → $3,331
🎯 Target 2 → $3,318
🎯 Target 3 → $3,305
Logic:
A break below the 15-minute low with a confirmed close signals increased selling pressure.
💡 Example Scenario
If the latest 1-hour candle high is $3,360:
Price moves to $3,361 but does not close above → No trade.
Price closes at $3,362 → Buy with targets $3,372 → $3,383 → $3,394.
If the latest 15-minute candle low is $3,340:
Price dips to $3,339 but closes back above → No trade.
Price closes at $3,338 → Sell with targets $3,331 → $3,318 → $3,305.
⚠ Disclaimer:
Trading in commodities and gold futures involves substantial risk and is not suitable for all investors. Prices can move rapidly against you, leading to significant losses. The above is for educational purposes only and not financial advice. Always use proper risk management and consult with a certified financial advisor before making any trading decisions.

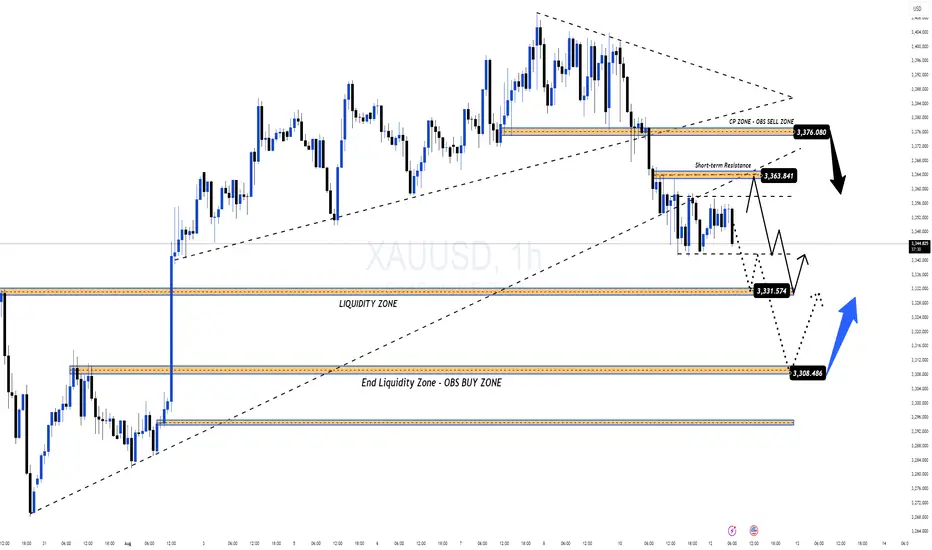
PROACHING LIQUIDITY ZONE – WAITING FOR CPI TO DECIDE NEXT MOVE📌 MARKET RECAP
Gold kicked off the week with a sharp $50 drop, breaking through key trendlines and nearby support zones.
The selling pressure came from:
Profit-taking after the recent strong rally.
USD strength expectations ahead of CPI data (forecast ~0.1% better than the previous reading).
Geopolitical factor: Ukraine–Russia ceasefire talks moving towards a conclusion, fueling risk-off sentiment.
🧐 WHAT’S NEXT?
If CPI beats expectations → USD strengthens → Gold could drop further into the Liquidity Zone 333x – 330x.
If CPI disappoints → USD weakens → Gold may quickly bounce back toward key level 337x (previous breakdown zone) for a retest before deciding direction.
🎯 MMFLOW GAME PLAN
1️⃣ BUY SCALP
📌 Entry: 3331 – 3329
📌 SL: 3325
📌 TP: 3335 – 3340 – 3345 – 3350 – 3360 – 3370 – 3380
2️⃣ BUY ZONE
📌 Entry: 3310 – 3308
📌 SL: 3304
📌 TP: 3314 – 3318 – 3322 – 3326 – 3330 – 3335 – 3340 – 3350 – 3360 – ???
3️⃣ SELL SCALP
📌 Entry: 3363 – 3365
📌 SL: 3370
📌 TP: 3360 – 3356 – 3352 – 3348 – 3344 – 3340
4️⃣ SELL ZONE
📌 Entry: 3376 – 3378
📌 SL: 3382
📌 TP: 3372 – 3368 – 3364 – 3360 – 3355 – 3350 – 3340
⚠️ RISK NOTE
CPI is the market’s dice roll – even a small deviation could trigger massive stop hunts.
Always watch the KeyLevels marked on the chart before entering trades.
XAUUSD GOLD ANALYSIS ON(12/08/2025)#XAUUSD UPDATEDE
Current price - 3345
If price stay below 3365, then next target 3325,3010 and above that 3380
Plan;If price break 3345-3350 area,and stay below 3345,we will place sell order in gold with target of 3325 and 3310 & stop loss should be placed at 3365

Elliott Wave Analysis – XAUUSD August 12, 2025
1. Momentum Analysis
• D1 Timeframe: Momentum is declining → the downtrend remains intact. It may take another 2–3 daily candles for price to reach the oversold zone and potentially reverse.
• H4 Timeframe: Momentum is rising → from now until the U.S. session, price may either retrace upwards or move sideways.
• H1 Timeframe: Momentum is preparing to turn down → a minor pullback could occur in the short term, so this move should be monitored.
________________________________________
2. Elliott Wave Structure
• The green wave structure in the form of an ending diagonal may have been completed. This could mean that Wave 5 or Wave C (black) has formed.
• Personally, I do not want to see the Green 5-Wave Structure end with an ending diagonal at this stage because:
o If this is an impulsive uptrend structure, we are only at Wave 1 of the larger degree.
o An ending diagonal in Wave 5 (black) indicates weak buying pressure, which is not ideal when price hasn’t broken the previous high to confirm a new trend → increasing the probability that this is a corrective wave.
• Looking at the current downward wave structure, I tentatively label it as five black waves 1-2-3-4-5. The current slight rebound is expected to be Wave 4, which could take the form of either a Flat or Triangle.
• Wave 4 targets:
1. 3358
2. 3364
• If price breaks 3381, the current 1-2-3-4-5 bearish count will be invalidated (Wave 4 would overlap Wave 1). In that case, the structure could turn into a corrective ABC or a new 5-wave advance.
• With a Wave 4 target at 3364, the projected Wave 5 target would be 3323.
________________________________________
3. Combining Momentum & Wave Structure
• D1 downtrend → supports the scenario of another drop, forming Wave 5.
• H4 rising + H1 declining → could indicate Wave 4 forming as a triangle, with the key signal being that the current drop does not break 3342.
o If 3342 breaks, Wave 5 may already be in play, targeting 3323.
• Since H4 momentum is still rising, there remains a chance that price breaks above 3381, which would require a full recount—possibly turning into an ABC correction or a 5-wave rally.
________________________________________
4. Trading Plan
• If Wave 4 forms as a triangle → the 3358 area is a good sell zone, or wait for a breakout below 3342.
• Limit Sell Order:
o Entry: 3364 – 3366
o SL: 3374
o TP1: 3342
o TP2: 3333
o TP3: 3323

Part6 Institutional TradingIntroduction to Options Trading
Options are like a financial “contract” that gives you rights but not obligations.
When you buy an option, you are buying the right to buy or sell an asset at a specific price before a certain date.
They’re mainly used in stocks, commodities, indexes, and currencies.
Two main types of options:
Call Option – Right to buy an asset at a set price.
Put Option – Right to sell an asset at a set price.
Key terms:
Strike Price – The price at which you can buy/sell the asset.
Expiration Date – The last day you can use the option.
Premium – Price paid to buy the option.
In the Money (ITM) – Option has intrinsic value.
Out of the Money (OTM) – Option has no intrinsic value yet.
At the Money (ATM) – Strike price equals current market price.
Options give traders flexibility, leverage, and hedging power. But with great power comes great “margin calls” if you misuse them.

XAU/USD Bullish Bounce from Demand Zone !Gold (XAU/USD) on the 4H chart is showing a potential bullish reversal setup. Price has pulled back into a Fair Value Gap (FVG) and high supply/demand zone near 3,329–3,315, aligning with the 0.382–0.5 Fibonacci retracement.
Key Points:
Support Zone: 3,329–3,315 (demand + FVG).
Bullish Rejection Expected: Price may bounce from this zone, targeting upper resistance levels.
Upside Targets:
TP1: 3,356
TP2: 3,375
TP3: 3,440–3,459 (major resistance)
Invalidation: A daily close below 3,315 could open room for deeper downside toward 3,278–3,245.
Indicators: EMA(9) and Ichimoku showing potential for trend resumption if price closes above 3,362.
Overall, the chart suggests a buy setup on bullish confirmation, aiming for the 3,375–3,459 zone.

XAUUSD Drops $55, Bearish Trend Continues!Yesterday, XAUUSD plummeted from $3,398 to $3,342 , losing more than $55 in just one trading session. This sharp decline pushed XAUUSD below a crucial support level , signaling significant weakness .
This drop confirms that gold is under strong selling pressure , with the market struggling to maintain upward momentum .
Additionally, the m/m CPI came in at 0.3% , higher than the expected 0.2% . This indicates inflation is rising faster than anticipated, increasing expectations that the Fed will continue raising interest rates.
This outcome could strengthen the USD , which typically leads to a drop in gold prices. This factor further supports the bearish outlook for XAUUSD.
The price is now approaching a near resistance level at $3,362 , a key point that may limit further upside potential. The near support is located at $3,310, and this will be tested if the price breaks through the resistance at $3,362.
Conclusion: With the combination of strong bearish price action, a stronger USD driven by CPI data, and technical structure supporting the downtrend, XAUUSD appears to be in a strong bearish trend. Risk management should be a priority as the price could test new lows near $3,310, and if this level breaks, the bearish trend could accelerate.

XAUUSD: BULLISH VIEW - Analysis on 12-Aug-2025 @ 3346.xxLTP: 3346.xx
Supports: 3264/3119
Resistances: 3410/3439/3500
As long as the supports hold, we can see 3500 (ultimate tgt 1)-570-3650 first.
Further targets:
3777 (ultimate tgt 2)-3830-3907
4010
4110-4155-4230
4434-4482-4655 (ultimate tgt 3)
5000+

Gold Plan 12/08 – Captain VincentGold Plan 12/08 – Captain Vincent ⚓
Background:
After sliding from the Storm Breaker 🌊, Gold has broken below the 3358 zone and successfully retested it. The ship is now heading straight towards the Buy Scalp – Quick Boarding 🚤 dock.
Today’s Plan: Only buy when price reaches the pre-defined support zones — no chasing in open waters.
Zone 1 – Quick Boarding 🚤 (Buy Scalp)
Entry: 3,333 – 3,331
SL: 3,327
TP: 3,336 → 3,339 → 3,342 → 3,345 → 3,348 → 33xx
Note: Fast in & out. Take partial profits at each TP hit.
Zone 2 – Golden Harbor 🏝️ (Main Buy Zone)
Entry: 3,311 – 3,309
SL: 3,305
TP: 3,315 → 3,319 → 3,323 → 3,327 → 3,331 → 33xx
Note: Main accumulation zone. Hold longer if buying momentum stays strong.
Today’s Scenarios:
If price hits Quick Boarding → Wait for a reversal signal (pin bar, engulfing) on M15/H1 before entering.
If price dips to Golden Harbor → Observe the bounce strength; enter only on clear confirmation.
If neither zone is touched → Stay on the shore; wait for the next voyage.
Captain’s Note:
“The Gold ship has left the 3358 waters, turning its bow towards Quick Boarding 🚤. If docking is smooth, the crew will sail out swiftly to the open seas. Golden Harbor 🏝️ remains the main refuge if stronger waves push deeper.”

Mastering the Art of Risk Management in Trading 1. Introduction: Why Risk Management is the Heart of Trading
Trading is not about making big profits quickly — it’s about staying in the game long enough to let your edge work for you.
Think of trading like a professional sport. Skill matters, but survival matters more. Even the world’s best traders lose trades; what separates them from amateurs is how they manage those losses.
In simple terms:
Good trading without risk management = gambling.
Average trading with strong risk management = long-term success.
Warren Buffett’s famous rules apply perfectly here:
Don’t lose money.
Never forget rule #1.
2. Core Principles of Risk Management
Before we go deep into strategies, let’s lock in the foundation.
2.1 Risk is Inevitable
Every trade carries risk. The goal is not to avoid it but to control its size and impact.
2.2 Asymmetry in Trading
A 50% loss requires a 100% gain to break even. This means avoiding large drawdowns is far more important than chasing big wins.
Loss % Required Gain to Recover
10% 11.1%
25% 33.3%
50% 100%
75% 300%
2.3 Risk per Trade
Most professional traders risk 0.5%–2% of their account per trade.
This ensures no single bad trade can destroy the account.
3. The Psychology of Risk
Risk management is not just math — it’s deeply psychological.
Loss Aversion Bias: Humans feel losses twice as strongly as gains. This can push traders into revenge trading.
Overconfidence Bias: Winning streaks can lead to oversized positions.
Fear of Missing Out (FOMO): Chasing trades without proper entry rules increases risk.
A great risk management system removes emotional decision-making by setting clear, mechanical rules.
4. Position Sizing: The Risk Control Lever
Position sizing determines how much capital to put into a trade. Even if your strategy is perfect, bad sizing can blow up your account.
4.1 Fixed Fractional Method
Risk a fixed % of capital per trade.
Example: If account = ₹10,00,000 and risk = 1% → Risk per trade = ₹10,000.
If Stop Loss = ₹50 away from entry, position size = ₹10,000 ÷ ₹50 = 200 shares.
4.2 Volatility-Based Position Sizing
Adjust position size according to the volatility of the asset (ATR – Average True Range).
If ATR = ₹25 and your risk budget = ₹5,000, position size = ₹5,000 ÷ ₹25 = 200 shares.
4.3 Kelly Criterion (Advanced)
Maximizes capital growth based on win rate & reward/risk ratio.
Formula: K% = W – (1 – W) / R
Where:
W = Win probability
R = Reward/Risk ratio
Caution: Kelly is aggressive; use fractional Kelly for real trading.
5. Stop Loss Strategies: Your Safety Net
A stop loss is not a sign of weakness — it’s a shield.
5.1 Fixed Stop Loss
Predefined point in price where you exit.
5.2 Volatility Stop Loss
Adjust stop distance using ATR to account for market noise.
5.3 Time-Based Stop
Exit after a fixed time if the trade hasn’t moved in your favor.
5.4 Trailing Stop
Moves with price in your favor to lock in profits.
Golden Rule: Place stops based on market structure, not emotions.
6. Reward-to-Risk Ratio (RRR)
The RRR tells you how much you stand to gain for every unit you risk.
Example:
Risk: ₹1000
Reward: ₹3000
RRR = 3:1 → Even a 40% win rate is profitable.
High RRR trades allow more losers than winners while staying profitable.
7. Diversification & Correlation Risk
7.1 Asset Diversification
Avoid putting all capital into one asset or sector.
7.2 Correlation Risk
If you buy Nifty futures and Bank Nifty futures, you’re effectively doubling your risk because they move together.
8. Risk Management for Different Trading Styles
8.1 Day Trading
Keep daily loss limits (e.g., 3% of capital).
Avoid revenge trading after a loss.
8.2 Swing Trading
Use wider stops to allow for multi-day fluctuations.
Position sizing becomes even more critical.
8.3 Options Trading
Risk can be higher due to leverage.
Always calculate max loss before entering.
9. Risk Management Tools
ATR Indicator – For volatility-based stops.
Position Size Calculators – To control exposure.
Heat Maps & Correlation Tools – To avoid overexposure.
Journaling Software – To track mistakes.
10. Risk-Adjusted Performance Metrics
Professional traders measure performance relative to risk taken.
Sharpe Ratio – Risk-adjusted returns.
Sortino Ratio – Focuses on downside volatility.
Max Drawdown – Largest account drop during a period.
11. Building a Personal Risk Management Plan
Your plan should cover:
Max % of capital risked per trade.
Max daily/weekly loss limit.
Position sizing rules.
Stop loss & target placement method.
Diversification guidelines.
Rules for scaling in/out.
Plan for handling drawdowns.
12. Advanced Concepts
12.1 Portfolio Heat
Sum of all open trade risks; keep it below a set % of account.
12.2 Value at Risk (VaR)
Estimates the max expected loss over a time frame.
12.3 Stress Testing
Simulate worst-case scenarios (e.g., gap downs, black swans).
Conclusion: Risk Management is Your Superpower
In trading, capital is ammunition. Risk management ensures you never run out of bullets before the big opportunities arrive.
Mastering it is not optional — it’s the difference between a short-lived hobby and a long-term career.
Buy GoldLet it go down and buy from there. Buy with small lot size and while managing your funds
Target 3351,3368,3375,3380,3390,3405,3430

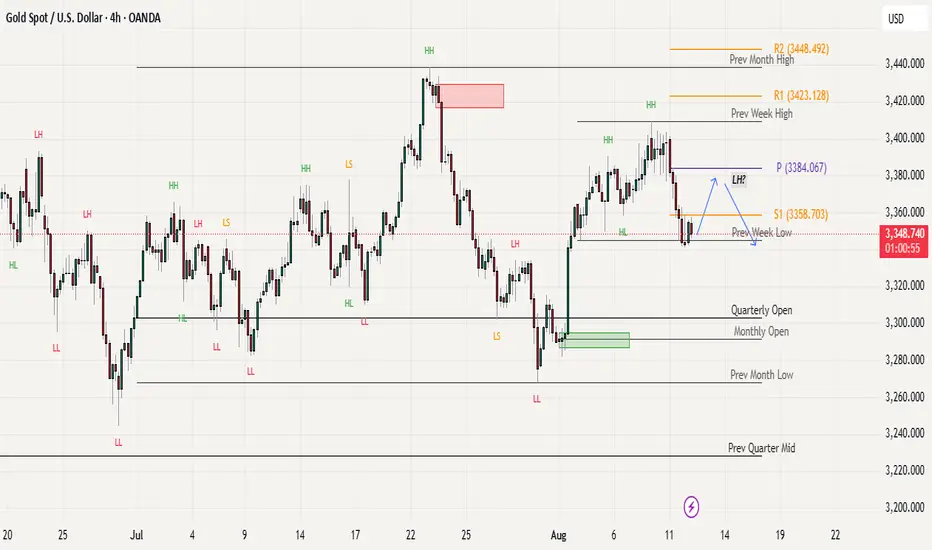
Gold Retreats to Range Zone: CPI Data Could Spark Next MoveGold has encountered strong resistance around the 3400 level and pulled back. The price has now re-entered the range zone again.
The technical picture shows gold ltaking support at 3340 support, while the 3400 level continues to act as a concrete resistance barrier above.
Yesterday's correction saw prices close below 3350, which raises some concern about near-term weakness. Today's CPI data release is expected to inject significant volatility into the market. For gold price structure, a pullback would be healthy to establish a lower high pattern as indicated on the chart, particularly if the gold intends to move lower.
On the upside, the weekly pivot at 3384 now is critical level to monitor, followed by the 3400 resistance zone. To the downside, we have to watch the 3330-3335 support area as the next key level that could determine golds immediate direction.
XAU/USD
This XAU/USD trade setup is a sell trade, showing a bearish outlook on gold prices. The entry price is 3350, the stop-loss is set at 3357, and the exit price is 3335. The trade aims for a 15-point profit while risking 7 points, giving a favorable risk-to-reward ratio of more than 1:2.
Selling at 3350 suggests the trader expects gold prices to move lower, possibly due to a stronger US dollar, firm bond yields, or reduced safe-haven demand in the market. The target at 3335 is placed near a potential support level where price could slow down or reverse, allowing the trader to secure profits.
The stop-loss at 3357 is positioned just above the entry to protect against unexpected upward movement. Since the stop is relatively tight, precise timing is essential—preferably after confirmation of resistance holding or a bearish candlestick pattern forming.
This setup is suitable for short-term trading, balancing profit potential with controlled risk. Sticking to the plan without emotional adjustments and following disciplined risk management can help achieve consistent success in XAU/USD trades.

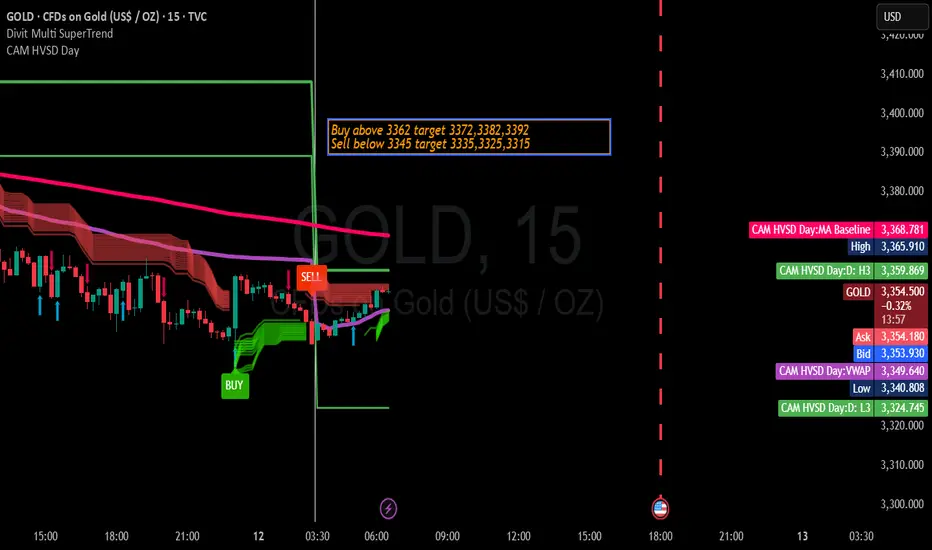
Gold Trading Strategy for 12th August 2025📈 Gold Trade Plan – Intraday Levels
💰 Buy Setup
✅ Condition: Enter Buy only if price closes above the High of the 1-Hour Candle and remains above $3362.
🎯 Targets:
$3372 🥇
$3382 🥈
$3392 🥉
📌 Example:
Suppose a 1-hour candle forms with a high of $3362 and the price closes above this level (e.g., at $3364). This confirms bullish momentum, and you may place a buy order targeting the given levels.
📉 Sell Setup
✅ Condition: Enter Sell only if price closes below the Low of the 15-Minute Candle and stays below $3345.
🎯 Targets:
$3335 🥇
$3325 🥈
$3315 🥉
📌 Example:
Suppose a 15-minute candle forms with a low of $3345 and the price closes below this level (e.g., at $3343). This confirms bearish momentum, and you may initiate a short trade aiming for the given targets.
📝 Tips for Execution
Wait for the candle to close before taking action — avoid premature entries.
Keep a Stop Loss slightly below the buy entry candle low (for buys) or above the sell entry candle high (for sells).
Avoid placing trades when market movement is sideways or in low volume conditions.
⚠ Disclaimer:
This trade setup is for educational purposes only and is not financial advice. Trading commodities, currencies, and stocks carries significant risk. You can lose more than your initial investment. Past results are not indicative of future performance. Always do your own analysis before trading.
XAUUSD GOLD ANALYSIS ON (12/08/2025)#XAUUSD UPDATEDE
Current price - 3355
If price stay below 3375, then next target 3332,3320 and above that 3390
Plan;If price break 3360-3365 area, and stay below 3360, we will place sell order in gold with target of 3332 and 3320 & stop loss should be placed at 3375

Gold LongEntry- 3355-3352
SL- 3349
Target- 3368, 3370, 3375
Reason- Gold has broken out of a falling trendline in 1hr TF with a strong candle. News is also there that trump is not going to put tariff on gold bars.
Disclaimer- This is just for educational purposes please take advice before making any decision.
Jai Shree Ram.
