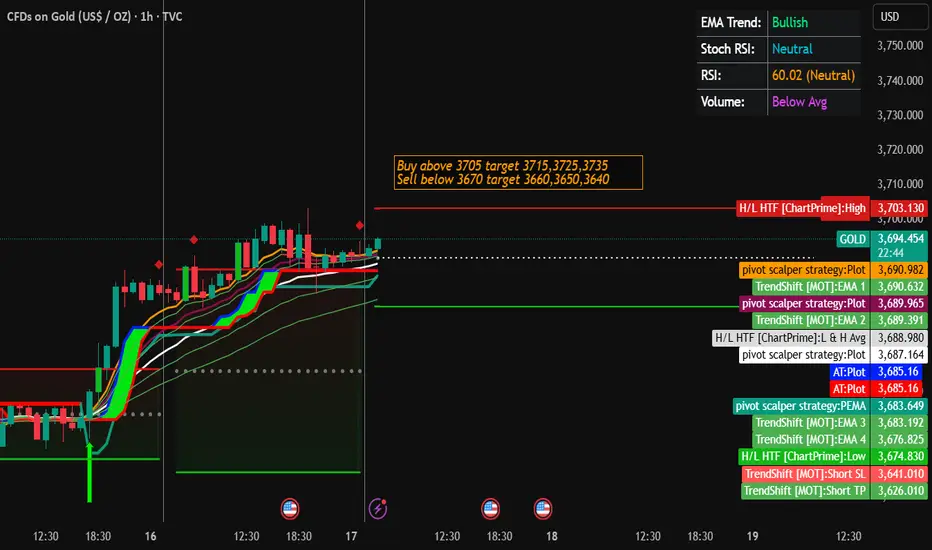
Gold Trading Strategy for 17th September 2025✨ GOLD TRADING STRATEGY ✨
📈 BUY Setup
➡️ Entry: Buy above the high of the 1-hour closing candle
🎯 Targets:
1st Target – 3715
2nd Target – 3725
3rd Target – 3735
📉 SELL Setup
➡️ Entry: Sell below the low of the 1-hour closing candle
🎯 Targets:
1st Target – 3660
2nd Target – 3650
3rd Target – 3640
⚠️ Disclaimer
📌 This is for educational and informational purposes only.
📌 Not a buy/sell recommendation.
📌 Trading in commodities, forex, or stock markets involves risk; please do your own research or consult with a financial advisor before taking positions.
CFDGOLD trade ideas
XAUUSD 09/24 – Scenario after the Fed's Key SpeechHello everyone,
Gold continues its upward momentum in recent sessions. Yesterday, the price touched the 1.618 Fibonacci level on the H4 chart and then declined, indicating a slight rejection right after the PMI news.
Technical Perspective
The Wolfe Waves structure remains intact, not yet broken.
If the price returns inside the trendline, the signal confirming the Wolfe pattern will become clearer.
Current key resistance area: 3790 – 3825, coinciding with Fibonacci 361.8.
Noteworthy short-term support area: 3650 – 3647.
Fundamental Perspective
In yesterday's speech, Chairman Powell emphasised: “If monetary policy is eased too quickly, efforts to curb inflation will fail.”
This indicates that the Fed continues to prioritise price stability over the market's expectations for rate cuts. This is a factor to consider when trading gold in the current phase.
Today's Trading Scenario
Sell Setup
Entry: 3825 – 3827
SL: 3833
TP: 3810 – 3790 – 3768 – 3755
Buy Setup
Entry: 3650 – 3647
SL: 3642
TP: 3672 – 3688 – 3695 – 3710 – 3750
Summary
In the short term, gold is in a correction phase after hitting resistance. Prioritise observing signals around 3790 – 3825 to find Sell opportunities, while 3650 is a notable buying point for a recovery scenario.
This is today's XAUUSD trading scenario according to the Wolfe Waves model. You can refer to and adjust according to your personal strategy.
Follow me for the latest analyses as the market changes.
Wishing you successful trading!

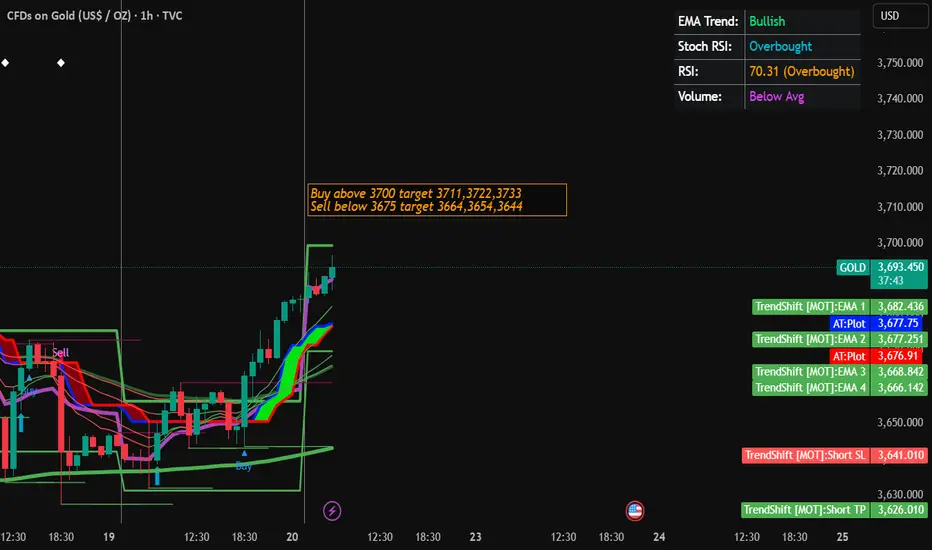
Gold Trading Strategy for 22nd September 2025GOLD TRADING STRATEGY (1-HOUR CHART)
🟢 BUY SETUP – Step by Step
🔍 Condition to Enter a Buy Trade:
Wait for a 1-hour candle to close above 3700.
Don’t rush — confirmation happens only after the candle closes, not during.
🚀 Buy Entry Point:
Place your Buy order slightly above the high of that confirmed candle.
This ensures momentum is in your favor.
🎯 Profit Targets for Buy Trade:
🎯 Target 1: 3711 → Quick intraday target.
🎯 Target 2: 3722 → Medium profit booking.
🎯 Target 3: 3733 → Extended move target.
🛑 Stop Loss (SL):
Place SL just below the breakout candle’s low.
This protects you if price reverses suddenly.
🔴 SELL SETUP – Step by Step
🔍 Condition to Enter a Sell Trade:
Wait for a 1-hour candle to close below 3675.
Confirmation is only valid after the candle closes below.
📉 Sell Entry Point:
Place your Sell order slightly below the low of that confirmed candle.
This ensures the bearish momentum is active.
🎯 Profit Targets for Sell Trade:
🎯 Target 1: 3664 → First level target.
🎯 Target 2: 3654 → Deeper decline.
🎯 Target 3: 3644 → Extended move target.
🛑 Stop Loss (SL):
Place SL just above the breakdown candle’s high.
This avoids large losses if trend reverses.
📌 Risk Management & Trading Tips
✅ Risk per trade: Never risk more than 1–2% of your capital.
✅ Position sizing: Adjust lot size according to your risk.
✅ Patience: Enter only after the 1-hour candle closes.
✅ Trail SL: Move stop loss in profit direction as price moves toward targets.
⚠️ Disclaimer
📢 This content is for educational purposes only.
📢 It is not financial advice or a guaranteed strategy.
📢 Trading in Gold and financial markets involves high risk.
📢 Always do your own analysis before taking any position.
📢 Past performance does not guarantee future results.
✨ Pro Tip: Mark levels 3700 (Buy Zone) and 3675 (Sell Zone) on your chart.
Wait for clear 1-hour candle closures before acting — this filters out false signals.
GoldDaily bias Bullish
4H structure Look's good for buys
have a clean 15M BFVG
and entry pattern is 15M englufying candle

XAUUSD Forecast – Gold Price Action and Market InsightsXAUUSD Forecast – Gold Price Action and Market Insights
Gold is showing signs of stabilization after recent fluctuations, with price consolidating around the mid-range levels. The chart highlights repeated sequences of structural breaks and shifts, indicating that liquidity has been actively swept on both the buy and sell side.
The latest market move shows a controlled decline, followed by an attempt to absorb selling pressure. Current positioning suggests the possibility of a short-term liquidity grab to the downside, which could fuel a stronger recovery leg in the sessions ahead.
The projected outlook favors a scenario where buyers regain momentum, aiming to retest the upper price zones. If this momentum develops, the market may establish a renewed upward leg in alignment with the broader bullish cycle observed across higher timeframes.
From a macro perspective, gold continues to be supported by demand for safe-haven assets amid ongoing global financial uncertainty and shifting monetary policies. This backdrop enhances the probability of gold sustaining its mid-term bullish trajectory despite temporary corrective phases.

XAUUSD GOLD Analysis on (18/09/2025)#XAUUSD UPDATEDE
Current price - 3659
If price stay below 3680, then next target 3640,3620 and above that 3700
Plan;If price break 3659-3665 area, and stay below 3660, we will place sell order in gold with target of 3640 and 3620 & stop loss should be placed at 3700

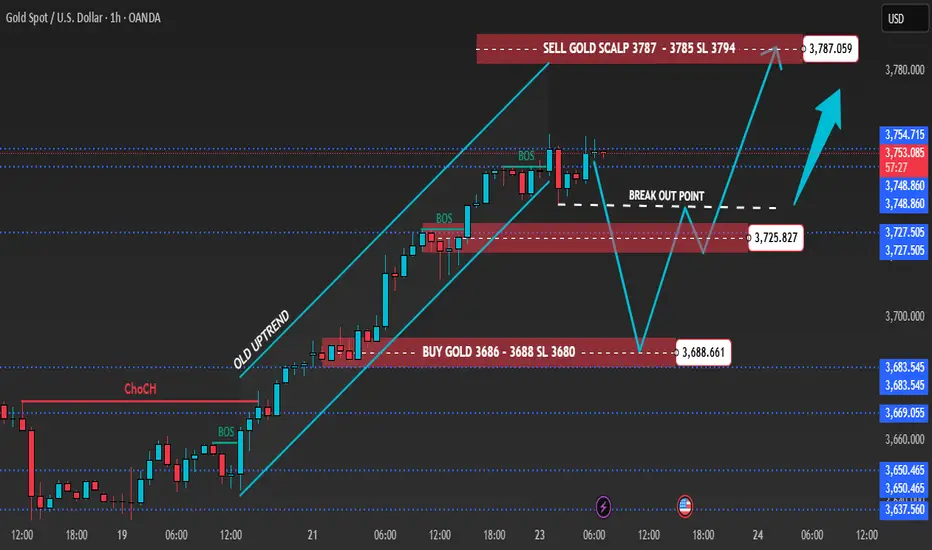
Gold 1H – Inflation Worries & Risk Sentiment Guide MovesGold on the 1H chart is hovering near 3,753 after multiple BOS confirmations, holding a firm bullish bias yet approaching premium resistance. Liquidity sits above 3,787–3,785, while fresh demand zones are placed at 3,725–3,723 and deeper at 3,688–3,686.
Today’s narrative around sticky U.S. inflation expectations and renewed geopolitical tensions in Eastern Europe is boosting safe-haven appetite. Still, intraday price action suggests possible liquidity sweeps into resistance before price retraces back towards demand zones.
________________________________________
📌 Key Structure & Liquidity Zones (1H):
• 🔴 SELL SCALP 3,787–3,785 (SL 3,794): Premium resistance where liquidity runs may spark short-term selling towards 3,780 → 3,775 → 3,770.
• 🟢 BUY ZONE 3,725–3,723 (SL 3,718): Pullback demand aligned with structure, favouring longs towards 3,740 → 3,755 → 3,770+.
• 🟢 BUY ZONE 3,688–3,686 (SL 3,680): Deeper discount demand area, attractive for positional buys targeting 3,700 → 3,715 → 3,730+.
________________________________________
📊 Trading Ideas (Scenario-Based):
🔺 Buy Setup – Pullback Demand (3,725–3,723)
• Entry: 3,725–3,723
• Stop Loss: 3,718
• Targets:
TP1: 3,740
TP2: 3,755
TP3: 3,770+
🔺 Buy Setup – Discount Demand (3,688–3,686)
• Entry: 3,688–3,686
• Stop Loss: 3,680
• Targets:
TP1: 3,700
TP2: 3,715
TP3: 3,730+
🔻 Sell Setup – Liquidity Sweep (3,787–3,785)
• Entry: 3,787–3,785
• Stop Loss: 3,794
• Targets:
TP1: 3,780
TP2: 3,775
TP3: 3,770
________________________________________
🔑 Strategy Note
Rising inflation concerns and safe-haven flows from geopolitical risks are keeping gold buyers in play. However, smart money could drive engineered stop-hunts near premium resistance before retracements set in. The bias remains buy-on-dips around key supports, while short-term scalps against liquidity sweeps near 3,787–3,785 should be approached with caution. Volatility is expected as markets digest U.S. inflation updates and risk headlines.
Gold hits record 3,759 | Safe-haven flows surge back🟡 XAU/USD – 23/09 | Captain Vincent ⚓
🔎 Captain’s Log – Context & News
Today Gold surged nearly +2% , hitting a record $3,759/oz .
Geopolitical tensions : Israel launched missiles into Lebanon, killing 5 (including 4 US citizens) → safe-haven demand rushed back into Gold.
USD weakened , capital flowed out of stocks & bonds → strong support for precious metals.
ETFs & speculators : heavy buying amplified the rally.
Silver : jumped to its highest level in 14 years, reinforcing strength in the precious metals sector.
⏩ Captain’s Summary : Gold is fueled by geopolitics, macro factors, and safe-haven demand. But after a hot rally, the big question: continue breaking highs or face sharp swings if the FED shifts tone?
📈 Captain’s Chart – Technical Analysis (H45)
Storm Breaker (Resistance / Sell Zone)
3,771 – 3,787 (Fibo 0.5–0.618 confluence, ATH test zone)
Golden Harbor (Support / Buy Zone)
Near support: 3,740 (previous high turned support)
OB Dock: 3,717 – 3,723
Breakout Harbor: 3,689 – 3,691
Market Structure
Gold broke out to Higher High around 3,755 – 3,759.
Main trend remains bullish, but prone to volatility / pullback after a hot rally.
🎯 Captain’s Map – Trade Plan
✅ Buy (trend-follow priority)
Buy Zone 1 (OB)
Entry: 3,717 – 3,723
SL: 3,707
TP: 3,725 – 3,730 – 3,735 – 3,740 – 3,750
Buy Zone 2 (Breakout Retest)
Entry: 3,689 – 3,691
SL: 3,678
TP: 3,699 – 3,710 – 3,7xx
⚡ Sell (short-term scalp if overbought)
Sell Zone (ATH test)
Entry: 3,783 – 3,785
SL: 3,795
TP: 3,759 – 3,740 – 3,717
⚓ Captain’s Note
“The geopolitical storm pushed the Golden sails past 3,759. Golden Harbor 🏝️ (3,717 – 3,689) is the safe dock for sailors to board the northbound trend. Storm Breaker 🌊 (3,771 – 3,787) may raise heavy waves, suitable for short Quick Boarding 🚤 scalps. The main voyage remains bullish, but after a hot rally, sailors must keep a firm hand on the helm to avoid being thrown off by choppy swings.”

Gold Sets New Record: Rate Hopes Driving Price HigherHello, traders!
Gold surged to a record high of $3,726.19/oz on September 22, fuelled by growing investor expectations for a clearer Fed rate-cutting path. Traders are now betting on two more rate cuts this year with a very high probability.
The growth drivers have shifted from being primarily central bank and Asian demand to now include strong buying from Western investors, as shown by increased holdings in gold ETFs. Upcoming speeches from Fed officials and the core PCE inflation data this week will be key in determining the market's next direction.
Technical Analysis & Strategy
Gold is in a strong uptrend and is continuously setting new highs. While there was a minor correction, the bullish momentum remains intact. Shorting near resistance levels is highly risky.
Outlook: Continue to prioritize Buy positions if gold holds above $370x.
Resistance: $3785, $3794, $3804
Support: $3774, $3764, $3754
Suggested Trading Strategy:
Buy Scalp: Zone $3765 - $3763, SL $3759
Buy Zone: Zone $3754 - $3752, SL $3744
Sell Zone: Zone $3800 - $3802, SL $3810
The market is highly volatile. Do you think gold can hit the $3,800 mark this week? Share your thoughts! 👇
#Gold #XAUUSD #Fed #GoldAnalysis #TradingView #InterestRates #Inflation #ATH


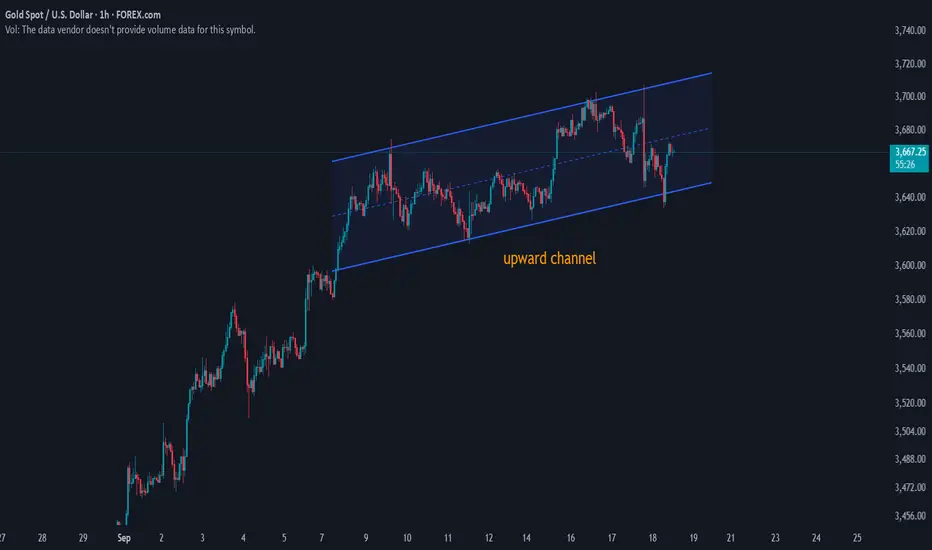
Gold Rebounds Within Upward Channel – Eyes on $3,700+Gold (XAUUSD) is holding inside its upward channel on the 1H timeframe, bouncing strongly off the lower boundary near $3,640. The bullish structure remains intact as long as price respects channel support, keeping $3,700+ in play.
Technical Setup:
Price continues to trend within a rising channel since early September.
The recent dip tested the lower band near $3,640, where buyers stepped back in.
Current price action shows momentum building toward the channel midpoint (~$3,680).
A decisive breakout above $3,685–3,700 could trigger further upside toward $3,720–3,740.
Key Levels to Watch:
Support: $3,640, $3,610, $3,600
Resistance: $3,685, $3,700, $3,720–3,740
Takeaway:
Gold’s trend remains bullish while holding above $3,640. A push above $3,700 confirms bullish continuation toward $3,720–3,740. A close below $3,640 shifts bias bearish toward $3,600.
#Gold #XAUUSD #Commodities #TradingStrategy
XAUUSD – Pressure at the 3777 zone, adjustment scenario and trenXAUUSD – Pressure at the 3777 zone, adjustment scenario and trend-following buy
Technical Analysis
After a strong rally, gold (XAUUSD) is now approaching the resistance zone of 3777–3780, where it converges with the Fibonacci expansion cluster and the old resistance structure. This is a price zone prone to short-term selling pressure and is a decisive point for the next trend.
EMA200 (H1: 3685) is still clearly sloping upwards → the main trend remains bullish, but the market is in a state of range expansion, with the possibility of a correction before continuing upward.
RSI (14) is currently oscillating around 57–60, indicating that the upward momentum has cooled, not yet entering the overbought zone but posing a risk of divergence if the price forms a new peak without accompanying momentum.
The Volume Profile levels and support zones 3738–3740 / 3719–3722 / 3661–3665 will be where buyers can react to protect the main trend.
Trading Scenarios
Scenario 1 – Sell adjustment at resistance zone:
Entry: 3777–3780
SL: 3784
TP: 3755 – 3742 – 3730 – 3705
Scenario 2 – Short-term Buy scalping:
Entry: 3738–3740
SL: 3734
TP: 3747 – 3755 – 3770
Scenario 3 – Trend-following Buy (preferred when deep correction):
Entry: 3719–3722
SL: 3715
TP: 3728 – 3740 – 3765 – 3780
Price Zones to Watch
3777–3780: important resistance, potential Sell zone.
3738–3740: near support, suitable for Buy scalping.
3719–3722: main Buy zone for recovery, confluence with support structure.
3705: deep support, target if correction trend expands.
Outlook
The major trend for gold still leans towards bullish, however, the 3777–3780 zone currently plays a decisive role. Sellers can take advantage of short-term Sell to catch the correction, while buyers should wait for the price to retreat to support zones to enter trend-following orders.
This is a reference scenario based on technical analysis, not an investment recommendation. Stay tuned for earlier analyses and prepare well for your trading plan.

Gold Trading Strategy for 23rd Sember 2025GOLD TRADING STRATEGY
🟢 Buy — Enter only when a 15-minute candle closes above 3765; buy a tick/point above that candle’s high. Targets: 3775, 3785, 3800.
🔴 Sell — Enter only when a 1-hour candle closes below 3728; sell a tick/point below that candle’s low. Targets: 3715, 3703, 3685.
BUY SETUP — 15-minute candle (very detailed)
🔎 Condition to enter
Wait for a 15-minute candle to close above 3765.
Only after the candle closes above 3765 do you prepare to buy.
🧭 Entry execution
Identify the high of that confirmed 15-min candle (call it C_high).
Place a Buy-Stop order a small tick above the candle high (e.g., Entry = C_high + 1 tick), so your order triggers only if price continues up.
🛡 Stop-loss (SL)
Place SL just below the low of the same candle (call it C_low - 1 tick).
This is a clean, candle-based SL — simple for beginners to manage.
🎯 Targets
Target 1: 3775
Target 2: 3785
Target 3: 3800
SELL SETUP — 1-hour candle (very detailed)
🔎 Condition to enter
Wait for a 1-hour candle to close below 3728.
Only after the hourly candle closes below 3728 do you prepare to sell.
🧭 Entry execution
Identify the low of that confirmed 1-hour candle (H_low).
Place a Sell-Stop order a small tick below H_low (e.g., Entry = H_low − 1 tick).
🛡 Stop-loss (SL)
Place SL just above the high of the same 1-hour candle (H_high + 1 tick).
🎯 Targets
Target 1: 3715
Target 2: 3703
Target 3: 3685
⚠️ Disclaimer (READ CAREFULLY)
📢 This content is for educational purposes only and is not financial advice. Trading gold or any financial instrument involves substantial risk — you can lose more than your initial capital. Use proper risk management (e.g., limit risk per trade to 1–2% of your account). Always verify instrument point/contract value with your broker and consider consulting a licensed financial advisor before trading. Past results do not guarantee future performance.

PCR Trading Strategies1. Strategic Approaches to Options Trading
Options strategies can be simple or complex, depending on the trader’s risk tolerance, market outlook, and capital. These strategies are categorized into basic, intermediate, and advanced levels.
1.1. Basic Strategies
Buying Calls and Puts: Simple directional trades.
Protective Puts: Hedging against portfolio declines.
Covered Calls: Generating income from existing holdings.
1.2. Intermediate Strategies
Spreads: Simultaneous buying and selling of options to limit risk and reward.
Vertical Spread: Buying and selling options of the same type with different strike prices.
Horizontal/Calendar Spread: Exploiting differences in time decay by using options of the same strike but different expiration dates.
Diagonal Spread: Combining vertical and horizontal spreads for strategic positioning.
Collars: Combining protective puts and covered calls to limit both upside and downside.
1.3. Advanced Strategies
Iron Condor: Selling an out-of-the-money call and put while buying further OTM options to limit risk, profiting from low volatility.
Butterfly Spread: Exploiting low volatility by using three strike prices to maximize gains near the middle strike.
Ratio Spreads and Backspreads: Advanced plays to profit from skewed market expectations or strong directional moves.
2. Identifying Option Trading Opportunities
Successful options trading requires analyzing market conditions, volatility, and liquidity. Key factors include:
2.1. Market Direction and Momentum
Use technical indicators (moving averages, RSI, MACD) to gauge trends.
Trade options in alignment with market momentum for directional strategies.
2.2. Volatility Analysis
Historical Volatility (HV): Measures past price fluctuations.
Implied Volatility (IV): Market’s expectation of future volatility.
Opportunities arise when IV is underpriced (buy options) or overpriced (sell options).
2.3. Earnings and Event Plays
Companies’ earnings announcements, product launches, or macroeconomic events create volatility spikes.
Strategies like straddles or strangles are ideal to capitalize on such events.
2.4. Liquidity and Open Interest
Highly liquid options ensure tight spreads and efficient entry/exit.
Monitoring open interest helps identify support/resistance levels and market sentiment.
3. Risk Management in Options Trading
While options offer significant opportunities, risk management is crucial:
Position Sizing: Limit exposure to a small percentage of capital.
Defined-Risk Strategies: Use spreads and collars to control maximum loss.
Stop-Loss Orders: Protect against rapid adverse movements.
Diversification: Trade multiple assets or strategies to reduce concentration risk.
Implied Volatility Awareness: Avoid buying expensive options during volatility spikes unless justified by market events.

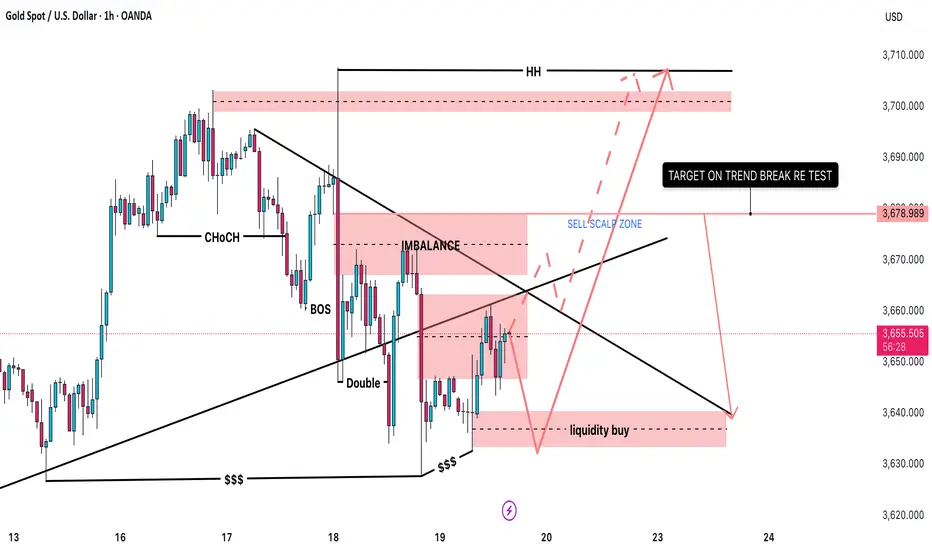
GOLD - Breakout / Swept High appear - Where to BUY ? 🟡 OANDA:XAUUSD XAUUSD Daily Plan – September 19, 2025
1. Market Overview
Price is consolidating around 3655 – 3660 after forming a short-term bearish structure.
On H1, several supply & demand zones are highlighted:
Liquidity Buy Zone around 3640 (potential demand).
Imbalance / Supply Zone around 3670 – 3680.
The overall higher-timeframe trend remains bullish, but in the short term, the market is retesting liquidity areas.
2. Key Levels & Zones
Liquidity Buy Zone: 3640 – 3645 → key support.
Sell Scalp Zone / Imbalance: 3670 – 3680 → short-term resistance.
Higher High Target (HH): 3700 – 3710 → strong higher-timeframe resistance.
Longer-term Support: 3620 – 3630.
3. Main Trading Scenarios
🟢 Long Setup (trend-aligned)
Wait for price to retest Liquidity Buy zone 3640 – 3645.
If reversal signals appear (pin bar, engulfing, etc.), consider opening Long.
Targets:
Short-term: 3678 (trendline break retest).
Mid-term: 3700 – 3710 (HH).
🔴 Short Setup (scalp only)
If price retraces into Sell Scalp Zone 3670 – 3680 and shows strong rejection → Short scalp opportunity.
Target: 3640 – 3645.
Note: Short trades are counter-trend, so manage quickly.
4. Trade Management Notes
Prioritize Longs from support zones since the higher-timeframe trend is still bullish.
Shorts should only be seen as short-term scalp opportunities near resistance.
Risk management: limit to 1–2% per trade, avoid holding against the main trend.
📌 Conclusion: XAUUSD is currently testing the descending trendline and resistance area. A successful breakout could target 3700+. Otherwise, the market is likely to revisit 3640 before launching the next bullish leg.
XAUUSD –Today’s Trading Outlook | Sell Fill Liquidity & Buy Zone
Hello traders,
In the recent sessions, gold has continued to show strong volatility around important liquidity zones and support–resistance levels. The current structure indicates that sellers remain in control in the short term, while buyers are expected to return only if price reaches deeper support areas.
Technical View
Main Resistance: 3670 – 3680, aligning with the FVG zone → key area for Sell to Fill Liquidity.
Short-term Support: 3630 – 3627. A break below could open the way for a deeper decline.
Buy Scalping Zones: 3613 – 3615 and 3595 – 3598, suitable for quick intraday longs.
Medium-term Buy Zone: 3600 – 3590, confluence with strong liquidity zone and major support.
MACD Indicator: leaning bearish, with a negative histogram, showing selling pressure still dominant.
Trading Scenarios
Sell Setup (priority)
Sell Liquidity Zone: 3670 – 3680
SL: 3685
TP: 3650 – 3635 – 3627 – 3615 – 3600
Buy Scalping
Buy Zone 1: 3613 – 3615 | SL: 3608 | TP: 3625 – 3638 – 3645
Buy Zone 2: 3595 – 3598 | SL: 3590 | TP: 3610 – 3625 – 3638 – 3645 – 3670
Medium-term Buy
Zone: 3600 – 3590
SL: 3584
Extended TP: 3633 – 3660 – 3675
Conclusion
In the short term, gold is likely to retest the upper liquidity zone before continuing with further declines. Sellers remain in control for now, but deeper support zones will provide potential entry levels for medium-term buyers.
Keep a close watch on these key levels and align your trades with your personal strategy.
Follow along to get the earliest updates whenever market structure changes.

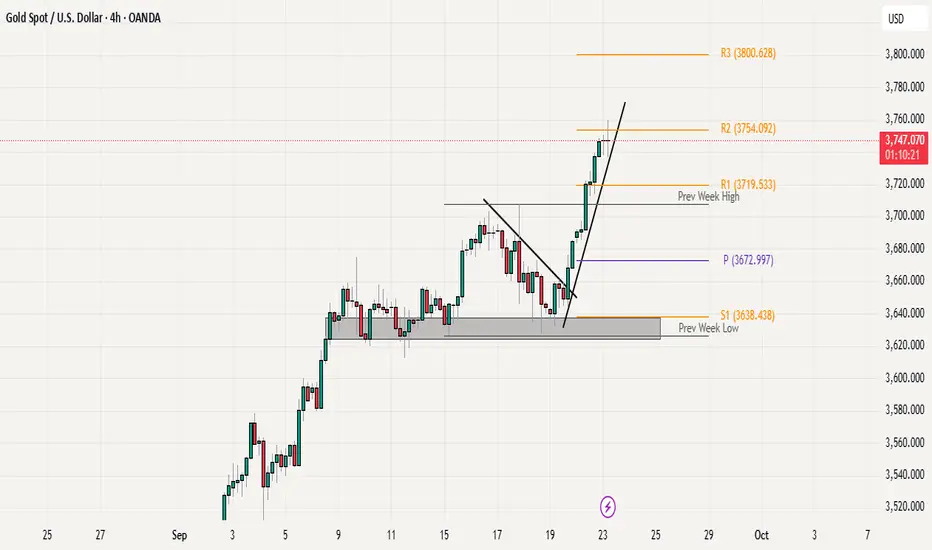
Bullish Momentum Intact: Watching R2 for continuation or pause Gold continued its upside momentum after a clean breakout above the previous week’s high, leading to a strong one-way rally towards the weekly R2 level at 3754. At the moment, price is holding well above the rising trendline, showing no signs of major rejection or reversal. The immediate resistance remains at weekly R2, and a sustained break above this level could open the door for a move towards weekly R3 around 3800.
The overall structure is still bullish, with higher highs and higher lows firmly intact. For any meaningful correction to take place, price would first need to break below the rising trendline. A deeper retracement would require price to trade back under the previous week’s high, which would then shift the short-term bias toward the weekly pivot zone near 3672. Until then, dips are likely to be seen as buying opportunities.
Go long on gold, but be wary of potential declines.Go long on gold, but be wary of potential declines.
Spot gold prices have hit consecutive record highs in the past hour. This strong rally is primarily driven by the following factors:
1: The market currently prices a 91.9% probability of another Fed rate cut in October. This expectation will depress the US dollar and real yields, thereby increasing gold's appeal.
2: Friday's release of US core PCE inflation data will be a key factor. If the data shows slowing inflation, it will further reinforce expectations of rate cuts, which will benefit gold.
Key Support: Safe-Haven Demand: Ongoing geopolitical risks and global economic uncertainty are driving investors to allocate gold as a safe-haven asset.
Currency Market Signals: Gold's rise is primarily driven by demand from central banks and Asia, while Western investors are also increasing their gold holdings through channels such as gold ETFs.
Simply put, the current gold market presents a situation where "long-term logic is sound" and "short-term technical overbought" coexist.
Key Strategy: Follow the trend, but be wary of pullbacks.
The current market trend is bullish, so the strategy should primarily focus on buying dips, avoiding blindly speculating on tops and shorting. However, we must also be prepared for possible technical pullbacks.
Buy on Dips (Primary Strategy)
This strategy is suitable for entering the market when gold prices moderately retreat from their highs and find support before rising again.
Timing of Entry:
Best entry: When prices retreat to the $3705-3710 area (strong support during the Asian and European trading sessions) and a bullish candlestick pattern (such as a hammer or bullish engulfing candlestick pattern) appears on the 5-minute or 15-minute chart.
Second option: Enter after a strong breakout above the previous intraday high (such as $3726), and a minor pullback confirms this move.
A more conservative option: Enter if prices experience a deep pullback to the more critical support level of $3685-3695 (the resistance-turned-support level broken yesterday), then stabilize and rebound.
Stop-loss Setting:
Set your stop-loss $5-8 below your entry price. For example, if you go long at $3710, set your stop-loss at $3702.
The absolute bottom line: Stop-loss should not be set below $3673 (the bull-bear watershed). If it falls below, the short-term trend may weaken.
Target Price Levels:
First target: $3730-3735 (a new all-time high to attract buying).
Second target: $3740-3750 (a psychological round number).
Use a trailing stop: As the price moves in your favor, gradually raise your stop-loss to protect your profits.
Data Risk: Friday's US core PCE price index is the biggest variable.

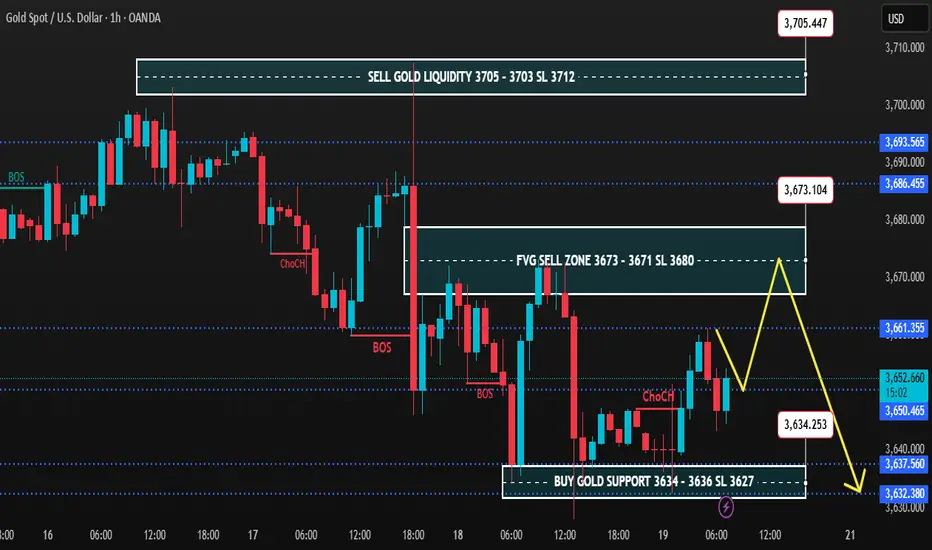
Gold 1H – Risk of Premium Sweeps Before ReversalOn the 1H timeframe, gold is consolidating after consecutive BOS and ChoCH signals, showing rejection from premium levels. The market is oscillating between the fresh FVG sell zone at 3,673–3,671 and the deep discount support at 3,634–3,636. Liquidity remains positioned above 3,705 and below 3,632, keeping scope for engineered sweeps before a clearer directional move emerges.
________________________________________
📌 Key Structure & Liquidity Zones (1H):
• 🔴 FVG SELL ZONE 3,673 – 3,671 (SL 3,680)
Premium intraday pocket for rejection, targeting 3,660 → 3,650 → 3,640.
• 🔴 SELL GOLD LIQUIDITY 3,705 – 3,703 (SL 3,712)
Major premium liquidity trap, likely to precede continuation lower towards 3,690 → 3,675 → 3,660.
• 🟢 BUY GOLD SUPPORT 3,634 – 3,636 (SL 3,627)
Discount demand zone, aiming for recovery towards 3,645 → 3,660 → 3,670 if defended.
________________________________________
📊 Trading Ideas (Scenario-Based):
🔻 Sell Setup – FVG Rejection (3,673–3,671)
• Entry: 3,673 – 3,671
• Stop Loss: 3,680
• Targets:
TP1: 3,660
TP2: 3,650
TP3: 3,640
👉 Expect engineered liquidity grab into the FVG before downside extension.
🔻 Sell Setup – Premium Liquidity Sweep (3,705–3,703)
• Entry: 3,705 – 3,703
• Stop Loss: 3,712
• Targets:
TP1: 3,690
TP2: 3,675
TP3: 3,660
👉 Smart money may sweep highs near 3,705 before resuming bearish leg.
🔺 Buy Setup – Discount Reversal (3,634–3,636)
• Entry: 3,634 – 3,636
• Stop Loss: 3,627
• Targets:
TP1: 3,645
TP2: 3,660
TP3: 3,670
👉 High risk-reward opportunity if gold defends discount demand; suitable for counter-trend scalps.
________________________________________
🔑 Strategy Note
Gold remains under pressure below 3,673–3,705, favouring short setups into premium sweeps. However, close attention is needed at 3,634–3,636, as buyers may attempt to accumulate and reclaim structure. Best practice: trade smaller lots until the New York session provides confirmation of direction.
Elliott Wave Analysis XAUUSD – September 18, 2025
Momentum
• D1: Currently, D1 momentum is declining, therefore a downward move is likely to extend over the next 4–5 days.
• H4: Momentum is falling, so today we may see further downside to push momentum into the oversold zone before a potential reversal.
• H1: Momentum is still heading down, suggesting the bearish move is likely to continue.
________________________________________
Wave Structure
• D1: With momentum turning lower, it is highly probable that wave v black has completed and price has entered a corrective ABC phase. If this is the case, the correction will likely last for at least more than one week.
• H4: A 5-wave structure (1–2–3–4–5) within wave v black has been completed. The current decline could be wave A of the correction. We need to observe closely to confirm whether wave A is done. Note: during corrective phases, trading becomes more difficult; targets beyond 500 pips are rarely achieved as price tends to overlap. Toward the end of corrections, price often compresses and whipsaws both sides, so trade with smaller positions and manage risk carefully.
• H1:
o Scenario 1: Wave 1 of wave (5) black has formed, and the market is now in wave 2. This scenario is invalidated if price breaks below 3626.
o Scenario 2: Wave v black has already completed with a 5-wave structure. Price is now in a larger corrective phase (i–ii–iii–iv–v black on the D1). In this case, the correction will likely last longer than previous waves ii and iv – an important guide to prepare for an extended bearish or sideways phase.
On H1, the current drop is steep and impulsive, likely part of a 5-wave structure. The recovery was capped at the 38.2% Fibonacci retracement, which indicates:
• If this is wave 4 of the decline, price will break below 3649, with wave 5 of A projected toward 3632 → Buy zone.
• If price breaks above the minor high at the 38.2% Fibonacci level, it is more likely wave B of an ABC correction. In that case, the upside targets would be 3677 or 3694 → Sell zones.
⚠️ Note: Once price hits one target, the opposite entry setup will be canceled.
________________________________________
Trading Plan
Buy Zone:
• Entry: 3633 – 3630
• SL: 3620
• TP: 3649
Sell Zone 1:
• Entry: 3676 – 3679
• SL: 3686
• TP: 3657
Sell Zone 2:
• Entry: 3693 – 3696
• SL: 3703
• TP: 3677

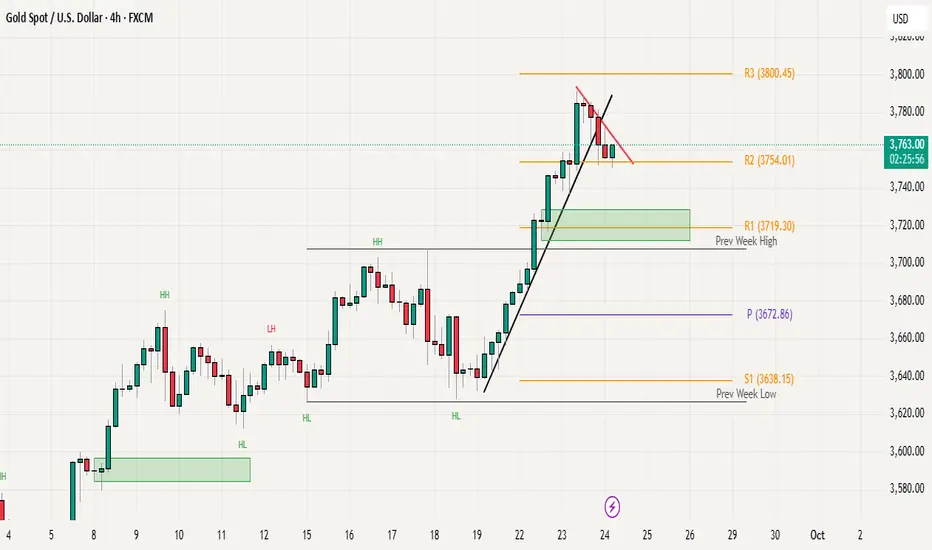
Gold Price Action: Trendline Break but Bulls Still in ControlGold posted a fresh all-time high yesterday near 3790 before entering a healthy pullback phase after an extended intraday rally. The higher-timeframe structure remains constructive, with the market still maintaining its higher-highs and higher-lows sequence. However, price action has broken below the rising trendline support we discussed in yesterday’s update, signaling a short-term pause in momentum.
At the moment, gold is consolidating just above R2 (3754), which continues to act as an important intraday support. For bulls to regain momentum and extend the rally, price needs to break above the declining red resistance trendline and sustain above the 3790–3800 zone. A breakout here could open the door for further upside continuation.
On the other hand, a confirmed H4 close below 3750 could invite deeper profit-taking, with the 3700–3710 area (previous week’s high) remaining the key demand zone and primary downside support.
Overall, the broader trend remains bullish, but price action is currently in a consolidation phase. Watching for either a breakout above resistance or a close below 3750 will provide clarity on the next directional move.
XAUUSD - Flag PatternWhats your take on Guys.
#Institutions Consolidation going on - #Accumulation or #Distribution.
Kind of #Triangle #pattern in formation, ##Flagpattern. DO your analysis, Enter trade on Breakout and confirmation side. Trade with #confluence. i would say accumulate at bottom of pattern with SL and Participate in full swing before #Breakout.

Gold technical analysis Gold has been up n up side many reason for upside rally U.S economy, Trump tariffs , Ukraine Russia war . But again I see upside gold $3695 major resistance and support both. And then fly up to 3732. And new design represents “ lights of diva “. 🔥
