GOLD/USD Bearish Rejection From Resistance Zone – Potential DropGOLD/USD Bearish Rejection From Resistance Zone – Potential Drop Ahead! 🎯
📊 Technical Analysis Summary:
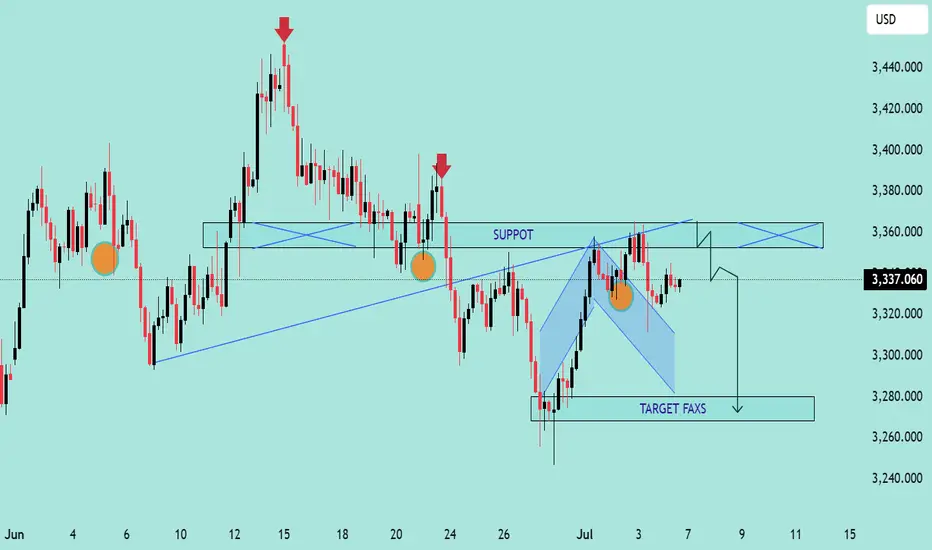
The chart illustrates a bearish setup forming after multiple rejection points near a key resistance zone around 3,360–3,380 USD.
🔍 Key Observations:
🔴 Double Rejection Pattern:
Red arrows highlight strong bearish rejections from resistance.
Indicates sellers are defending this zone aggressively.
🟠 Support Turned Resistance:
The previous support (labelled as "SUPPOT") is now acting as resistance.
Classic bearish retest behavior.
🔷 Bearish Flag Formation:
Price consolidates in a descending flag pattern.
Breakdown below the flag suggests continuation to the downside.
🎯 Target Zone:
If breakdown confirms, price may drop towards target area near 3,275–3,280 USD (marked as “TARGET FAXS”).
🟧 Important Reaction Zones:
Multiple orange circles indicate zones of high reaction – historically significant for both buyers and sellers.
📌 Conclusion:
Unless bulls reclaim the 3,360–3,380 resistance zone convincingly, the bias remains bearish, and the next leg down may target the 3,280 USD area.
🔔 Traders should watch for a clean break below 3,320 to confirm bearish continuation.
CFDGOLD trade ideas
Beauty of Fibonacci Resistance Speed Fan on Gold as a Golden
1. Look at the Beauty of Fibonacci Resistance Speed Fan on Gold as a Golden View
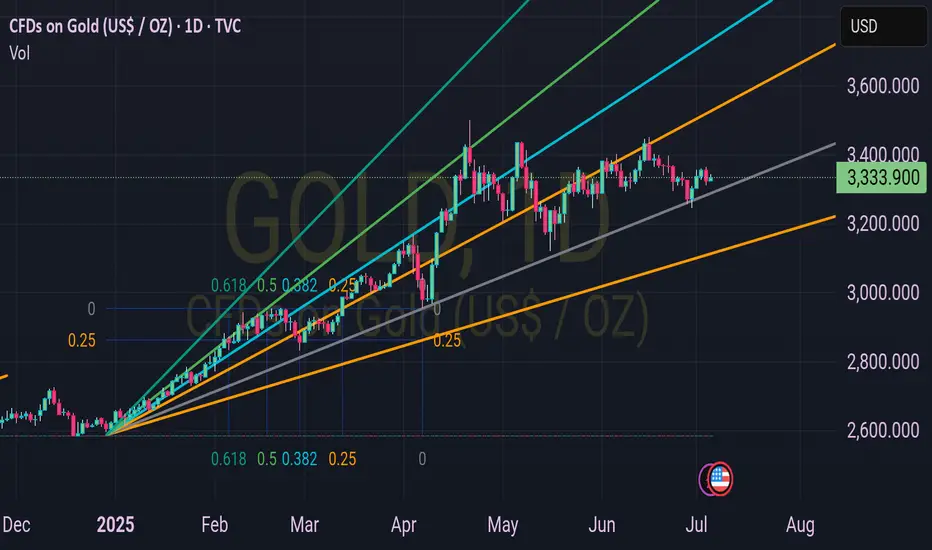
The weekly chart of CFDs on Gold (USD/oz) showcases a stunning Fibonacci resistance fan, guiding price action with precision.
2. Fibonacci Levels as Key Resistance Zones
The fan, drawn from the 2025 low, highlights critical resistance levels: 0.25 at $3,250,000, 0.382 at $3,333,900 (current price), 0.5, 0.618, and beyond, acting as potential ceilings.
3. Current Price Action at $3,333.90
As of July 06, 2025, 01:16 PM +04, gold trades at $3,333.90 (+$8.48 or +0.26%), aligning perfectly with the 0.382 Fibonacci level, indicating a strong resistance test.
4. Upward Momentum Meets Resistance
The price has risen steadily from $2,500 in December 2024, but the Fibonacci fan suggests a potential pause or reversal as it approaches the 0.382 and 0.5 levels.
5. 0.5 Level at $3,500 as a Major Hurdle
The 0.5 Fibonacci resistance at $3,500 looms large, where gold may face significant selling pressure if it breaks through the current $3,333.90 mark.
6. 0.618 Level Signals Next Target
Should gold surpass $3,500, the 0.618 level around $3,750 could be the next psychological and technical barrier, testing bullish strength.
7. Trendline Support Aligns with Fibonacci
The ascending trendline, intersecting near $3,250, complements the Fibonacci fan, offering dynamic support if a pullback occurs from these resistance zones.
8. Recent Price Action Reflects Fibonacci Precision
The recent $8.48 uptick to $3,333.90 demonstrates gold’s adherence to the 0.382 level, reinforcing the fan’s predictive power over the past months.
9. Potential Breakout or Reversal Ahead
Traders should watch for a breakout above $3,333.90 towards $3,500 or a reversal back to $3,250, with the Fibonacci fan providing clear levels to monitor.
10. Strategic Trading with Fibonacci Insights
Use the Fibonacci resistance fan to plan entries and exits, leveraging its alignment with gold’s current $3,333.90 price to anticipate the next move in this golden market.
Gold XAUUSD updated levels for next week range bound to negativeHow My Harmonic pattern projection Indicator work is explained below :
Recent High or Low :
D-0% is our recent low or high
Profit booking zone: D13% -D15% is
range if break them profit booking start on uptrend or downtrend but only profit booking, trend not changed
SL reversal zone : SL 23% and SL 25% is reversal zone if break then trend reverse and we can take reverse trade
Target : T1, T2, T3, T4 and .
Are our Target zone

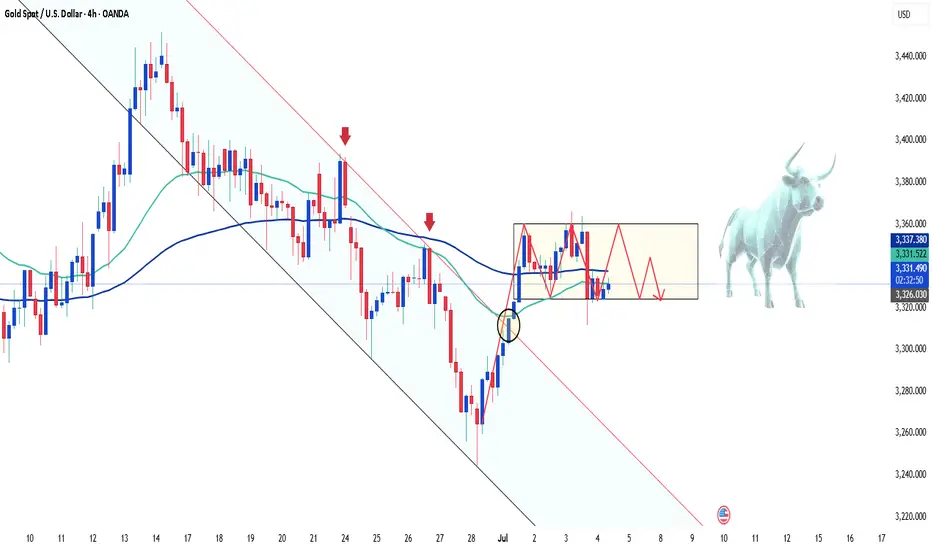
XAUUSD: Bullish Momentum Continues to BuildGold is currently trading within an ascending triangle pattern on the H1 chart, with support around the 3,322 zone and resistance near 3,359 USD. Recent price action shows strong bounces from the support line, along with a series of bullish Fair Value Gaps — indicating clear buying strength.
Fundamental factors supporting the upside:
– Weak U.S. job data lowers expectations for prolonged high interest rates from the Fed.
– The U.S. dollar is weakening due to inflation pressure and fiscal uncertainty.
– Rising geopolitical tensions and increased U.S. spending are boosting safe-haven demand for gold.
Strategy: Look for buy opportunities on a retest of the 3,322–3,326 zone. Target the 3,359 USD level, with potential for further upside if the triangle breaks to the top. Watch out for invalidation if price falls below support.

Gold Attempts Bullish Rebound, Awaits Break Above $3350The recovery attempts from yesterday's $3312 lows apparently facing resistance at $3346 and strong break needed above $3350 to confirm rebound which its next targets 78.6% Fibonacci zone $3372
Currently a pullback from $3345 is testing local demand zone $3333 below which next support sits at $3323 where buyers may resurface for renewed attack on overhead resistance $3346 and clearing through $3350 hurdle to advance higher to next critical resistance $3372

XAUUSD: Poised for a Breakout to Higher LevelsThe H1 chart shows gold moving sideways within a symmetrical triangle, with higher lows and narrowing range — a classic sign of consolidation before a potential breakout.
The lower boundary of the triangle is acting as dynamic support around the 3,334–3,336 zone. Buyers appear to be in control, pushing price up from previous Fair Value Gap zones. If price holds above 3,334 and breaks through the upper triangle resistance, the next short-term target is around 3,371.
Strategy: Favor a mild upside breakout scenario. Consider long entries if price breaks above 3,350 with volume confirmation, targeting 3,371 for take-profit.

Gold Pauses as Strong NFP Data Boosts the DollarHello traders!
Gold is currently hovering around $3,330 after Friday’s Non-Farm Payrolls (NFP) report came in stronger than expected, showing 147,000 new jobs — higher than both the previous reading (139,000) and forecasts (110,000). This pushed the US dollar slightly higher, placing temporary pressure on gold’s upside momentum.
However, broader market factors still support gold’s long-term bullish outlook. Concerns over US fiscal sustainability, continued central bank gold buying, and global growth fears remain key drivers for safe-haven demand.
Technically, gold continues to hold above the key support zone near $3,325, preserving its bullish structure. As long as this level holds, the upward trend remains valid.
👉 What’s your take after the latest NFP report? Will gold keep rising — or is a pullback on the way?
XAUUSD – Market Stays Flat Despite Trump’s Super BillXAUUSD – Market Stays Flat Despite Trump’s Super Bill, Is Gold Quietly Building Momentum?
Gold has entered a narrow consolidation phase after a series of strong macroeconomic catalysts — including the passing of Trump’s Super Bill by the U.S. House of Representatives. But instead of rallying immediately, gold remains flat... and that silence could be louder than it seems.
📰 Macro Recap – Good for USD, Bad for Gold?
The approved Super Bill may weaken the U.S. dollar in the medium term due to rising fiscal deficits. But for now, the market is skeptical, and gold is not reacting as expected.
Meanwhile, the NFP and Unemployment Rate (UR) data came in surprisingly strong last night, reinforcing the possibility that Fed rate cuts may be delayed → A short-term bearish pressure on gold.
With the U.S. Independence Day holiday, market liquidity will likely remain low today, increasing the risk of fake breakouts or stop-hunting volatility.
❗ “No immediate rally doesn’t mean no rally at all.” A retracement to the 3.2xx zone could offer an ideal entry for medium-term longs.
📉 Technical Outlook – XAUUSD
Price has broken above the recent short-term downtrend line and is now testing a critical supply zone around 3344–3345, which may determine today’s intraday direction.
🔍 Key Levels
Major Resistance: 3345 – 3362 – 3374 – 3388 – 3390
Major Support: 3330 – 3312 – 3304 – 3302 – 3298
🟢 Bullish Strategies (Buy Setups)
🔹 BUY Scalp Zone:
3313 – 3311
SL: 3307
TP: 3316 – 3320 – 3325 – 3330 – 3335 – 3340 – 3345 – 3350
🔹 Deep BUY Zone:
3304 – 3302
SL: 3298
TP: 3308 – 3312 – 3316 – 3320 – 3330 – 3340
These zones align with EMA confluence and potential FVG retracements – a solid setup for trend continuation.
🔴 Bearish Strategies (Short-Term Only)
🔹 SELL Scalp Zone:
3362 – 3364
SL: 3368
TP: 3358 – 3354 – 3350 – 3346 – 3340 – 3335 – 3330
🔹 Upper SELL Zone:
3388 – 3390
SL: 3394
TP: 3384 – 3380 – 3376 – 3370 – 3365 – 3360
Consider shorting only with confirmation patterns or bearish signals from lower timeframes.
🧠 Market Sentiment Today
The market seems to be in a wait-and-see mode, consolidating between 3320 – 3340 as traders digest recent macro data. A breakout is likely after the U.S. holiday ends.
Primary Scenario: Look to BUY on deeper pullbacks into support zones.
Alternate Scenario: SELL only for intraday scalps when price rejects key resistance.
💬 What’s Your Take?
Is gold silently accumulating strength for a breakout above 3390?
Or are we about to witness a deeper correction in the coming sessions?
👇 Share your thoughts in the comments and let's discuss it together!

Gold/USD Bullish Breakout Toward Target Zone Gold/USD Bullish Breakout Analysis 🚀🟢
The chart illustrates a strong bullish breakout from a consolidation zone, signaling upward momentum:
🔍 Key Technical Observations:
Support Zone: The price respected the support area around 3,325 – 3,330 USD, forming a solid base for reversal.
Bullish Structure: Series of higher lows and higher highs indicate a bullish trend formation.
Breakout Confirmation: Price broke above short-term resistance with a strong bullish candle, indicating buying pressure.
Trendline Support: The ascending trendline has held well, confirming trend continuation.
Target Point 🎯: Projected target is near 3,365 USD, which aligns with a previous resistance and Fibonacci confluence zone.
✅ Conclusion:
The breakout above resistance, supported by a bullish structure and momentum, suggests further upside potential toward the 3,365 USD target zone. As long as price holds above the breakout level, bullish bias remains valid.
🛑 Watch for invalidation if price falls back below 3,330 USD zone.

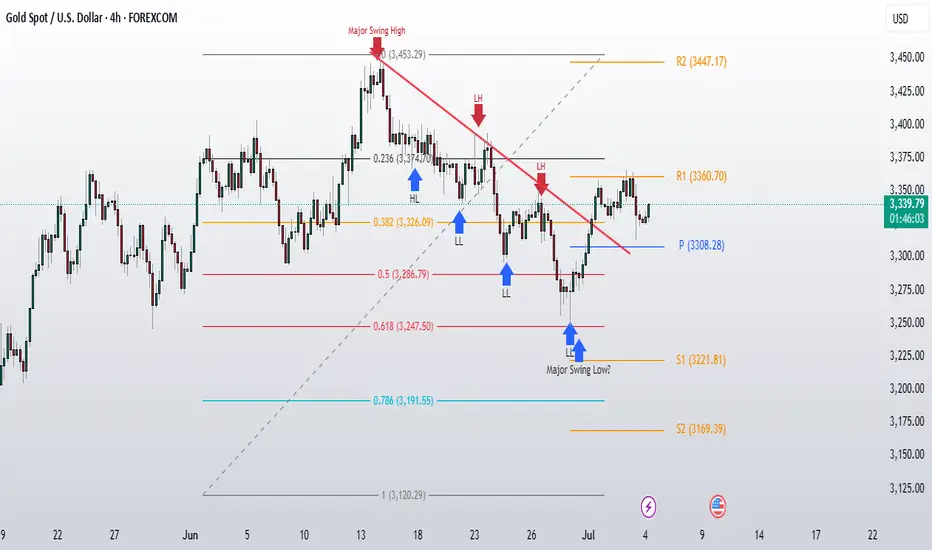
Gold Update: Bulls Test Weekly R1 at 3360 The 3360 Weekly R1 level is proving to be a solid barrier. This was anticipated, as weekly resistance levels often require multiple attempts or significant volume to break through cleanly.
gold needs substantial volume to power through this resistance level, but we're heading into a low-volume trading environment.
With the US markets closing early today for Independence Day, we're looking at reduced trading activity. This creates a few scenarios:
Lower volume could mean less momentum to break resistance
Thin trading conditions might lead to choppy price action
Any breakout attempts may lack the conviction needed for follow-through.
3308 Major Support: This remains our key downside level to watch. If the bulls can't make progress at 3360 and we see some profit-taking, this support zone becomes crucial for maintaining the recent bullish momentum.
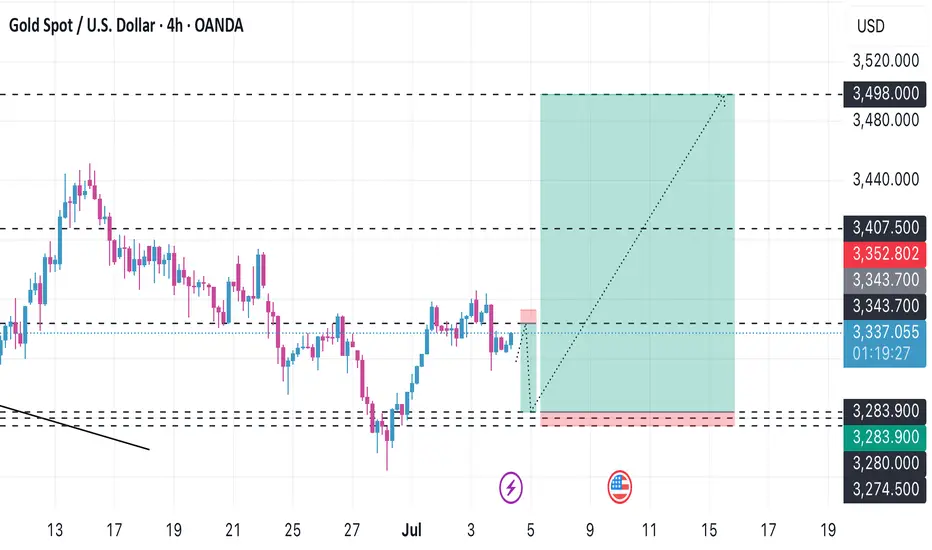
Update gold after the end of the second quarterToday is a normal Friday as usual the non-farm news will come out But the non-farm news came out a day before yesterday and today the bank will be closed for the 2nd quarter summary and I predict there will be a big gap, I will wait to buy in the lower zone and expect it to go back up to the 3,500 zone.
Gold Trading Strategy for 04th July 2025📈 GOLD INTRADAY STRATEGY (15-Min Candle Breakout Plan)
📅 Date: 03 July 2025
🕒 Timeframe: 15-Minute Candle
🟢 BUY Setup
✅ Entry Condition:
Buy above the High of the first 15-minute candle if the candle closes above ₹3342
💹 Buy Above: ₹3342
🎯 Targets:
🥇 Target 1: ₹3353
🥈 Target 2: ₹3365
🥉 Target 3: ₹3375
🛑 Stop-Loss: ₹3329
🔴 SELL Setup
✅ Entry Condition:
Sell below the Low of the first 15-minute candle if the candle closes below ₹3310
📉 Sell Below: ₹3310
🎯 Targets:
🥇 Target 1: ₹3298
🥈 Target 2: ₹3280
🥉 Target 3: ₹3265
🛑 Stop-Loss: ₹3323
⚠️ Disclaimer
📌 This is not financial advice.
📌 Trading in commodities, including gold, involves substantial risk and may not be suitable for all investors.
📌 Please consult with your financial advisor before making any trading decisions.
📌 Trade with strict stop-loss and proper risk management.

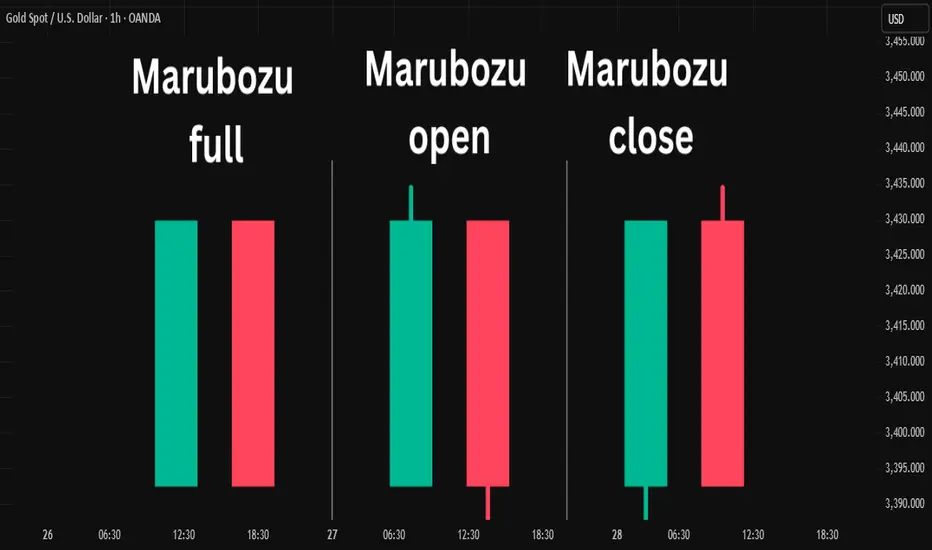
Marubozu Candlestick Pattern.....The Marubozu is a unique and powerful single candlestick pattern that signals strong momentum in the market.
📌 What is a Marubozu?
A Marubozu candlestick has "no wicks or small wicks" — just a full body from open to close. This shows that the buyers or sellers were in complete control during that period.
🔵 Bullish Marubozu
A Bullish Marubozu opens at the low and closes at the high, showing strong buying pressure. It often appears at the beginning of a bullish move or during a breakout.
🔴 Bearish Marubozu
A Bearish Marubozu opens at the high and closes at the low, indicating strong selling pressure. It can mark the start of a downtrend or a continuation of bearish strength.
🧠 Interpretation
Marubozu patterns are seen as signs of conviction. When spotted at support or resistance zones, they can strengthen breakout signals or confirm reversals.
⚠️ Tip :
Always combine Marubozu with volume analysis or other indicators to avoid false signals and improve accuracy.
🔍 Use this pattern to identify strong momentum shifts and trade in the direction of the breakout!
Disclaimer :
This post is not financial advice, it's for educational purposes only highlighting the power of coding( pine script) in TradingView, I am not a SEBI-registered advisor. Trading and investing involve risk, and you should consult with a qualified financial advisor before making any trading decisions. I do not guarantee profits or take responsibility for any losses you may incur.
XAUUSD 03/07: GOLD IN THE DRIVER'S SEATXAUUSD 03/07: GOLD IN THE DRIVER'S SEAT – WILL IT BREAKOUT OR PULLBACK BEFORE KEY EVENTS?
Gold is on a solid upward trajectory, as expected from earlier predictions this week. After a negative ADP Non-Farm Payroll report yesterday, the USD weakened, providing the fuel for gold to soar. During the US session, gold surged from the 333x level to 336x.
🔑 Key Catalysts to Watch:
1. Political Factors:
Trump's announcement that the Republicans in the House have united to push through the "Super Bill" is a significant factor that could propel gold even further in the near future. The political climate is setting the stage for gold's potential rally.
2. Macro Overview:
Federal Reserve and Rate Cuts: The market is eyeing the Fed closely, with high expectations for two interest rate cuts this year. This could put continued pressure on the USD and further support gold. With a 90% chance of a rate cut by the end of Q3, the path is clear for gold to target new highs.
US Economic Data: Disappointing ADP data, reporting a loss of -33k jobs, continues to point to a weakening labor market, strengthening the case for gold as a safe-haven asset.
🌍 Market Conditions and Trade Setup:
The market remains on edge with these political and economic factors at play. The market will also be watching the Non-Farm Payrolls (NFP) data closely. With the ADP report showing poor results, the market could experience some turbulence ahead of the NFP release, and with a long weekend ahead due to the bank holiday, traders should approach this market with caution.
📉 Technical Outlook – The Road Ahead for Gold:
Gold has been trending upward and maintaining a bullish outlook. However, a minor pullback is expected.
Resistance: 3358 – 3365 – 3374 – 3380 – 3390
Support: 3343 – 3335 – 3325 – 3316 – 3304
📊 Trading Plan – Key Levels to Watch:
Buy Scalp:
Entry: 3335 – 3333
SL: 3329
TP: 3340 → 3345 → 3350 → 3360 → 3370
Buy Zone:
Entry: 3316 – 3314
SL: 3310
TP: 3320 → 3324 → 3328 → 3332 → 3336 → 3340 → 3350 → 3360
Sell Scalp:
Entry: 3374 – 3376
SL: 3380
TP: 3370 → 3366 → 3360 → 3355 → 3350
Sell Zone:
Entry: 3388 – 3390
SL: 3394
TP: 3384 → 3380 → 3376 → 3370 → 3366 → 3360
⚠️ Key Focus for Traders:
Upcoming Data: The NFP release will be crucial, as disappointing job numbers could drive gold even higher.
Market Volatility: With the long weekend ahead and market reactions to key news, be prepared for possible volatility.
Trade with Caution: Stick to your TP/SL strategy, manage risk, and only enter trades when clear setups appear.
📈 Conclusion:
Gold is showing strong potential for further gains, but traders should be prepared for some pullbacks as the market reacts to upcoming economic and political news. The trend remains bullish, but it’s crucial to remain cautious and follow the technical levels closely to optimize entry points. Stay alert for key developments in the USD, NFP, and Fed rate-cut expectations, and let the market guide you.

Gold Forms Classic Head & Shoulders: Breakdown or Bounce?🔎 Key Bullish Technical Levels:
Immediate Breakout Zone: ~$3355–$3360 (neckline resistance)
Current Price: ~$3344
Key Supports:
~$3320 (minor horizontal support)
~$3244 (major swing low and bullish invalidation level)
Upside Targets on Breakout:
~$3380 (near-term resistance)
~$3393–$3400 (previous high and psychological level)
🧭 Technical Observations:
✅ Price respecting rising structure since the head formation near $3244.
✅ Reduced selling on the right shoulder suggests buyers absorbing supply.
✅ Sustained move above neckline ($3360) activates bullish continuation with measured move potential.
✅ Strong momentum build-up seen in previous rally legs.
⚙️ Potential Bullish Strategy:
✅ Breakout Entry: Wait for 1H close above ~$3360 neckline.
✅ Targets: $3380 → $3393–$3400.
✅ Stops: Below ~$3320 or dynamic levels depending on risk appetite.
✅ Watch for volume confirmation on breakout.
⚡️ Pro Tip:
A Head and Shoulders isn’t bearish until it breaks down. As long as the neckline holds, it’s a resistance test – and a breakout zone for patient bulls.

XAUUSD GOLD Analysis on (03/07/2025)#XAUUSD UPDATEDE
Current price - 3340
If price stay above 3325 then next target 3375,3395 and below that 3300
Plan;If price break 3345-3335 area,and stay above 3340,we will place buy order in gold with target of 3375 and 3395 & stop loss should be placed at 3300

Elliott Wave Analysis – XAUUSD, March 7, 2025
🌀 Elliott Wave Structure
On the H1 chart, wave 3 appears to have completed, and price is now entering a phase with an unusual structural behavior.
Wave 3 previously showed strong momentum, moving steeply and continuously, with no clear internal pullbacks – a classic impulse wave. Following this, we observed a corrective abc pattern in black, suggesting the end of wave 3.
Interestingly, although yesterday's ADP report was extremely bullish, gold only managed a mild breakout above the wave 3 high before pulling back this morning. Notably, the upward move followed a 3-wave abc structure in green, and price action is now showing overlapping waves with no clear directional momentum.
🧩 These signs suggest a high probability that:
🔹 Wave 5 is forming as an Ending Diagonal – a 5-wave structure with a 3-3-3-3-3 pattern.
🔹 This is typically seen at the end of a bullish cycle and often precedes a sharp reversal.
Although it's too early to confirm, we should patiently observe the upcoming price action. If the ending diagonal completes, it may present a strong sell opportunity.
🎯 Target for wave 5: around 3395, provided all 5 sub-waves within the diagonal complete.
⚠️ If price breaks below 3324, we must consider that the full 5-wave structure is already done, and a new abc corrective phase may have begun.
🔍 Momentum Analysis
Daily (D1): Momentum is about to turn bearish from overbought territory → suggests a weakening uptrend.
H4: Momentum is turning upward → likely a mild rally or sideways movement today before H4 reaches overbought again.
📌 Trading Plan
Given the current wave behavior and overlapping structure, it is best to remain patient and wait for confirmation before taking a strong position. If the Ending Diagonal structure is confirmed, it could signal a major reversal.
SELL Zone: 3392 – 3395
Stop Loss: 3403
Take Profits:
• TP1: 3368
• TP2: 3340
• TP3: 3324

NF news and gold buying pressurePlan XAU day: 03 July 2025
Related Information:!!!
Gold prices (XAU/USD) are struggling to build on a modest intraday rebound from the $3,340 area, holding relatively steady near the upper boundary of the weekly range during the first half of the European session. Market participants appear cautious, opting to await the release of the US Nonfarm Payrolls (NFP) report for further clarity on the Federal Reserve’s (Fed) potential rate-cut trajectory. This data is expected to play a pivotal role in shaping near-term demand for the US Dollar (USD) and could provide significant directional impetus for the non-yielding yellow metal.
personal opinion:!!!
Weak DXY is still the driving force for gold price to increase and recover around 3400, along with NF news not very positive for USD
Important price zone to consider : !!!
SELL point: 3395 zone
Sustainable trading to beat the market

Will Gold Break Higher Ahead of US Jobs Data?Hello traders, what’s your take—will gold rise or fall today?
So far, the precious metal remains quiet, hovering around $3,345 without much movement since yesterday.
According to the CME FedWatch Tool, although the probability is still low, expectations are rising that the Federal Reserve might cut interest rates later this month. That’s a strong supportive factor for gold in the near term.
Technically, the next bullish target is a confirmed daily close above the key resistance level at $3,400.
On the news front, Thursday marks the most important data release of the month for the US—the June Non-Farm Payrolls (NFP) report, released a day early due to the Independence Day holiday. The market is expecting an increase of 110,000 jobs, down from 139,000 in May.
This release could be a gold mover: If the actual number is weaker than expected, it would likely reinforce Fed rate cut expectations—giving gold a bullish push.

Gold XAUUSD 15M ORB & Trade PlanPrice testing ORB + supply zone at 3349–3352 near trendline resistance.
We have two bearish scenarios:
✅ Scenario 1: Short from 3349–3352 on rejection.
✅ Scenario 2: Direct entry short on clean break of 3342 ORL(Open range low)
Targets: 3345 → 3338 → 3332.
Invalidation: Above 3352, bias shifts bullish toward 3356–3360.
Trade on levels, avoid unplanned trades, and align with structure.
#Gold #XAUUSD #PriceAction #ORBStrategy #SupplyDemand #SmartMoney #BreakOfStructure #TradingView #Scalping #TradePlan

XAUUSD: Breakout Confirms Bullish ReversalGold has successfully broken out of the descending channel after consolidating around the $3,276 area, signaling a strong return of bullish momentum. The breakout occurred precisely at a confluence of multiple Fair Value Gaps, propelling price toward the $3,357 resistance zone.
Despite a slight rebound in the US dollar, growing concerns over the US fiscal deficit and proposed tax reforms are driving investors back into gold as a safe haven. Meanwhile, US bond yields remain low, and the dollar lacks the strength to suppress gold demand.
As long as price holds above $3,320, any pullback can be seen as a buying opportunity in this newly confirmed uptrend. The next target sits around $3,357, with potential for a move toward previous highs.

Gold Trading Strategy for 03rd July 2025-(UTC +5.30 HRS)📊 GOLD INTRADAY TRADE PLAN – JULY 2, 2025
(Instrument: Spot Gold in USD – Technical Strategy Based on 1-Hour Candle Close)
📈 BULLISH TRADE IDEA – BUY SETUP
🔹 Entry Condition:
Initiate a Buy position ONLY IF a 1-Hour candle closes ABOVE $3366.
This confirms bullish strength and a potential upward breakout.
🔸 Entry Point:
➤ After a valid 1-hour candle close above $3366
🎯 Upside Target Levels:
Target 1: $3376 – Short-term resistance / psychological level
Target 2: $3388 – Previous swing high zone
Target 3: $3399 – Round number target and potential breakout extension
🛑 Stop Loss:
Set SL at or below $3355 (previous resistance-turned-support or recent swing low)
📌 Risk Management Tips:
Risk-to-reward should be minimum 1:2.
Trail stop loss to breakeven after Target 1 is hit.
Exit partial quantity at each level for safer profit booking.
📉 BEARISH TRADE IDEA – SELL SETUP
🔹 Entry Condition:
Initiate a Sell position ONLY IF a 1-Hour candle closes BELOW $3343.
This indicates bearish momentum and possible downside continuation.
🔸 Entry Point:
➤ After a valid 1-hour candle close below $3343
🎯 Downside Target Levels:
Target 1: $3331 – Immediate support
Target 2: $3321 – Demand zone support area
Target 3: $3210 – Major support zone, long-range move
🛑 Stop Loss:
Set SL above $3354 (above recent structure or failed breakdown level)
📌 Risk Management Tips:
Maintain position sizing discipline.
Avoid over-leveraging.
Reassess if price shows reversal signs before hitting stop loss.
📌 GENERAL GUIDELINES:
✅ Use this plan only after the 1-hour candle closes — no early entries.
🕒 Avoid trading during high-volatility news (like FOMC, NFP, CPI) unless you're an experienced trader.
📉 Always manage trades actively – don’t set and forget.
💡 Keep a trading journal to track these setups and outcomes.
📜 DISCLAIMER:
This trading idea is for educational and informational purposes only and does not constitute investment advice. Trading commodities, including gold, involves a high level of risk and may not be suitable for all investors. Always conduct your own analysis or consult with a licensed financial advisor before making trading decisions. The author and publisher assume no liability for any financial losses incurred.
