XAUUSD Gold Trading Strategy August 1, 2025:
Yesterday's trading session, gold prices recovered to the 3315 area and then continued to decrease to the 3281 area. Currently, gold prices are fluctuating quite unpredictably due to the impact of tariff news and investor confidence.
Basic news: The Federal Reserve FED continues to maintain the federal funds benchmark interest rate in the range of 4.25% - 4.50%, in line with policy since 2025. Chairman Powell did not give any signal about the next interest rate cut on September 16 - 17.
Technical analysis: After falling sharply to the 3269 area, gold prices are showing signs of recovery. In the current downtrend channel, there has been a higher bottom than the bottom at H1. We can see that if the bullish pattern at H1 is confirmed, combined with the reversal candlestick appearing at H4, the possibility of gold bouncing back to reach the resistance area of 3330, even 3350 is completely possible. In the weekend trading session, we will wait at the support zones to trade.
Important price zones today: 3280 - 3285 and 3269 - 3274.
Today's trading trend: BUY.
Recommended orders:
Plan 1: BUY XAUUSD zone 3283 - 3285
SL 3280
TP 3288 - 3300 - 3310 - 3330.
Plan 2: BUY XAUSD zone 3269 - 3271
SL 3266
TP 3274 - 3284 - 3300 - 3320.
Wish you a safe, favorable and profitable trading day.🥰🥰🥰🥰🥰
CFDGOLD trade ideas

XAUUSD – Gold jumps as weak US job data boosts bullish sentimentGold prices reacted positively after the US Non-Farm Payrolls came in at only 106K and the unemployment rate rose to 4.2%, signaling a cooling labor market. This weak data has lowered expectations of further rate hikes from the Fed, offering strong support for gold.
On the H4 chart, XAUUSD has formed a bottom around the 3,247 area and is now rebounding within a descending channel. A slight trendline break and a W-pattern near the bottom further reinforce the potential for a continued upward move.
Technical view:
XAUUSD is approaching a key resistance zone around 3,313 – a crucial level that could trigger a breakout. If gold breaks above it with strong buying pressure, it may head toward the upper boundary of the channel.
The RSI is recovering from oversold levels, while EMA34 and EMA89 are starting to converge – suggesting a possible trend reversal ahead.

Gold continues to go long in the 3280-3300 range.Gold continues to go long in the 3280-3300 range.
Today, we remain firmly bullish on a bottom in the 3280-3300 range.
On August 1st, the Federal Reserve, while keeping interest rates unchanged, acknowledged slowing economic growth, triggering a repricing of expectations for a rate cut.
This led to a rebound in gold prices, but of course, this was just a pretext for the price increase.
Recently, gold prices experienced a four-day decline (July 23-28), falling from $3431 to $3268, as progress in trade negotiations and a rebound in the US dollar dampened safe-haven demand.
Non-farm Payrolls
Here are the key takeaways:
Today's US July non-farm payrolls data (expected to increase by 110,000, compared to 147,000 previously) will determine expectations for a September rate cut by the Federal Reserve.
A weak reading (e.g., below 100,000) could push gold prices back towards $3,400;
A strong reading (above 150,000) would remain bearish for gold. Gold prices continue to decline, and we are long in the 3280-3300 range.
Today, we remain firmly bullish on gold bottoming in the 3280-3300 range.
On August 1st, the Federal Reserve, while keeping interest rates unchanged, acknowledged slowing economic growth, triggering a repricing of rate cut expectations in the market.
This led to a rebound in gold prices, but of course, this was just a pretext for the price increase.
Recently, gold prices experienced a four-day decline (July 23-28), falling from $3431 to $3268, as progress in trade negotiations and a rebound in the US dollar dampened safe-haven demand.
Non-farm Payroll Data
Here are the key takeaways:
Today's US July non-farm payroll data (expected to increase by 110,000, compared to 147,000 previously) will determine expectations for a September rate cut by the Federal Reserve. A weak reading (e.g., below $100,000) could push gold back to $3,400.
A strong reading (above $150,000) would continue to be bearish for gold.
Technical Analysis and Trading Recommendations
Key Levels:
Support:
$3,270 (100-day moving average)
$3,248 (June low);
Resistance:
$3,300 psychological level
$3,340 (21-day/50-day moving average crossover).
Trading Strategy:
Short-term:
1: If the price holds above $3,300, initiate a long position with a target of $3,330-3,350.
2: If the price falls below $3,270, a drop to $3,248 is possible.
3: Focus on the key watershed at $3,300
4: Key Point:
As long as the gold price is above $3,300, I believe it's a good time to buy the dip. Following the upward trend in gold prices is a very wise choice.
As shown in Figure 4h:
The potential for gold prices to rebound is becoming increasingly clear.
The lower edge of the wide fluctuation range is slowly stabilizing.

GOLD SELL TRADE SETUP - 15 Min Time frame Gold sell Below 3302 , Sl 3312
On 1 HR Time frame Taken Liquidity Now BOS , Price is struggling here , Again wait for BOS 0n 5 min time frame 3302 Area is perfect sell , One more conflunce is here FIBB Level discount zone which is better exicution zone
Gold weakens further – is 3250 next?Hello traders, take a look at the chart — what do you see?
Here’s my perspective:
Recently, gold has shown signs of weakness as the U.S. dollar strengthens amid expectations that the Fed will delay interest rate cuts. In response to this, gold continues to trend lower and is currently hovering around the 3,289 USD mark.
The previous ascending trendline has been broken, and both the EMA 34 and EMA 89 have turned downward, fueling bearish momentum. The 3,320 support level has also failed, and the latest bullish correction was rejected — reinforcing the downtrend.
Given these clear fundamentals and technical confirmations, I expect the bearish momentum to accelerate, at least in the short term.
My immediate target for this move is 3,250 USD.
What about you — where’s your target?

Live : XAUUSD - SL hit - 01/08/2025Anticipated up side move in the london session
since 4 hr chart is bullish
Entered in 30min time frame during candle flip to upside
SL was hit
managed Risk
Happy Trading .!

Liquidity Sweep Complete – Bullish Continuation Ahead?GOLD ANALYSIS 31/07: Liquidity Sweep Complete – Bullish Continuation Ahead?
🔍 Technical View | XAUUSD | 2H Chart | End of Month Setup
Gold has completed a final liquidity sweep around the 3269–3271 zone and has since rebounded strongly, in line with the prevailing bullish structure. The sharp drop yesterday during the FOMC rate statement appears to have served its purpose: grabbing final sell-side liquidity before preparing for the next bullish leg.
As of now, price is reacting at the 3295 zone, which coincides with the M30 CP (Change of Character) Zone, showing minor intraday retracement. A healthy pullback is likely before a potential bullish breakout of the descending trendline that has been holding price down over recent sessions.
🔵 BUY Strategy: Trend Continuation Setup
We’re watching for potential re-entries on a dip toward the OBS Buy Zone (3286–3284), created after the recent bullish move. This could be the last opportunity to catch the next impulsive leg higher.
Buy Zone: 3286–3284
Stop Loss: 3278
Targets: 3290 → 3294 → 3298 → 3304 → 3308 → 3312 → 3316 → 3320 → 3330 → ???
Key breakout confirmation will come if price closes strongly above 3313 (first key resistance). If broken, this opens the door toward the VPOC zone at 3328–3330, where a high-volume cluster awaits.
🔴 SELL Strategy: Short-Term Rejection Levels
Shorts only become favorable below the VPOC Sell Zone (3328–3330). If price closes above this area, bearish pressure is likely to fade, and bulls will dominate the next leg.
Sell Zone: 3328–3330
Stop Loss: 3335
Targets: 3324 → 3320 → 3315 → 3310 → 3305 → 3300
⚠️ Important: Selling inside a bullish breakout structure is high-risk unless the market gives clear rejection at major supply. Always wait for price action confirmation.
🕯️ Monthly Candle Insight (July Close)
Today marks the final trading day of July. Notably, the last two monthly candles have closed as Doji with long wicks, reflecting deep indecision and ongoing liquidity grabs. This aligns with the upcoming interest rate cut discussions at the next FOMC, which could ignite significant volatility.
📌 Summary:
Liquidity sweep at 3269–3271 is likely complete.
Price now retracing after strong bullish rebound from OBS Buy Zone.
Watch for confirmation above 3313, then 3328–3330 for breakout toward higher zones (335x–337x).
End-of-month close + macro narrative (FOMC) will be crucial to confirm direction.
💡 Pro Tip: Avoid entering late into reactive moves. Wait for retests of clean liquidity zones and use volume-based confluences to validate bias.
📲 Follow us @MMFlowTrading for real-time updates, macro analysis, and market structure insights on gold & major pairs.

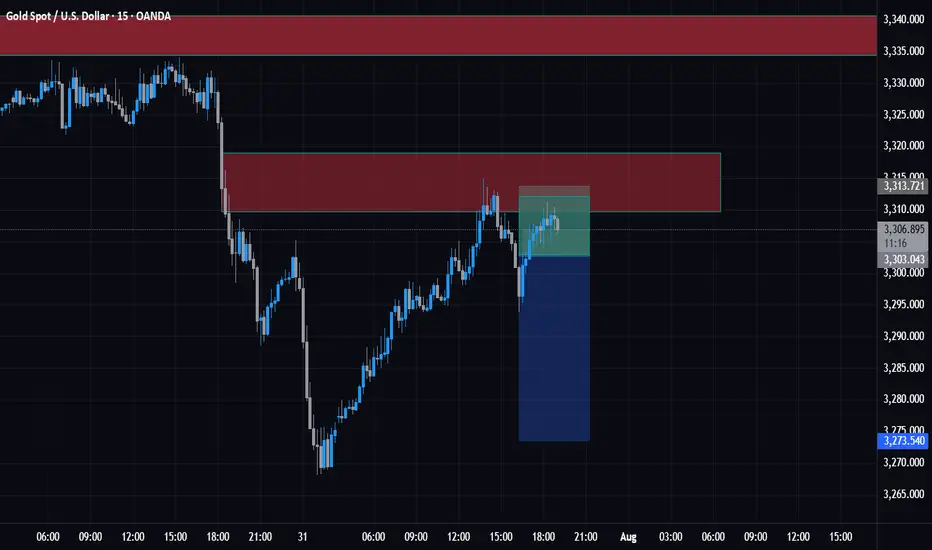
Gold Recovery Fails at 3300 - Bearish Bias ContinuesBased on the gold chart analysis, here's a simplified price action breakdown:
Gold attempted a decent recovery and pullback yesterday, but the price is still struggling to sustain above the crucial 3300-3305 area. This inability to hold above key support levels is concerning for bullish sentiment. Additionally, gold has failed to break above the resistance trendline (black line on the chart), which further weakens the bull case.
For any meaningful upward movement, gold needs to generate at least one higher low formation, which hasn't printed yet. The immediate support zone lies at 3267-3275, and if this level breaks down, we could see further decline toward lower price levels. From a price action perspective, sellers are still in control of the market despite yesterday's recovery attempt.
The key levels to watch are the 3300-3305 resistance above and 3267-3275 support below. Until gold can break and sustain above the resistance trendline while forming higher lows, the overall sentiment remains bearish.

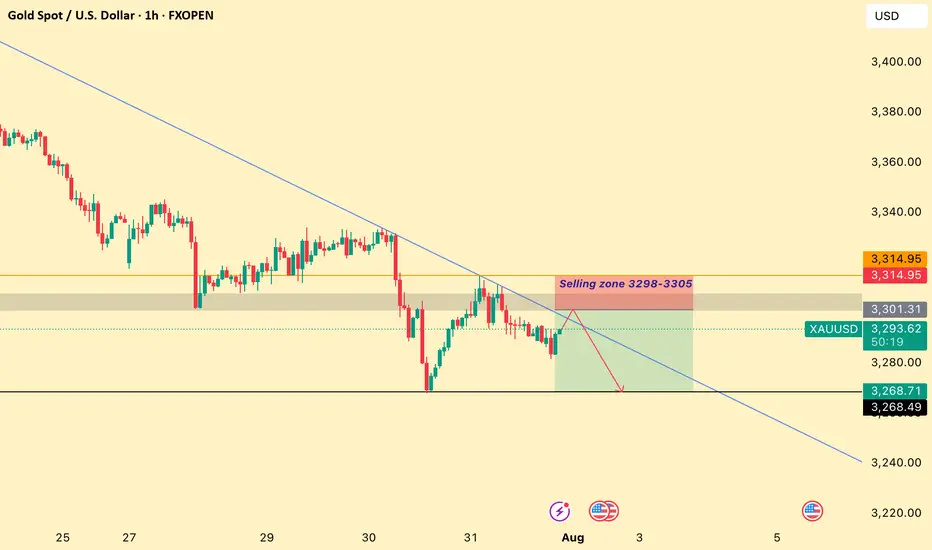
XAUUSD GOLD Analysis on (01/08/2025)#XAUUSD UPDATEDE
Sell Limited - (3298-3305)
If price stay below 3315, then next target 3282,3268 and above that 3335
Plan;If price break 3298-3305 area,and stay below 3295,we will place sell order in gold with target of 3282,3268 and 3250 & stop loss should be placed at 3315
XAUUSD – Gold may plunge if key support failsHello traders! Gold continues to move within a clear descending channel and is currently retesting the previous support zone around 3,295.600. The RSI remains weak, and the EMA 34 stays below the EMA 89, confirming that the bearish trend is still dominant.
On the news front, U.S. labor costs have exceeded expectations, the Fed held rates steady, and there’s no sign of a dovish shift. This continues to strengthen the USD and puts pressure on gold. Investors are now awaiting Powell’s speech at tonight’s FOMC meeting—if his tone remains hawkish, gold is likely to face further downside.
Trading strategy:
If price retraces to the 3,350 – 3,371 zone and shows rejection or reversal signals, SELL remains the preferred option.
Gold dips again – is the bounce just a trap?Hello traders!
After a quiet start to the day, gold has turned lower and is now hovering around the $3,300 mark. The decline in OANDA:XAUUSD came as U.S. Treasury yields rose in response to strong U.S. economic data. The Fed is widely expected to maintain its current monetary policy stance during today’s session.
From a technical perspective, XAUUSD continues to form bearish structures and breakdowns. While a short-term bullish correction is currently underway, the bears still hold the upper hand — and selling opportunities remain the preferred strategy.
I’ll be focusing on two key entry zones marked on the chart, with a short-term bias favoring sell setups.
Do you agree with this approach?
⚠️ Please remember: This is just a trading idea — make sure to manage your risk properly with defined TP and SL levels.
Good luck and happy trading!
XAU/USDThis XAU/USD trade setup is a sell trade, which means the trader expects gold prices to fall. The entry price is 3287, the stop-loss is 3297, and the exit price is 3267. This trade aims for a 20-point profit while risking 10 points, giving a favorable risk-to-reward ratio of 1:2.
Selling at 3287 indicates the trader believes that gold may face downward pressure due to factors like a stronger US dollar, positive US economic data, or reduced safe-haven demand. The exit price of 3267 is set as the profit target, where the trader plans to close the trade if the market moves lower as expected.
The stop-loss at 3297 protects against losses if the price unexpectedly rises instead of falling. Since the stop-loss is only 10 points above the entry, this trade requires strict monitoring to avoid being stopped out due to short-term volatility.
Risk management is very important—only a small portion of the trading capital should be risked. Following the plan with discipline, without adjusting the stop-loss or target emotionally, increases the chances of a successful trade. Overall, this setup is structured to benefit from a short-term downward move in XAU/USD.

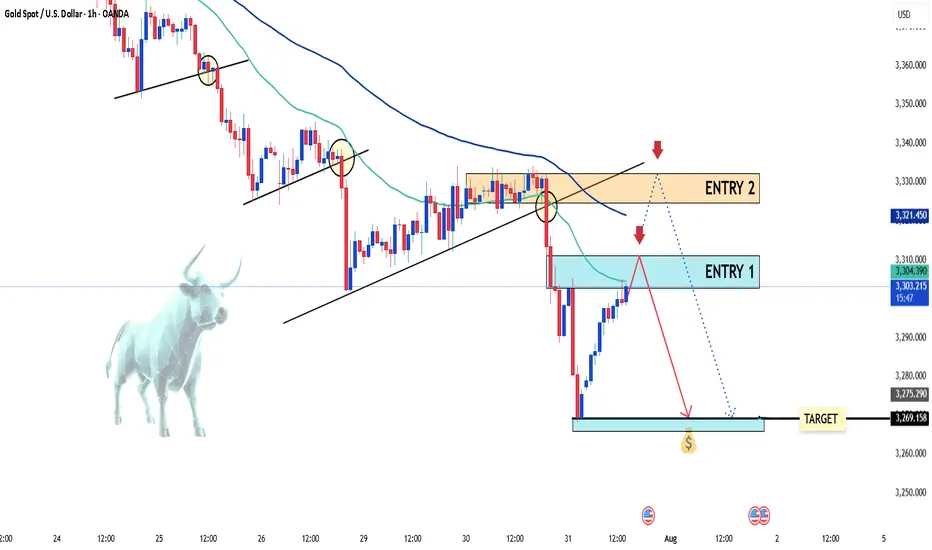
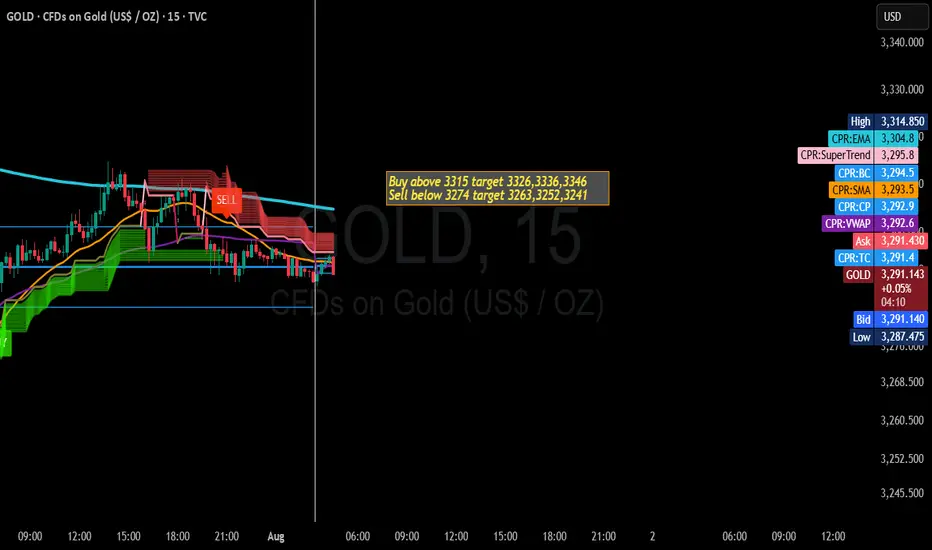
Gold Trading Strategy for 01st Aug 2025📊 Gold Trading Plan
💰 Trading Instrument: Gold ($XAU/USD)
⏰ Timeframe: 1-Hour (H1)
🟢 Buy Setup (Long Trade)
✅ Entry: Buy above the high of a 1-hour candle that closes above $3,315
🎯 Targets:
$3,326 🥇
$3,336 🥈
$3,346 🏆
💡 Example:
If a 1-hour candle closes at $3,316, you can place a buy order above its high for a potential move to the target levels.
🔴 Sell Setup (Short Trade)
✅ Entry: Sell below the low of a 1-hour candle that closes below $3,274
🎯 Targets:
$3,263 ⚡
$3,252 ⚡⚡
$3,241 ⚡⚡⚡
💡 Example:
If a 1-hour candle closes at $3,273, you can place a sell order below its low to aim for the downside targets.
📌 Tips:
1️⃣ Wait for the candle to close before entering.
2️⃣ Use Stop-Loss (SL) to manage risk (e.g., 10–15$ away from entry).
3️⃣ Trade with proper risk management: Never risk more than 1–2% of your account.
4️⃣ Confirm signals with volume or trend direction if possible.
⚠️ Disclaimer:
Trading in gold or any financial market involves risk. Past performance is not indicative of future results. This setup is for educational purposes only and not financial advice. Always do your own research or consult a financial advisor before trading.

Gold Trading Strategy XAUUSD July 31, 2025Yesterday's trading session, after breaking the rising price channel in the 3318 - 3320 area, the gold price fell sharply to the 3269 area.
Basic news: US Treasury yields fell and the weak US labor market report could boost investor demand. Data released by the US Department of Labor on Tuesday showed that the number of new jobs fell in June after 2 consecutive months of increase. Today, the Federal Reserve will announce a new interest rate decision.
Technical analysis: The rising price channel in the H1 frame was broken, and the gold price immediately fell sharply. Currently, the downtrend of gold is still maintained. The MA lines are still resistance for gold prices.
Important price zones today: 3300 - 3305, 330 - 3325 and 3267 - 3272.
Today's trading trend: SELL.
Recommended orders:
Plan 1: SELL XAUUSD zone 3303 - 3305
SL 3308
TP 3300 - 3290 - 3280 - 3270.
Plan 2: SELL XAUUSD zone 3323 - 3325
SL 3328
TP 3320 - 3310 - 3290 - 3280.
Plan 3: BUY XAUUSD zone 3267 - 3269
SL 3264
TP 3272 - 3282 - 3292 - 3302 (small volume).
Wish you a safe, favorable and profitable trading day.🌟🌟🌟🌟🌟

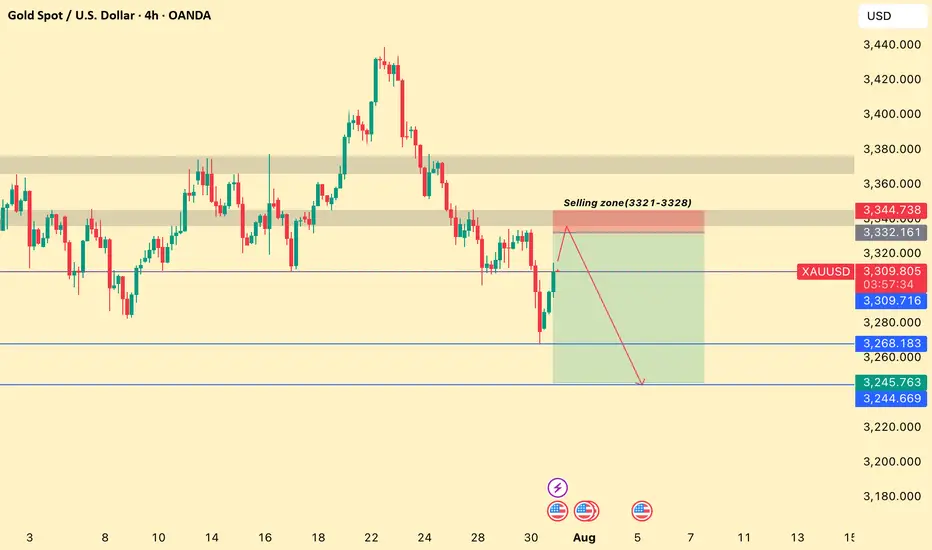
XAUUSD GOLD Analyis on (32/07/2025)#XAUUSD UPDATEDE
Sell Limited - (3321-3328)
If price stay below 3348, then next target 3290,3270 and above that 3370
Plan;If price break 3321-3328 area,and stay below 3320,we will place sell order in gold with target of 3290,3270 and 3250 & stop loss should be placed at 3348
Gold Rebounds From $3268 to $3315, Bulls to Face Hurdle at $3338From intraday high of $3334 Gold dropped to $3268 yesterday, which aligns with 100 Day SMA.
This sums up a significant $66 drop in a day which came on the back of strengthened Dollar Index rising over 100 Day SMA 99.10 reaching 99.96
Today's Asian session begins with buyers returning to the desk as buying dips looks attractive amidst looming uncertainties on global economic front due to Trump tariff turmoil.
Gold has witnessed a recovery rally jumping off the lows reaching $3315 and bias turns positive with further gains in sight aiming $3323-$3333 on intraday basis before any new attempt to resume decline.
Meanwhile any pullback towards support zone is likely to witness buyers joining again on dips around $3300-$3295-$3290
Note : Current rebound attempts require price action stability holding above $3280

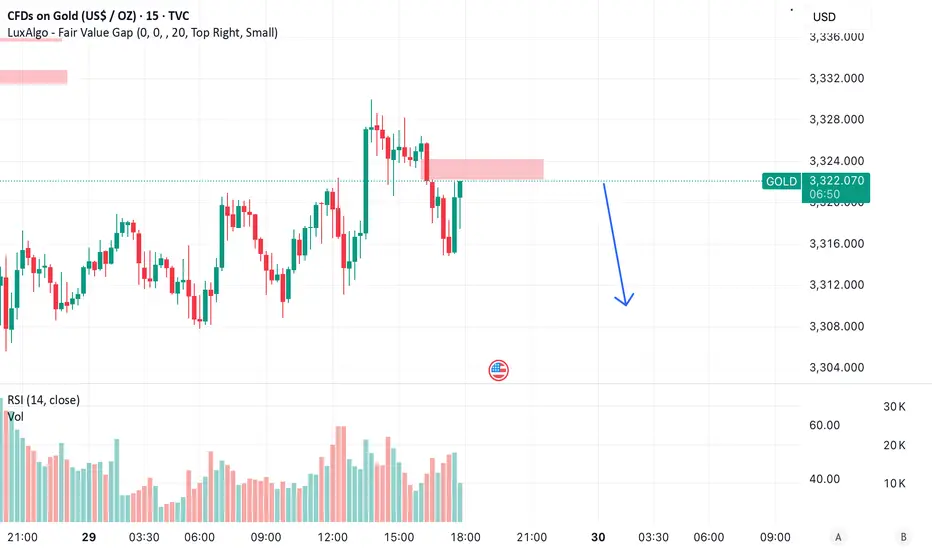
Gold FVG Rejection – Downside in PlayShort Setup
Technical View:
• Price is forming lower highs and lower lows after a clear rejection from the $3,328 area.
• Currently retesting the fair value gap (FVG), which has acted as resistance.
• Volume is weakening on green candles, showing buyers are losing strength.
• The breakdown from earlier has not been recovered, indicating sellers are in control.
Macro Factors Supporting a Short:
• Extension of US-China tariff pause reduces global risk, hurting gold demand.
• De-escalation in EU-US trade tensions adds to risk-on sentiment.
• Strong US economic data and reduced expectations of immediate Fed rate cuts are keeping pressure on gold.
• A stable or strong dollar is another headwind for gold prices.
Trade Plan:
• Sell Entry: $3,320–$3,322
• Stop Loss: Above $3,327
• Target 1: $3,308
• Target 2: $3,300
• Risk-Reward Ratio: Around 1:2.5
This setup remains valid as long as price stays below $3,327 and shows rejection near resistance.
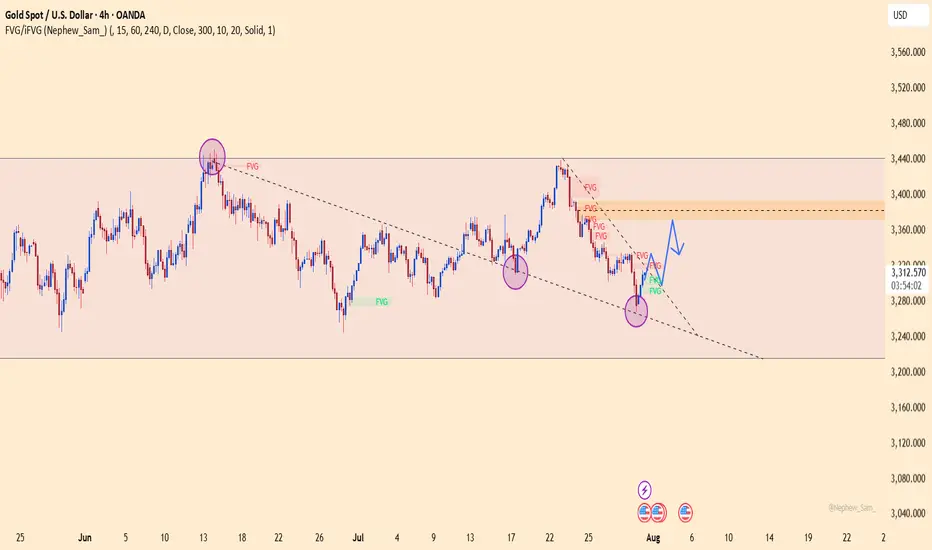
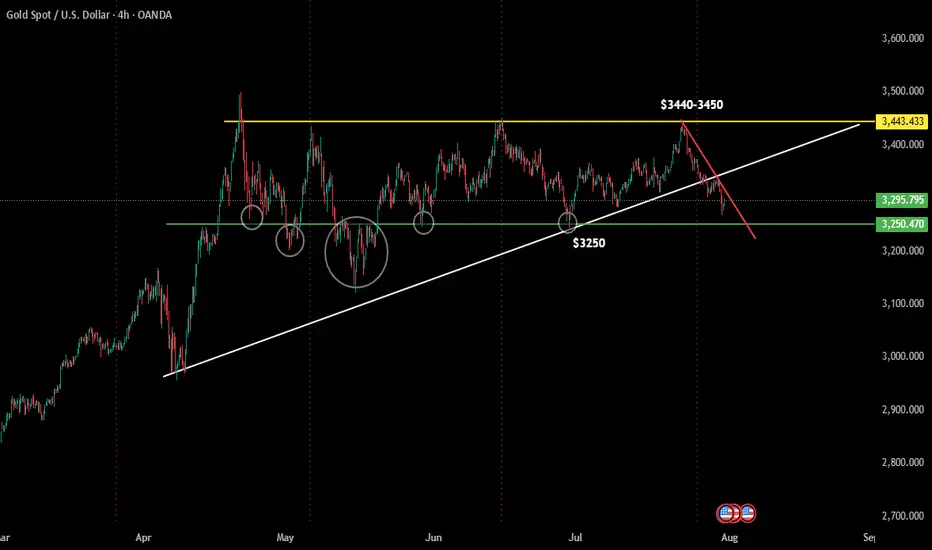
Gold Spot (USD) – Technical Outlook
Gold FXOPEN:XAUUSD continues to consolidate within the broad range of $3250–$3450, indicating both price consolidation and time correction ⏳—a healthy setup that often precedes a strong move in long-term bull markets 🐂.
The $3250–$3260 zone remains a solid demand area 🛡️, having held firm multiple times in recent months. While a recent dip below the short-term ascending trendline shows near-term weakness 🔻, the overall structure stays bullish as long as the lower end of the range holds.
🚀 A recovery above $3320, followed by a breakout through $3375, could ignite bullish momentum toward $3440–$3450, and possibly beyond.
🛒 Strategy:
Swing/Positional Traders: Consider accumulating near the lower end of the range for medium-to-long-term gains.
Short-term Traders: Range-bound trading is ideal—buy near support and sell near resistance, with tight stops.
⚠️ Note: A decisive close below $3250 would invalidate the bullish setup and could open the door for deeper corrections.
Gold comex holding sell trade from 3331 downside target on chartGold holding sell trade from 3331 , made low 3268 downside target 3255,3230,3205,3180
Sell on rise continuesly recommended below 3430

XAUUSD GOLD Analysis on (25/07/2025)#XAUUSD UPDATEDE
Current price - 3330
If price stay below 3355, then next target 3310,3290 and above that 3370
Plan;If price break 34330-3335 area,and stay below 3330,we will place sell order in gold with target of 3310 and 3290 & stop loss should be placed at 3355

XAUUSD – The Weakness of Gold – Are Investors Ready?Gold is being heavily impacted by the strengthening of the US dollar, driven by recently released economic data from the US. A strong increase in employment and a 2.5% GDP growth show that the US economy is growing stronger than expected, pushing the US dollar higher and creating downward pressure on gold.
The chart shows that gold is trading within a downward price channel, with key support and resistance levels already identified. The strong resistance at 3,345 USD continues to be a major challenge for any upward movement in gold.
If gold cannot break through these resistance levels and continues to decline below 3,310 USD, we may see a deeper correction.

XAU/USDThis XAU/USD trade setup is a buy trade, showing a bullish view on gold. The entry price is 3288, the stop-loss is 3278, and the exit price is 3327. This setup aims for a 39-point gain while limiting the risk to 10 points, which gives a strong risk-to-reward ratio of nearly 1:4.
Buying at 3288 suggests that the trader expects gold prices to rise due to favorable market conditions, such as a weaker US dollar, lower bond yields, or increased demand for gold as a safe-haven asset during economic uncertainty. The target at 3327 is likely set near a resistance level where profit can be booked once the price moves upward.
The stop-loss at 3278 protects the trader from excessive losses if the market reverses and moves downward. Since the stop-loss is tight, the trade requires close monitoring, and it is best executed during periods of strong bullish momentum in gold.
With disciplined risk management and strict adherence to the plan, this trade offers a good opportunity to profit from short-term price movement. Sticking to the entry, stop-loss, and target levels without emotional trading increases the chances of consistent success.
