Gold updated levels this week we again get good profit How My Harmonic pattern projection Indicator work is explained below :
Recent High or Low :
D-0% is our recent low or high
Profit booking zone: D13% -D15% is
range if break them profit booking start on uptrend or downtrend but only profit booking, trend not changed
SL reversal zone : SL 23% and SL 25% is reversal zone if break then trend reverse and we can take reverse trade
Target : T1, T2, T3, T4 and .
Are our Target zone
CFDGOLD trade ideas

Sell Area for Short Position on XAU/USD Based on Trading AnalysiBased on the trading analysis chart published by NaviPips on TradingView.com on June 20, 2025, at 23:09 UTC+5:30, here’s a recommendation for a sell area to take a short position on XAU/USD (Gold Spot / U.S. Dollar) as of 11:17 PM IST on June 20, 2025. The chart provides a 4-hour timeframe with key support and resistance levels, aligned with recent price action and technical patterns.
Context and Technical Analysis
Current Price: The chart shows XAU/USD with an open of $3,371.525, a high of $3,371.790, a low of $3,368.065, and a close of $3,369.115, reflecting a slight decline of -0.07% for the period. This suggests a consolidation phase near the current level of approximately $3,369–$3,371.
Resistance Zone: A significant resistance zone is identified between $3,425.000 and $3,457.047, marked by a red shaded area where price has previously faced rejection. This aligns with a potential triple top formation, indicating strong selling pressure at these levels.
Support Zones: Multiple support levels are outlined:
Support 1: $3,250.000–$3,275.000, a key area where price may find initial buying interest.
Support 2: $3,150.000–$3,169.121, a deeper support zone if the decline accelerates.
Support 3: $3,100.000, a psychological and technical level for a potential bottom.
Trend and Pattern: The chart features a descending triangle pattern, with a downward-sloping trendline connecting recent highs (e.g., around $3,425) and a horizontal support near $3,250–$3,275. A break below this support could confirm a bearish move.
Volume and Momentum: The chart includes volume bars and a momentum indicator (not fully detailed), but the price rejection at higher levels suggests fading bullish momentum, supporting a short opportunity.
Sell Area for Short Position
The optimal sell area for a short position on XAU/USD is in the $3,425–$3,457 resistance zone. This recommendation is based on:
Resistance Confirmation: The red shaded area on the chart indicates a strong resistance where XAU/USD has repeatedly failed to break through, forming a triple top. A retest of this zone (e.g., after a bounce from current levels) offers a high-probability entry for a short.
Trendline Rejection: The descending trendline intersecting near $3,425 suggests that a rejection here would reinforce bearish momentum.
Current Price Context: With XAU/USD currently at $3,369–$3,371, a move back toward $3,425–$3,457 (potentially driven by short-term profit-taking or a weaker dollar pause) would align with the chart’s resistance setup.
Trading Strategy
Entry Zone: Sell XAU/USD on a 4-hour candle close below $3,425 or after a clear rejection (e.g., a bearish candlestick pattern) at $3,435–$3,457. This confirms resistance holding and initiates the downward move.
Target Levels:
Target 1: $3,250–$3,275 (first support zone, as marked on the chart).
Target 2: $3,150–$3,169 (secondary support for a deeper correction).
Target 3: $3,100 (final support if bearish momentum strengthens).
Stop Loss: Place above $3,460 (just above the resistance high) or $3,470 (tighter risk management) to protect against a breakout above the triangle.
Risk Management: Use a risk-reward ratio of at least 1:2. For example, risking 15–25 pips ($3,435–$3,460 stop loss) to target 50–75 pips ($3,250–$3,275). Adjust lot size based on your risk tolerance (e.g., 1% of account per trade).
Confirmation: Wait for a 4-hour candle close below $3,425 or a rejection signal (e.g., shooting star or bearish engulfing) at $3,435–$3,457 to avoid false breakouts. Monitor volume for increased selling pressure.
Rationale
Powell’s Speech Impact: Following Jerome Powell’s June 18, 2025, speech, where he projected only two 0.25% rate cuts for 2025 with a data-dependent stance, the U.S. dollar may remain supported, pressuring gold downward from resistance levels like $3,425–$3,457.
Technical Setup: The descending triangle and triple top at $3,425–$3,457 indicate a high likelihood of a reversal, with support targets at $3,250–$3,275 aligning with the chart’s levels.
Market Context: The slight decline to $3,369 and consolidation suggest a pause before a potential retest of resistance, offering a strategic short entry.
Risks and Considerations
Breakout Risk: A strong bullish candle above $3,457 could invalidate the short setup, potentially targeting higher levels. Tight stop losses are critical.
Geopolitical Factors: Ongoing Middle East tensions could drive safe-haven buying, pushing XAU/USD above resistance. Monitor news for sudden spikes.
Data Events: Upcoming U.S. economic data (e.g., retail sales) could influence dollar strength and gold prices, requiring real-time adjustments.
Conclusion
The recommended sell area for a short position on XAU/USD on June 20, 2025, is $3,425–$3,457, with a 4-hour candle close below $3,425 or rejection at $3,435–$3,457 as confirmation. Target $3,250–$3,275, $3,150–$3,169, and $3,100, with a stop loss above $3,460. This strategy leverages the chart’s resistance zone and Powell’s cautious rate cut outlook. Practice proper risk management due to gold’s volatility.
If you’d like a chart to visualize these levels further or additional analysis, let me know!

XAU/USD Bullish Breakout from Flag PatternBullish Flag Formation: The price consolidated in a downward-sloping flag after a sharp bullish move. A breakout has occurred, signaling renewed buying pressure.
Support Zone: The breakout aligns with the horizontal support area around 3,392, reinforcing the bullish bias.
Upside Targets: Based on price structure and measured move projection:
First target: 3,435 – 3,452
Final target zone: 3,500+
Momentum Confirmation: The Ichimoku cloud supports bullish continuation as price trades above it, showing strong upward momentum.
Conclusion:
Gold appears to be resuming its uptrend after a brief consolidation. As long as price holds above the breakout level (around 3,392), the bullish targets remain valid. Ideal scenario for continuation traders looking for entries on minor pullbacks

Elliott Wave Analysis – XAUUSD Trade Plan for June 19, 2025
🌀 Wave Structure
On the H4 timeframe, following a strong selloff, price is now consolidating within a narrow price channel — suggesting that we are currently in wave b (black) of an abc correction.
This structure implies that one more leg down is likely to complete wave c (black). However, due to the overlapping and sideways nature of the move, it's difficult to clearly identify the end points of waves a and b, making traditional Fibonacci targeting less effective.
➡️ To improve accuracy, we’re combining Volume Profile data with price action and have identified four key support zones:
3349, 3335, 3313, and 3297
Among these, we’re giving special attention to:
🎯 Target 1: 3335
🎯 Target 2: 3297
We'll wait for bullish momentum signals near these levels to increase the probability of catching the end of wave c.
🔋 Momentum Outlook
Daily (D1): Momentum is about to enter oversold territory. By the end of today or tomorrow, the daily candle is expected to confirm this — suggesting a weakening bearish trend.
H4: Also approaching oversold. If price is hovering around one of the key support levels (3349 | 3335 | 3313 | 3297) when this happens, and the D1 is already oversold, then we may be looking at a high-probability reversal zone.
H1: Nearly oversold as well — expect a short-term bounce soon. The best timing for a BUY will be when the H1 starts turning bullish while both the D1 and H4 are oversold.
✅ Trade Setup
🔹 Scenario 1
BUY ZONE: 3336 – 3333
SL: 3326
TP1 | TP2 | TP3: 3345 | 3378 | 3402
🔹 Scenario 2
BUY ZONE: 3300 – 3297
SL: 3290
TP1 | TP2 | TP3: 3313 | 3345 | 3402
⏳ Patience is key — wait for confluence between support zones and momentum reversals. That’s where the high-probability BUY setups emerge.

XAUUSD – Gold Wobbles, Breakdown Risk IntensifiesGold is currently testing the lower boundary of the ascending channel after pulling back from the 3,398 USD resistance zone. The recent breakdown from a triangle pattern signals growing bearish pressure.
If the price fails to reclaim the 3,397 USD area, a continued move down toward 3,307 USD becomes likely — a level that coincides with key technical support. The latest FOMC minutes reaffirmed a “hawkish” stance, boosting the USD and adding downside pressure on gold.
The bearish outlook will strengthen if gold fails to hold the current support zone.

Gold price returns to 3363 price zone, gold selling pointPlan XAU day: 20 June 2025
Related Information:!!!
Gold price (XAU/USD) is seen consolidating its intraday losses to over a one-week low and is trading just below the $3,350 level during the first half of the European session. Earlier this week, the US Federal Reserve (Fed) trimmed its outlook for rate cuts in 2026 and 2027, which is seen as a tailwind for the US Dollar (USD) and is weighing on demand for the non-yielding yellow metal.
In addition, a generally positive tone in European equity markets is another factor putting pressure on Gold prices. However, rising geopolitical tensions in the Middle East may cap market optimism amid ongoing trade-related uncertainties and help limit losses for the safe-haven XAU/USD, which remains on track for weekly losses
personal opinion:!!!
Gold price in sell zone, trend line 3362
Important price zone to consider : !!!
SELL point: 3362 zone
Sustainable trading to beat the market

Gold Eyes Breakout from Ascending Channel Toward $3,500📈 Chart Analysis
1. Rising Channel Structure
Gold (XAU/USD) has been trading within an upward-sloping channel, marked by the blue trendlines connecting interior lows and highs, culminating at point C (~$3,497). The latest bounce off the lower channel near “B” reinforces bullish bias – if this trendline holds, another leg higher toward resistance around $3,497–$3,500 is likely.
2. Support & Resistance Confluence
The purple trendline and the dotted horizontal green level (~$3,498) converge near the projected breakout point. This synergy provides a strong pivot zone — a successful breakout would validate targets near channel highs.
3. Harmonic Pattern in Play
The chart displays a bullish harmonic structure (likely a Bat or Gartley formation), with retracement ratios (0.719, 1.627) anchoring reversal areas. These reinforce the bounce at B and the potential move toward point C.
4. Trade Scenarios
Bullish Scenario (primary): A bounce off the trendline triggers a rally to the channel top and resistance zone ($3,497–$3,500).
Bearish Caution: A drop below the trendline invalidates the pattern, potentially bringing prices back to horizontal support around $3,296 or even $3,120, as indicated at point A.
🛠️ Technical & Market Context
Technicals: Daily trend remains bullish as long as price holds above ~$3,340–$3,350, with resistance forming in the $3,380–$3,400 range
.
Fundamentals: Geopolitical tension (e.g., Middle East conflict) and safe-haven inflows continue to underpin gold — though Citi expects prices to eventually correct toward $3,300–$3,500 mid‑term
Sentiment: Some analysts advocate “selling the rallies,” especially into the $3,450–$3,500 zone . But central banks’ ongoing buying and potential Fed rate cuts support a stronger floor
.
✅ Trade Strategy
Scenario Entry Zone Target Stop Loss Placement
Play the Bounce ~$3,350–$3,360 $3,497–$3,500 Below trendline near B zone (~$3,320)
Breakout Trade On momentum above $3,400 $3,497–$3,550 Below breakout (sub-$3,380)
Bearish Trigger Break & close below trendline Back to $3,296 / 3,120 Just above trendline ($3,360)
🔍 Summary
Gold remains in a structurally bullish setup inside an ascending channel. The confluence of harmonic reversal, strong trendline support, and pending fundamental catalysts presents a high-probability opportunity to push toward the $3,500 area—provided the trendline and $3,340–$3,350 support hold. A drop below would invalidate the bullish outlook and favor deeper retracement.

Update buy goldThe next buying point we will collect goods at a price 2 points lower than expected, take profit at the above level.
Buy Gold Idea Recently Gold ran 300 pips and came back to hit entry point.

XAUUSD – Will Gold Break Free from the Downtrend?XAUUSD – Goldman Sachs Issues a Storm Warning: Will Gold Break Free from the Downtrend?
As gold continues to trade in a narrow range for the sixth week, one major catalyst could be on the horizon — Goldman Sachs has issued a bold warning about the US debt crisis. Indian traders, this may be the signal we’ve been waiting for…
🌐 MACRO OUTLOOK – US DEBT SET TO BREAK WWII RECORDS
US public debt is approaching historic highs, with interest payments projected to exceed $1 trillion in 2025 — surpassing even defense and healthcare spending.
Goldman warns that if urgent action isn’t taken, the US may face aggressive fiscal tightening, which could shrink GDP without lowering the debt-to-GDP ratio.
Root causes: overspending, rising interest rates, and deep political division.
📌 For Indian investors, such instability in the US economy tends to weaken the USD and increase demand for gold, which has always been a trusted asset in Indian households and institutional portfolios alike.
📉 TECHNICAL OUTLOOK (Updated – M30/H1)
Gold remains within a strong descending channel, and price action is currently showing signs of a bearish continuation setup.
The zone at 3,338.422 is acting as a mid-pivot. A pullback to the upper trendline (around 3,368.048) is expected before the next leg lower.
EMA ribbons are stacked downward, confirming short-term bearish momentum.
If the bounce toward 3,368 fails to break out, we expect price to revisit the FVG zone near 3,325.783, and possibly extend toward 3,309.256.
✅ TRADING PLAN (Unchanged Zones)
🟢 BUY ZONE: 3310 – 3308
SL: 3303
TP: 3314 → 3318 → 3322 → 3326 → 3330 → 3340 → 3350 → 3360 → ???
🟢 BUY SCALP: 3325 – 3323
SL: 3318
TP: 3330 → 3334 → 3338 → 3342 → 3346 → 3350 → 3360 → 3370 → ???
🔴 SELL ZONE: 3418 – 3420
SL: 3424
TP: 3414 → 3410 → 3405 → 3400 → 3396 → 3390 → 3385 → 3380
🔻 SELL SCALP: 3396 – 3398
SL: 3403
TP: 3392 → 3388 → 3384 → 3380 → 3375 → 3370
💬 FINAL THOUGHTS FOR INDIAN TRADERS
As we close the trading week, market liquidity may spike suddenly after Thursday’s US bank holiday. This could trigger a decisive move — either a breakout or a trap.
✅ Stick to your SL/TP, avoid emotional trading, and let the market confirm the direction.
Gold remains structurally bearish, but any shift in global sentiment — especially driven by US debt concerns — could flip the script fast.
Watch. Plan. Execute. Let the market come to you.

Gold Day Trade analysis - 20-6-2025Gold has decisively broken below the HVZ , confirming a structural shift in momentum. The bias is confidently bearish as the price now trades under key value, rejecting any bullish reclaim attempts. A temporary support exists near 3350, but it lacks strength unless backed by volume and momentum reversal.
Unless gold reclaims the HVZ range, the current structure favors continued downside. The day trade target is set at 3322, which aligns with the next demand zone from prior price action. Any pullbacks toward 3360–3365 can be seen as opportunities to build shorts with invalidation above 3370. As of now, all signs point to further weakness ahead.

Gold Trading Strategy for 20th June 2025📊 GOLD (XAUUSD) TRADING STRATEGY – INTRADAY LEVELS
Smart Plan Based on 1-Hour Candle Close
🟢 BUY SETUP
🔼 Buy Above: 1-Hour candle closes above $3388
🎯 Targets:
✅ Target 1: $3400
✅ Target 2: $3413
✅ Target 3: $3426
🛡️ Stop-Loss: Below $3375 (Risk Management Advised)
🔴 SELL SETUP
🔽 Sell Below: 1-Hour candle closes below $3360
🎯 Targets:
✅ Target 1: $3348
✅ Target 2: $3335
✅ Target 3: $3321
🛡️ Stop-Loss: Above $3372 (Risk Management Advised)
📌 Strategy Tips:
📅 Wait for a full 1-hour candle close above or below the breakout level.
⚖️ Stick to position sizing based on your capital.
📰 Avoid trading during high-impact news like Fed announcements or NFP.
⚠️ Disclaimer:
📢 This setup is for educational and informational purposes only. It is not financial advice. Always do your own analysis or consult your financial advisor. Trading involves risk. 📉💼 Use strict capital and risk management. 💰

XAUUSD Potential long setup before big drop ?Gold is currently showing signs of a potential bullish reversal after a prolonged pullback within the Keltner Channel. Price is consolidating near the lower boundary of the 1H channel, indicating possible accumulation. The Heikin Ashi candles are flattening, and momentum appears to be stabilizing.
📍 Entry Zone: Near 3,369
🎯 TP1: 3,391 – aligned with mid-Keltner resistance and recent structure
🎯 TP2: 3,415 – upper Keltner band, offering a strong confluence zone
🛡️ Stop Loss: Below 3,357 – under recent support and Keltner lower band

Gold until 3400 not break them sell on rise will continue How to take trades using Harmonic pattern projection Trade setup is explained below :-
Entry : 1st SL point : 0% is recent top or bottom.
Trailing D: 15.1% is work as trailing SL of buy or sell trade if hit then we have to book profit
.If price goes below 2nd D 22.5% to 24.5% range then early traders can make fresh reversals trade after breaking 1st D 15.1% safe traders can reversal trade after breaking Point D 22.5.4% to 24.5% range
Targets :
Target T1 : 36.1% to 38.3%
Target T3 : 49.1% to 52.5%
T3: 60.9% to 64.8% is our 3rd Target since this is reversal zone so must book profit if break then take fresh trade again
Target T4 : 76.4% to 79.7%
Next Targets are 100% , 127.2% ,141.4% and final Target 161.8%.
How to take reversal trade :
If price going upside/ downside then then buy or sell levels appear on Chart ( Automatically show when price reach any reversal zone of harmonic projection ).
Trailing SL:
After reach 1st Target trail SL to just above or below cost ( for example we are holding sell trade from 100 1st Target 110 hit then move trailing sl to 104-105 and move SL as price move upside or Downside)
Re- Entry :
For Re-entry in any pull back Point D ( 15.1% ) is used for re-entry then SL recent high or low Point SL ( 0% ) .
Blue Line is 1st support/ Resistance
Green line is 2nd support/ resistance
Red line is 3rd Support/ resistance

short term downtrend! sell gold 3379Plan XAU day: 19 June 2025
Related Information:!!!
Gold prices show minimal gains as the Asian session begins, following the Fed’s decision to maintain rates while indicating they are still considering two rate cuts. Meanwhile, US President Donald Trump’s comments on Iran triggered a pullback toward a weekly low of $3,362 before settling at around current levels. XAU/USD is trading at $3,375, up 0.19%.
On Wednesday, the Fed kept rates unchanged as expected and updated its economic projections for the United States (US). The median forecasts suggest that Gross Domestic Product (GDP) will be lower than in March’s projections, while the unemployment rate is expected to rise slightly. Inflation is likely to end around the 3% level, and the Federal Funds Rate forecast indicates policymakers are anticipating 50 basis points of easing
personal opinion:!!!
Gold price confirms downtrend in Asian session, price zone 3379 following downtrend line
Important price zone to consider : !!!
SELL point: 3379 zone
Sustainable trading to beat the market
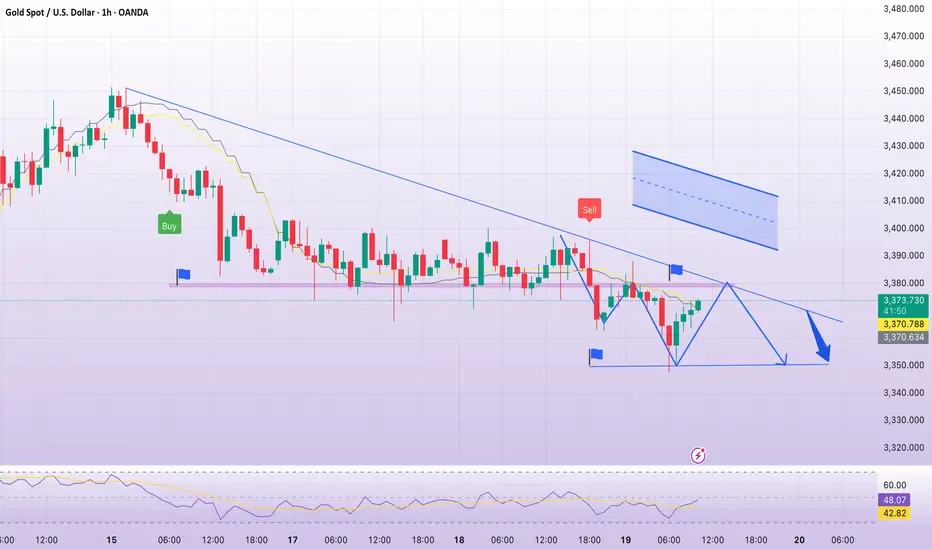
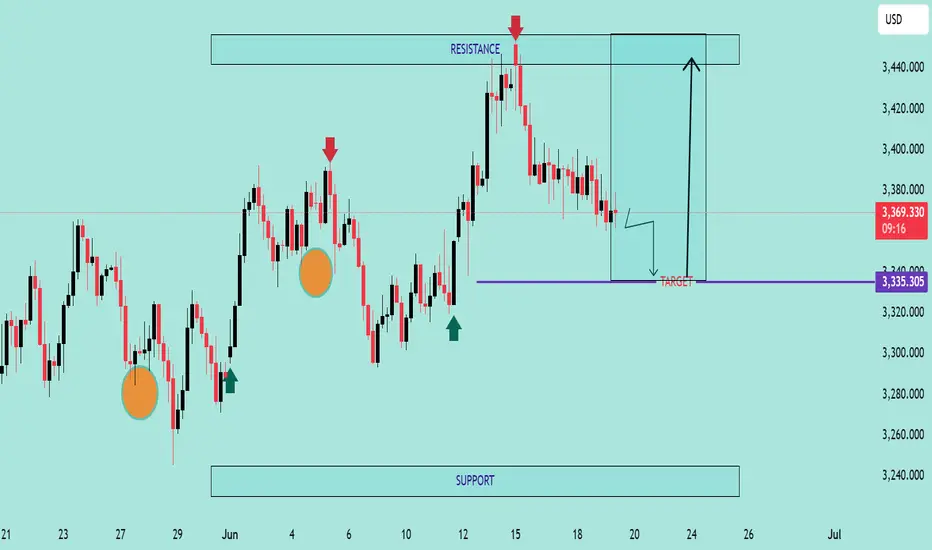
GOLD/USD Support Retest & Breakdown SetupGOLD/USD Support Retest & Breakdown Setup 📉🔍
🔹 Overview:
The chart indicates a potential bearish continuation pattern on GOLD/USD as the price is approaching a key support level at 3,335.305. Previous price action shows multiple rejections from the resistance zone (~3,435), followed by lower highs – a sign of weakening bullish momentum.
📊 Technical Analysis:
🔺 Resistance Zone (~3,435)
Multiple rejections (🔴 red arrows) indicate strong supply pressure.
Price has failed to break above this area thrice, forming a clear ceiling.
🔻 Support Zone (~3,335)
Marked as the target for a short setup.
Price is testing this level again after forming a minor consolidation below lower highs.
A clean break below this purple zone may trigger a continuation to the downside, targeting the broader support range below (~3,240).
🟠 Bearish Structure:
Series of lower highs (highlighted with circles).
Breakdown pattern is developing with declining bullish momentum.
📈 Potential Play:
A confirmed breakdown below 3,335 could lead to a drop toward the next major support.
If support holds, short-term bounce is possible but limited by the dominant resistance.
📌 Conclusion:
GOLD/USD is currently in a bearish setup, with the market eyeing a potential breakdown below a critical support zone. If this level fails to hold, we could see accelerated bearish momentum toward the lower support range.
💡 Caution: Wait for a confirmed close below support before entering any short trades.
XAU/USDPrice action trading is a methodology in financial markets where traders make decisions based on the actual price movements of an asset over time, rather than relying heavily on technical indicators or fundamental analysis. It involves observing and interpreting patterns and trends in price charts to predict future price movements.

Gold dips to $3347 and Bulls step in for $3400-$3430As safe haven money flow diverted to dollar rising to 99.15 Gold came under pressure caused by failure to reclaim successfully the psychological zone $3400 yesterday and prices dipped to $3347 where buyers resurfaces with a strong buying push taking the metal up for a rebound to immediate resistance $3378
Bulls need to make a strong move breaking above this $3378 hurdle to advance further towards day high $3388 to ease the way to reclaim $3400 and extend the rally towards next leg $3420-$3450
It is important to note that prevailing bullish momentum requires stability above $3347 failing which the metal may drop back to $3338-$3328-$3308

GOLD MOVING DOWNSIDE SLOWLYGold is at important key level, If it survivor to 3372 level, we can see little uptrend, otherwise I am looking downside for next two days. It will be impulsive. My it will as per my analysis, I am expecting to reach this 3298. Please boost the post if you like the idea and follow me on X - @beardobrothers
Please let me know if you need more analysis or which asset you like me to do analysis.

Gold (XAUUSD) Short Trade Breakdown
Timeframe used 30 min & 1 hour
Reason for Entry:
A clear trendline with 6 solid touch points was respected on both 30 min and 1hr.
Finally, a strong 1hr candle closed below the trendline — this is a major confluence and confirms a breakout.
In my experience, when a trendline is tested multiple times (like 6 times here), the breakout after that usually carries more weight, especially on higher timeframes like 1hr.
Entry taken right after candle close and break of structure.
Target : 3350.96 (based on support level & previous reaction zone)

GOLD GEARS UP FOR THE NEXT MOVE? All Eyes on Middle East & FedXAUUSD – GOLD GEARS UP FOR THE NEXT MOVE? All Eyes on Middle East & Fed
🌐 MACRO VIEW – WHAT'S MOVING GOLD?
🔺 Fed stays on hold, but Powell remains hawkish – His recent speech signals that inflation may persist due to ongoing geopolitical risks and rising commodity costs...
🔥 Middle East tensions could be the game-changer for gold prices:
If the US steps in as a mediator to de-escalate tensions between Israel and Iran, gold could see a deeper correction toward the 3,357–3,345 support zone, possibly lower...
On the other hand, Trump’s reported alignment with Israel and possible airstrikes on Iran would likely send gold soaring back to 3,417–3,440 levels, acting as a safe haven trigger.
📉 TECHNICAL SETUP (M30)
Gold is moving inside a descending channel, compressing within key EMAs (13–34–89–200).
A potential inverse head & shoulders pattern is forming at the bottom, signaling possible bullish breakout if confirmed.
Support remains firm around 3,345–3,357, while price struggles to break above the upper trendline.
✅ TRADING PLAN
🔵 BUY ZONE: 3,345 – 3,357
Entry: Look for bullish rejection and confirmation
SL: Below 3,342
TP: 3,373 → 3,384 → 3,403 → 3,417 → 3,440
🔴 SELL ZONE: 3,417 – 3,440
Entry: Wait for rejection and bearish confirmation near resistance
SL: Above 3,445
TP: 3,403 → 3,384 → 3,373 → 3,357
💬 FINAL THOUGHTS FOR INDIAN TRADERS
Even though the broader trend remains bullish, gold is not yet ready for a breakout – consolidation continues. Smart traders should stay patient, watch for clean setups, and manage risk well. Keep an eye on political developments, especially involving Iran, Israel, and the US, as they could trigger sharp moves in gold.
Trade smart. Let the market come to you.

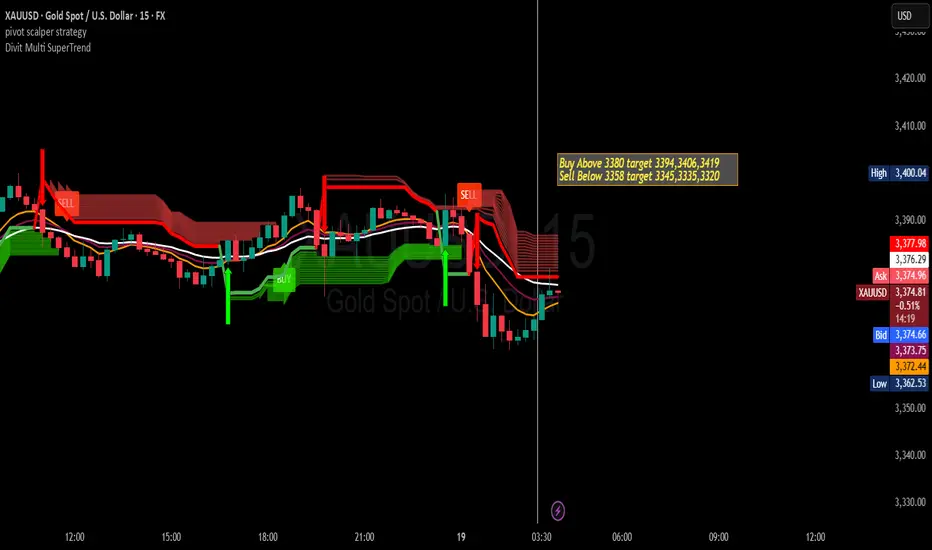
Gold Trading Strategy for 19th June 2025📈 GOLD Intraday Trading Plan – $XAU/USD
🟩 Buy Setup (Long Position)
Entry: 💰 Buy above the high of a 15-minute candle that closes above $3380
Targets:
🎯 Target 1: $3394
🎯 Target 2: $3406
🎯 Target 3: $3419
Suggested Stop Loss: 📉 Below $3370 (or use your risk management rule)
🟥 Sell Setup (Short Position)
Entry: 💰 Sell below the low of a 15-minute candle that closes below $3358
Targets:
🎯 Target 1: $3345
🎯 Target 2: $3335
🎯 Target 3: $3320
Suggested Stop Loss: 📉 Above $3368 (or as per your risk strategy)
⚠️ Disclaimer:
📌 Trading in financial markets involves substantial risk. This is not financial advice. Please do your own research and consult with a certified financial advisor before taking any positions. Use proper risk management and position sizing based on your capital.
Gold Ready to test 3700Gold Has taken support at 3300 (20 Dema)
There are Good chances that the Upper End of Parallel Channel at 3700 could be tested soon.
Unless 3300 is broken.

Gold at Trendline and Strong Support of 3370~3400After Previous week’s trending up move, gold has remained in consolidation nearing Trendline and having tested Strong Support at 3370
Above 3400 Gold is likely to test 3500 The Previous ATH
