Elliott Wave Analysis – XAUUSD | June 18, 2025
🌀 Current Wave Structure on H4
The recent drop has broken below the previously labeled wave 1 zone, requiring an adjustment to our wave count. Following the abc corrective move (black), a potential triangle formation is emerging.
At this point, we’re monitoring two possible scenarios:
🔹 Scenario 1 – Triangle as a Wave X Correction:
Price is forming an abcde triangle, potentially part of a larger WXY corrective structure. If this plays out, we may see a strong decline forming wave Y, targeting a break below 3297, and possibly extending to 3248.
🔹 Scenario 2 – Leading Diagonal Triangle as Wave 1:
If this is a leading diagonal triangle for wave 1, then wave 1 is likely completed, and we are currently in wave 2. In this scenario, price should hold above 3248, with likely support zones around 3335 or 3300.
🎯 Key Price Zones & Resistance Levels
Major Resistance: 3389 – 3402 (based on volume profile) – prime area for potential short setups.
Short-term Resistance Levels: 3389, 3402, 3412 – watch for reversal signals here.
🔻 Momentum Outlook
Daily (D1): Momentum is declining and expected to enter oversold territory within 2 candles – indicating a weakening downtrend and supporting the leading diagonal scenario.
H4: Momentum is preparing to turn bearish – supports short opportunities.
H1: Already turned bullish – suggests a possible corrective bounce before the next drop.
📌 Trade Plan
🔴 Sell Zone: 3400 – 3403
• SL: 3410
• TP1: 3365
• TP2: 3335
🟢 Buy Zone 1: 3335 – 3332
• SL: 3325
• TP1: 3365
• TP2: 3402
🟢 Buy Zone 2: 3302 – 3209
• SL: 3292
• TP1: 3335
• TP2: 3365
• TP3: 3402
CFDGOLD trade ideas

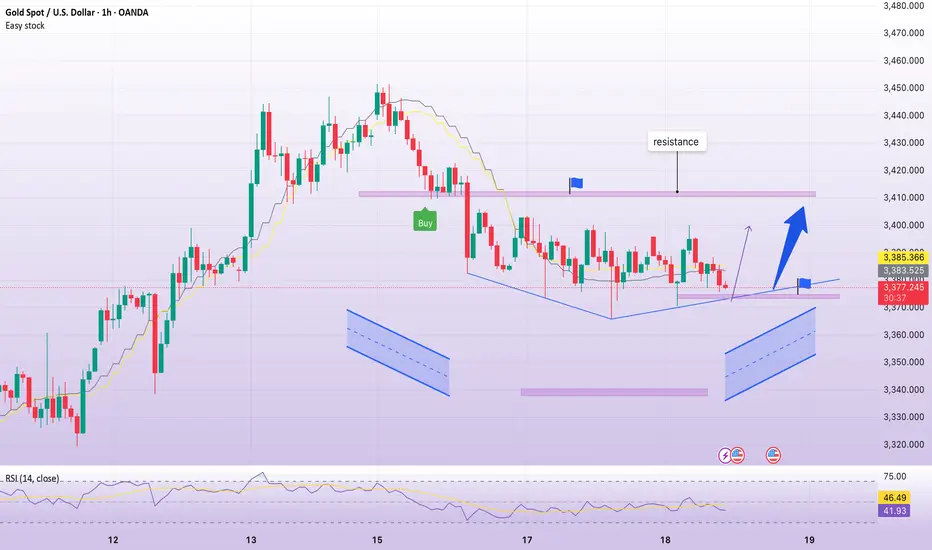
BUY 3375 , sideway H1, gold price accumulatesPlan XAU day: 18 June 2025
Related Information:!!!
Heading into the key central bank event risk, the disappointing US macro data released on Tuesday pointed to a softening economy and reaffirmed bets that the Fed will lower borrowing costs in September. This keeps a lid on the overnight US Dollar rally to the weekly peak.
The US Census Bureau reported that Retail Sales declined by 0.9% in May, compared to a 0.7% contraction expected and a 0.1% dip in April. Moreover, US Industrial Production fell short of estimates and contracted by 0.2% in May, following a revised 0.1% increase the previous month
personal opinion:!!!
sideways fluctuation in the price range of 3370 - 3395, gold price waiting for the result of keeping interest rates unchanged and continuing to accumulate around 3400
Important price zone to consider : !!!
Buy point: 3375 , 3338
Sustainable trading to beat the market
XAUUSD – Gold rebounds hard, a breakout rally may be brewing!After a perfect touch of the trendline at 3,367 USD, gold has sharply bounced back within a solid bullish structure. Notably, the latest low is significantly higher than previous pullbacks — a clear sign that buyers are still in control. The short-term target? None other than the 3,479 USD resistance — a key level that has rejected price twice before.
If this barrier is broken, gold could quickly surge toward 3,520 USD.
On the news front, expectations that the Fed may pause rate hikes due to weakening U.S. consumer data are cooling the dollar, giving gold room to rally. At the same time, simmering geopolitical tensions are fueling demand for safe-haven assets. With both technicals and sentiment aligning, this could be gold’s golden moment to catch the market off guard!

Update gold todayWith the gold idea, I see a nice value buy zone at 3352.7 and stop loss less than 6 prices My target comes up to 347x zone

GOLD to outperform SILVER massively for next few weeksOn May 3 I posted a chart on the ratio at that time GOLD was performing in comparison to SILVER. Now for past few weeks SILVER was doing the same. It we see the wave count it was wave 4 which is now almost complete. We can see GOLD massively outperforming SILVER in next few weeks.
Which side needs to be seen.
If both Rises then GOLD will rise massively wrt SILVER
If both falls the SILVER will fall much badly in comparison to GOLD.
My bet is on downside, rest time will tell.
Regards
THE KING TRADER

GOLD going to outperform SILVER in short termYes, for past many months GOLD has outperformed SILVER and this is likely to happen in course of next few weeks and months.
That implies:
1. If both of them falls then, SILVER will fall more than GOLD
2. If both rises than GOLD will rise more than SILVER
We are in a ABC Correction and after it is completed than SILVER will outperform GOLD massively

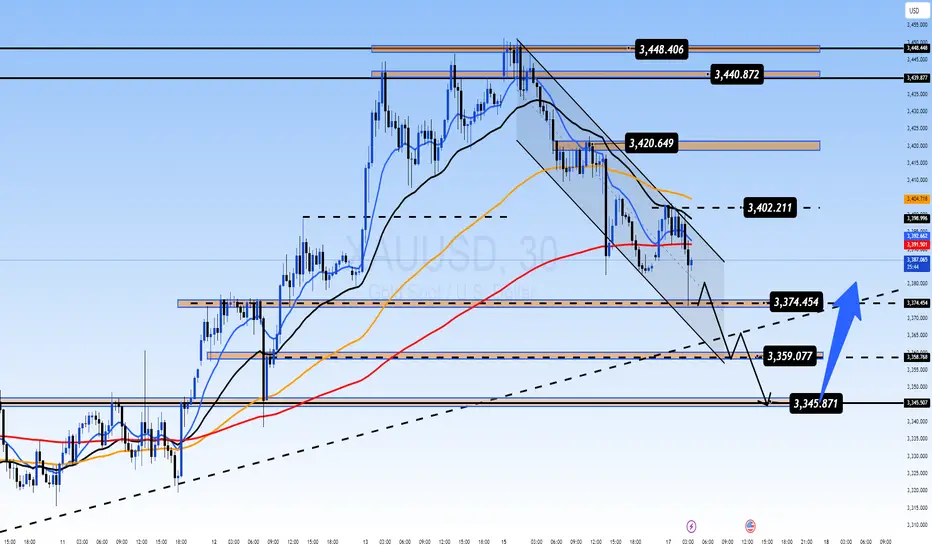
Gold Consolidates Ahead of Fed: Buy Signal or Bull Trap?🟡 XAUUSD 18/06 – Gold Consolidates Ahead of Fed: Buy Signal or Bull Trap?
🌐 MACRO & SENTIMENT OVERVIEW
The US Dollar Index (DXY) gained 0.7% to start the week, as markets anticipate the Fed may keep rates higher for longer due to rising oil prices and global geopolitical uncertainty.
However, with the upcoming FOMC meeting and US retail sales data, there is a strong potential for a shift in tone if growth shows signs of weakness.
Geopolitical tensions – particularly in the Middle East (Israel–Iran conflict) – continue to support gold’s defensive appeal, even as short-term profit-taking creates volatility.
📊 TECHNICAL OUTLOOK – M30 Chart
Gold is currently trading inside a descending channel, but price structure remains above EMA 13–34–89, keeping the potential for a bullish reversal alive.
Liquidity has been absorbed multiple times near 3,345, aligning with dynamic support from trendline and horizontal structure → a key decision zone for bulls.
On the upside, resistance between 3,440 – 3,445 remains a critical distribution zone, likely to trigger sell reactions if price fails to break convincingly.
🎯 TRADE SETUPS
🔵 BUY ZONE: 3345 – 3343
SL: 3339
TP: 3350 – 3354 – 3358 – 3362 – 3366 – 3370 – 3380 – 3400 – ???
📌 This zone overlaps with trendline and recent demand areas. Watch for bullish price action confirmation (e.g., engulfing, pin bar) before entering. If confirmed, we expect a strong bounce targeting the upper channel and beyond.
🔴 SELL ZONE: 3442 – 3444
SL: 3448
TP: 3438 – 3434 – 3430 – 3425 – 3420 – 3410 – 3400
📌 This is a strong supply area that has rejected price multiple times. Look for reversal signals like bearish divergence or rejection wicks to consider short entries.
✅ SUMMARY
Gold is caught in a critical reaccumulation zone ahead of the FOMC statement. Patience is key: allow the market to react at liquidity zones and follow price behavior instead of chasing moves.
Stick to your zones – protect your capital – and let the setups come to you.

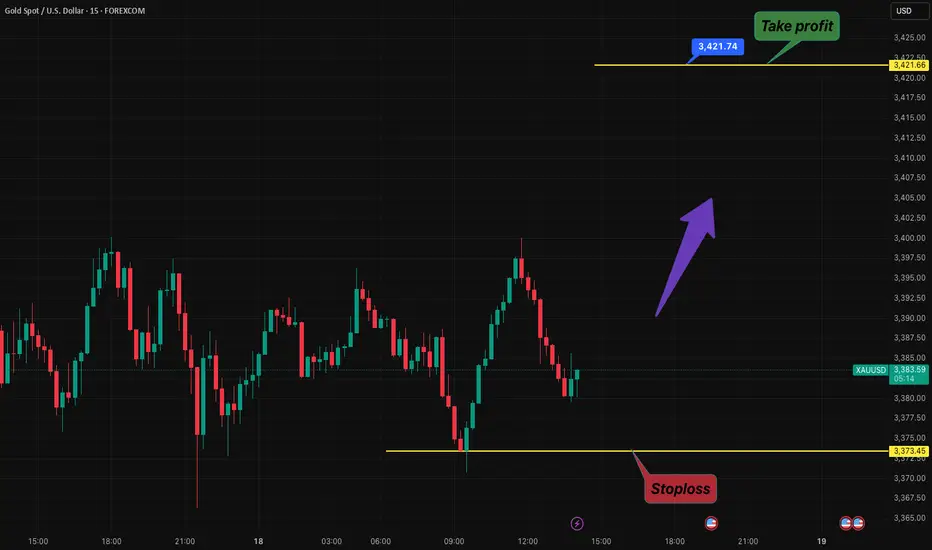
BUY XAU and Take profit 3.421$The price is continuously forming bearish candles on the M15 timeframe, while a false channel breakout appears at the diagonal resistance. The target of $3,421 is considered achievable
On the sell side, crowd participation is high with a downward bias, which is not a favorable choice. Enter a buy position and wait for a take-profit opportunity
Stoploss and take profit in this picture
good luck!1
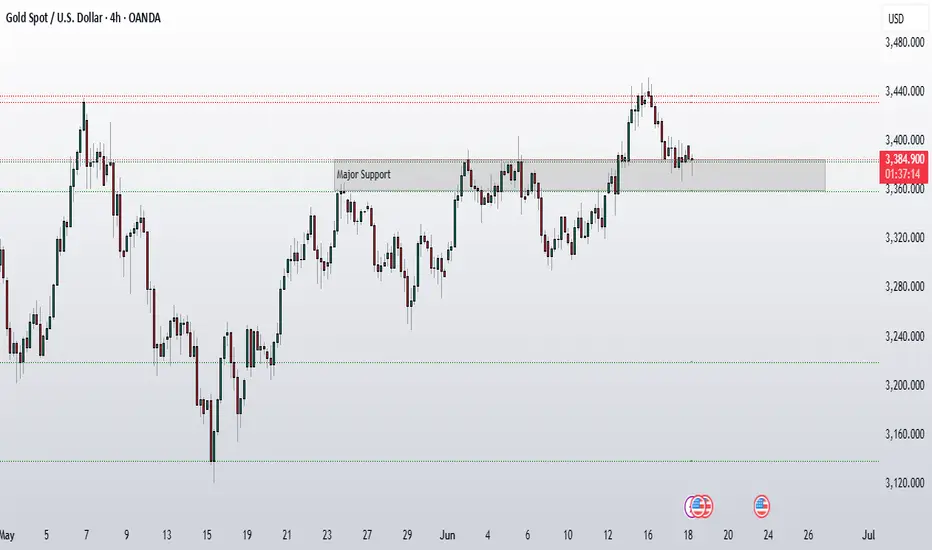
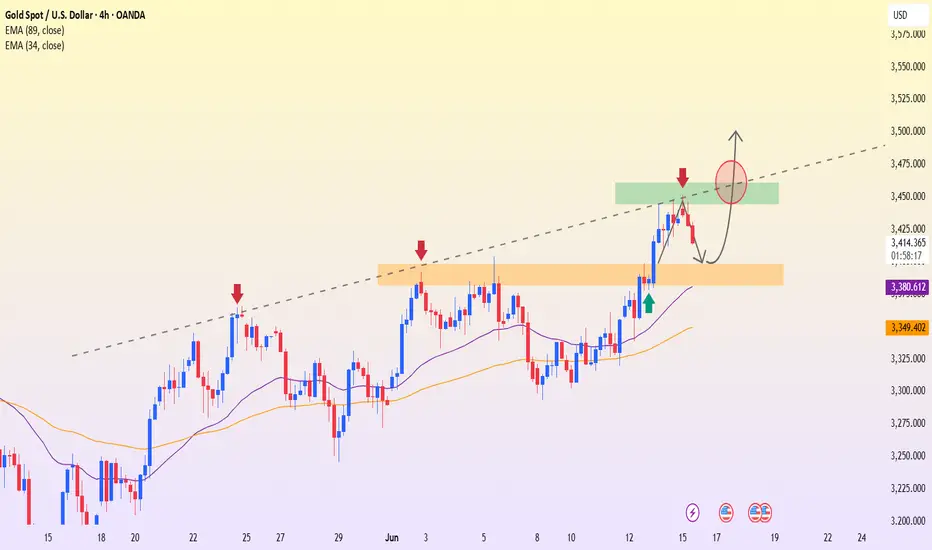
XAUUSD – Strong bullish momentum, but key resistance remainsGold on the H4 chart is maintaining a steady uptrend, consistently forming higher lows while respecting the ascending trendline and both key EMAs (EMA34 & EMA89). After a brief pullback, price is now approaching a major resistance zone around 3,441 USD — a level that previously rejected bullish attempts.
The market structure suggests two possible scenarios:
If price breaks above 3,441 USD with strong buying pressure, the uptrend will be confirmed and could extend toward higher levels.
Conversely, if rejected again, price may retreat toward the support zone at 3,347–3,356 USD for accumulation before resuming the upward move.
On the fundamental side, expectations of a Fed rate cut—driven by significantly weaker U.S. retail sales—are pressuring the USD, which in turn supports gold prices in the short term.

BUY GOLDIt is possible that there is a BUY opportunity . We should wait for confirmation before entering. If the confirmation is negative, then we should exit the trade. If the confirmation is positive, then we can enter the trade.
Entry---------- 3383
target----------3429
stoploss-------3363

GOLD AT CRITICAL SUPPORT: FOMC Minutes Could Trigger Next moveCurrent Market Situation:
Gold opened with a significant gap up on Monday but failed to claim above the 3450 level. Since then, the price has been in pullback mode and is now sitting at a critical major support zone.
Key Support Zone:
Upper Level of support zone: 3,385
Lower Levelof support zone: 3,360
This support zone represents a crucial decision point for gold next directional move.
Today's Catalyst:
The FOMC minutes release today will likely be the key driver that determines gold's next move. This fundamental event could provide the momentum needed to break the current consolidation.
Two Potential Scenarios:
Bullish Scenario:
If gold successfully holds above the support zone (particularly above 3,360:lower level of this zone) and manages to reclaim Monday's high around 3,450, we could see a strong buying rally develop that can push price to 3500 or higher levels. This would indicate that the pullback was merely a healthy correction before the next leg higher.
Bearish Scenario:
If gold breaks below the lower support level of 3,360, it would signal further weakness and we could see the price targeting lower levels. This break would invalidate the current support structure and open the door for extended selling.
Gold Trading Strategy for 18th June 2025🟢 BUY SETUP
📌 Condition:
Buy only if a 1-hour candle closes above $3400, and price breaks above the high of that candle.
🎯 Targets:
🥇 Target 1: $3413
🥈 Target 2: $3426
🏅 Target 3: $3438
🔒 Stop Loss: Below $3395 (or candle’s low if using dynamic SL)
🔴 SELL SETUP
📌 Condition:
Sell only if a 1-hour candle closes below $3379, and price breaks below the low of that candle.
🎯 Targets:
📉 Target 1: $3365
📉 Target 2: $3355
📉 Target 3: $3345
🔒 Stop Loss: Above $3385 (or candle’s high if using dynamic SL)
📊 TRADE MANAGEMENT TIPS
✅ Use 1-hour timeframe for setup
✅ Wait for candle close for confirmation
✅ Use trailing SL once Target 1 is hit
✅ Trade with the overall trend for higher probability
⚠️ DISCLAIMER
📢 This strategy is for educational purposes only and not investment advice. Always do your own analysis and consult a licensed financial advisor. Trading in gold and financial markets involves risk of capital loss. Use proper risk management and only trade with money you can afford to lose.

Long xauusd retracememt at trend line Xauusd is accumulated at this level and retracement at daily trend line. Long with the target of 3440, 3500, 3600 OANDA:XAUUSD

XAUUSD – Bullish Signal Taking ShapeGold begins the week on a positive note, supported by:
U.S. inflation coming in lower than expected, raising expectations that the Fed will cut interest rates in the coming months.
Tensions between Israel and Iran, which are driving safe-haven flows into gold.
On the H4 chart, the price is pulling back toward the $3,397 support zone, which aligns with both the EMA and a previous accumulation area. The current structure suggests a potential W-shaped reversal pattern, which could propel gold toward the $3,501 resistance level.
Main strategy: Look for buy setups around $3,397 upon bullish confirmation.
Target: $3,500
Stop loss: Below $3,380
Gold remains in an uptrend. The $3,397 zone is the key level that could trigger the next upward move.
Gold on the Rise! – Bullish Setup in Focus The chart shows a repeating consolidation‑then‑breakout pattern, with Gold forming ascending swing structures, consolidating in rectangles (green), then riding higher along a rising trendline (purple). Price has just bounced off that trendline again, signaling a possible new leg up—potentially targeting the upper range near $3,448–3,450. A clear breakout above that level could open the door toward $3,500+.
📍 Trading Plan
🎯 Entry
Long on breakout above recent consolidation highs (~$3,440–3,448).
Alternatively, buy the dip near the purple trendline (~$3,385–3,390), with confirmation (hammer candle, bounce).
🛑 Stop‑Loss
For breakout: just below the top of the rectangle consolidation (~$3,389).
For trendline entry: slightly below recent swing low (~$3,358–3,360).
🎯 Profit Targets
Primary: upper rectangle level (~$3,448–3,450).
Extension: historic all‑time high region (~$3,500) → next major zone.
🎥 Path
Potential minor pullback toward trendline.
Bounce establishes support.
Surge toward top of range.
Breakout with trend continuation to new highs.
📊 Trade Risk & Reward
Target ~60–100 pts above entry, stop ~50 pts below → ideal Risk:Reward ≥ 1:1.2.
📌 Key Levels to Monitor
Level Role
$3,360 Swift dip support (green base line)
$3,390–3,400 Trendline confluence zone
$3,440–3,450 Breakout area & top of rectangle
$3,500 Next major resistance/all‑time high
🧭 Market Context & Drivers
Broad uptrend remains intact amid geopolitical tensions, especially the Israel–Iran situation, which continues to support safe-haven flows
investing.com
+15
reuters.com
+15
barrons.com
+15
forex24.pro
+1
goldpredictors.com
+1
.
Markets are positioning ahead of Fed’s June 18 decision; dovish signals could fuel continuation toward new highs (~$3,500+)
fxempire.com
.
Technical structure reflects bullish momentum—ascending wedge patterns with shallow dips and strong trendline bounces
fxstreet.com
.
✅ Summary
Bias: Bullish – uptrend intact.
Strategy: Go long on dip near trendline or on breakout above $3,445.
Stop‑Loss: Just below last swing low ($3,360).
Targets:
Near-term: $3,448–3,450
Medium-term: $3,500+
Stay tuned for Fed statements and Middle East headlines—they’ll be catalysts.

GOLD/USD Bearish Rejection at Resistance ZoneGOLD/USD Bearish Rejection at Resistance Zone 📉🟥
📊 Technical Overview:
The chart for GOLD/USD shows a clear price action behavior between a well-defined resistance zone (~3,480–3,510) and a support zone (~3,260–3,280).
🔻 Bearish Signals:
The price has tested the resistance zone multiple times (highlighted with red arrows and orange circles) but failed to break above it, indicating strong selling pressure.
The current price action suggests another lower high formation, which is a bearish signal 📉.
Recent candles are rejecting the upward move, pointing to potential downside movement.
🟩 Support Confirmation:
Previous reactions from the support zone (green arrows) show that buyers have consistently stepped in near the 3,260–3,280 range.
This level remains a key demand zone where a bounce might be expected.
🔁 Outlook:
If the price continues to reject the resistance and follows the pattern, we might see another drop towards the support area.
A break below the support zone would confirm a bearish breakout and could open the door to deeper downside targets.
📌 Conclusion:
GOLD/USD is trading within a range, but the repeated failures at resistance suggest bearish momentum might take control in the short term. A move back toward the support zone is likely unless a breakout above resistance occurs.
📉 Resistance: 3,480–3,510
🟩 Support: 3,260–3,280
🔍 Bias: Short-term Bearish unless resistance breaks

XAUUSD GOLD Analysis on (17/06/2025)#XAUUSD UPDATEDE
Current price - 3380
If price stay above 3370 then next target 3400,3420 and below that 3350
Plan;If price break 3382-3378 area,and stay above 3380,we will place buy order in gold with target of 3400 and 3420 & stop loss should be placed at 3370

Sell XAU with 2 take profit pointsThe price has broken down and weakened, lacking growth momentum. The news about the war between Israel and Iran is only for reference and currently holds no substantial value
Sell XAU with 2 take profit in this pictures
Good luck all!!

Gold Consolidating at Key Support: Is the Next Move a Reversal?XAUUSD 17 June – Gold Consolidating at Key Support: Is the Next Move a Reversal?
After a strong rally to 3,448 – the highest level in 8 weeks – gold faced profit booking and pulled back sharply towards 3,385. However, price is now sitting at a critical confluence of technical zones, and smart money may be preparing for the next strategic leg. Let’s decode the structure...
🌐 Macro & Market Sentiment
Geopolitical heat remains: Israel–Iran tension is far from cooling. Trump's statements about evacuating Tehran and pushing for a new nuclear deal are fueling safe-haven demand.
Fed policy meeting + US Retail Sales ahead: These upcoming events will shape inflation expectations and rate path clarity. Traders are cautious but alert.
Capital rotation: Large funds may be temporarily exiting gold and shifting into oil and stocks—triggering short-term volatility, not trend reversals.
📊 Technical Breakdown (M30-H1 Confluence)
Trend channel: Gold is currently trading within a descending short-term channel after failing to hold above the 3,440–3,448 supply zone.
EMA alignment (13-34-89-200): Squeezing closer, indicating momentum exhaustion and possible bullish crossover if support holds.
Fair Value Gap (FVG) + historical support + ascending trendline align near 3,345 → strong liquidity pocket forming here.
🎯 Trade Setups for Today
✅ BUY Setup (Liquidity Rebound)
BUY ZONE: 3,344 – 3,342
SL: 3,338
Targets:
→ 3,348 → 3,352 → 3,356 → 3,360
→ 3,364 → 3,368 → 3,372 → 3,380+
🧠 Ideal entry if price forms bullish rejection candle in this zone, especially during London open. Look for long-tail or inside bar confirmation.
⚠️ SELL Setup (Scalp-Only if Rejected)
SELL ZONE: 3,440 – 3,442
SL: 3,446
Targets:
→ 3,436 → 3,432 → 3,428 → 3,424
→ 3,420 → 3,415 → 3,410
📌 Only short if there's strong rejection from this supply zone. No blind entry—wait for clear bearish momentum or reversal wick with high volume.
🧭 Market Psychology
Retail traders were trapped on the breakout—smart money likely unloading at highs.
Price is now retracing to gather liquidity. If the 3,344 zone holds, we could see a powerful impulsive recovery.
Don’t trade the noise — trade the zones. Volume behavior around these levels will reveal market intention.
📌 Final Thoughts
This is a classic case of controlled retracement after a breakout. If gold finds support at the BUY ZONE, the next bullish wave could target 3,400+ again. But if the 3,345 area fails, deeper correction toward 3,320 is possible.
🧘♂️ Stay patient. Let price come to you.
✅ Follow structure, respect SL, and trade with clarity.
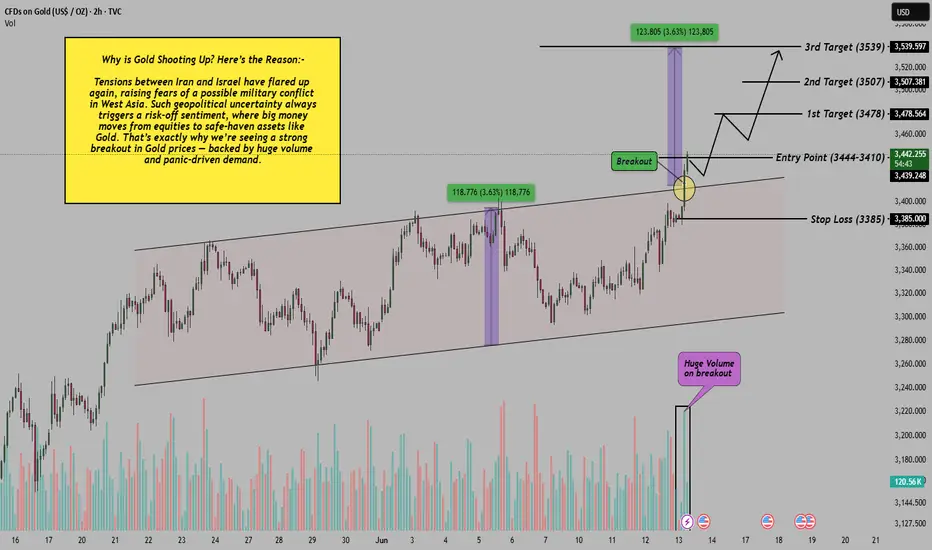
War Fear Driving Gold: Iran-Israel Conflict Fuels Breakout!Hello Evevryone, let's discuss about Gold today as it has officially broken out of its parallel (Neutral bullish) channel with a powerful candle backed by massive volume surge , confirming strong buying interest — likely driven by safe-haven demand amid the rising Iran-Israel conflict. The breakout above 3444–3410 zone indicates a potential trend continuation setup where price may now retest the breakout area before pushing higher.
This move isn’t just technical — it’s fundamentally supported by fear in global markets. Whenever war fears rise, investors rush towards Gold to hedge their capital. That’s exactly what this spike reflects.
If you liked this post, don’t forget to LIKE and FOLLOW!
I regularly share high-quality trading setups based on real analysis, OI data, and smart risk-managed strategies.
Disclaimer: This analysis is for educational purposes only. Please consult a financial advisor before making investment decisions.
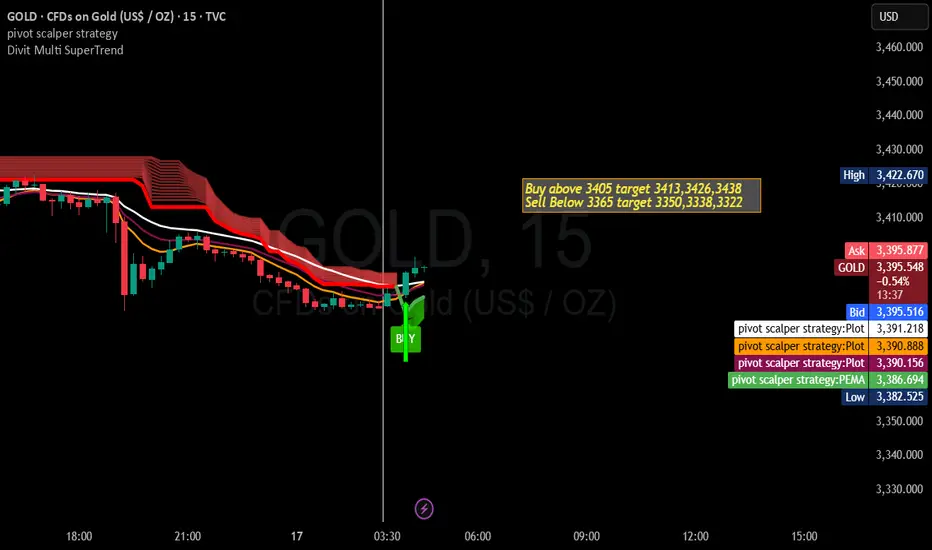
Gold Trading Strategy for 17th June 2025🟡 GOLD XAUUSD - INTRADAY STRATEGY 🔁
📅 Date: June 17, 2025
📈 Type: Price Action-based Buy/Sell Setup
🕘 Session: Suitable for London / US Market Hours
🟢 BUY SETUP - Long Trade Opportunity
📌 Condition:
🔼 Enter Buy only above the high of the 1-Hour Candle,
✅ After a 1-Hour candle closes above 3405.
🎯 Targets:
Target 1: 🎯 3413
Target 2: 🎯 3426
Target 3: 🎯 3438
🔒 Stop Loss: Just below the 1-hour candle low (Dynamic – Based on setup)
💡 Ideal for momentum breakouts and bullish sentiment continuation.
🔴 SELL SETUP - Short Trade Opportunity
📌 Condition:
🔽 Enter Sell only below the low of the 15-Min Candle,
✅ After a 15-Min candle closes below 3365.
🎯 Targets:
Target 1: 🎯 3350
Target 2: 🎯 3338
Target 3: 🎯 3322
🔒 Stop Loss: Just above the 15-min candle high (Dynamic – Based on setup)
💡 Suitable for breakdown traders catching the bearish wave.
🧠 Tips for Execution:
Confirm breakout with volume and trend alignment.
Avoid false breakouts—wait for candle close confirmation.
Use appropriate risk-reward (at least 1:2).
Stay updated with macroeconomic events 🗓️ (e.g., Fed speeches, CPI data).
⚠️ Disclaimer:
📌 This analysis is for educational and informational purposes only.
💼 Trading in commodities and forex involves high risk.
💸 Always consult with your financial advisor before making any trading decisions.
🚫 We are not responsible for any profits or losses incurred based on this analysis.
Gold 18 points profit booked on buy trade now holding buy again How to take trades using Harmonic pattern projection Trade setup is explained below :-
Entry : 1st SL point : 0% is recent top or bottom.
Trailing D: 15.1% is work as trailing SL of buy or sell trade if hit then we have to book profit
.If price goes below 2nd D 22.5% to 24.5% range then early traders can make fresh reversals trade after breaking 1st D 15.1% safe traders can reversal trade after breaking Point D 22.5.4% to 24.5% range
Targets :
Target T1 : 36.1% to 38.3%
Target T3 : 49.1% to 52.5%
T3: 60.9% to 64.8% is our 3rd Target since this is reversal zone so must book profit if break then take fresh trade again
Target T4 : 76.4% to 79.7%
Next Targets are 100% , 127.2% ,141.4% and final Target 161.8%.
How to take reversal trade :
If price going upside/ downside then then buy or sell levels appear on Chart ( Automatically show when price reach any reversal zone of harmonic projection ).
Trailing SL:
After reach 1st Target trail SL to just above or below cost ( for example we are holding sell trade from 100 1st Target 110 hit then move trailing sl to 104-105 and move SL as price move upside or Downside)
Re- Entry :
For Re-entry in any pull back Point D ( 15.1% ) is used for re-entry then SL recent high or low Point SL ( 0% ) .
Blue Line is 1st support/ Resistance
Green line is 2nd support/ resistance
Red line is 3rd Support/ resistance

XAU/USD Bullish Continuation SetupThe chart illustrates a bullish market structure for XAU/USD, with price action currently trending upwards. Key technical observations:
Support Zone:
Price has recently bounced from a support zone around 3,399.710, indicating strong buying interest.
Bullish Projection:
A bullish continuation is expected. The chart outlines a potential scenario with a minor retracement towards 3,432.835 or 3,399.710, followed by a strong upward move.
Targets:
Immediate resistance is around 3,502.669.
If broken, price may aim for 3,550.351.
Final projected target lies near 3,680.000, which aligns with a historical supply zone.
Indicators:
The green enveloping bands suggest increasing volatility, with the price respecting the upper band, supporting bullish momentum.
Conclusion:
XAU/USD appears poised for a bullish breakout continuation. A potential pullback could offer a buy opportunity, targeting higher resistance zones as long as the structure remains intact.
