7.10 Gold Analysis7.10 Gold Analysis
I. Fundamentals
(1). Escalating trade frictions boost safe-haven demand:
On July 9, the Trump administration imposed tariffs (20%-30%) on six countries including the Philippines and Brunei, and announced a 50% tariff on copper imports from August 1, sparking concerns about the global supply chain.
The EU is accelerating negotiations with the US (aiming to reach an agreement before August 1), but differences in automobile tariff quotas remain, and policy repetition continues to amplify market uncertainty.
Impact: Safe-haven funds flow into gold, and gold prices rebounded rapidly from the previous day's low of $3,282 to above $3,320.
(2) Fed policy differences suppress expectations of rate cuts:
The minutes of the June meeting showed that the Fed was divided into three factions: the mainstream supported rate cuts this year but excluded July; the hawks tended to stay put; and the doves advocated immediate action.
Trump pressured for rate cuts (saying that the interest rate was 3 percentage points too high), but strong employment data (June non-farm payrolls) made the Fed cautious, and the market expected the first rate cut in September to be the most likely.
Impact: The US dollar index remained stable near 97.4, limiting the upside of gold prices; the decline in US Treasury yields (10-year to 4.34%) provided some support
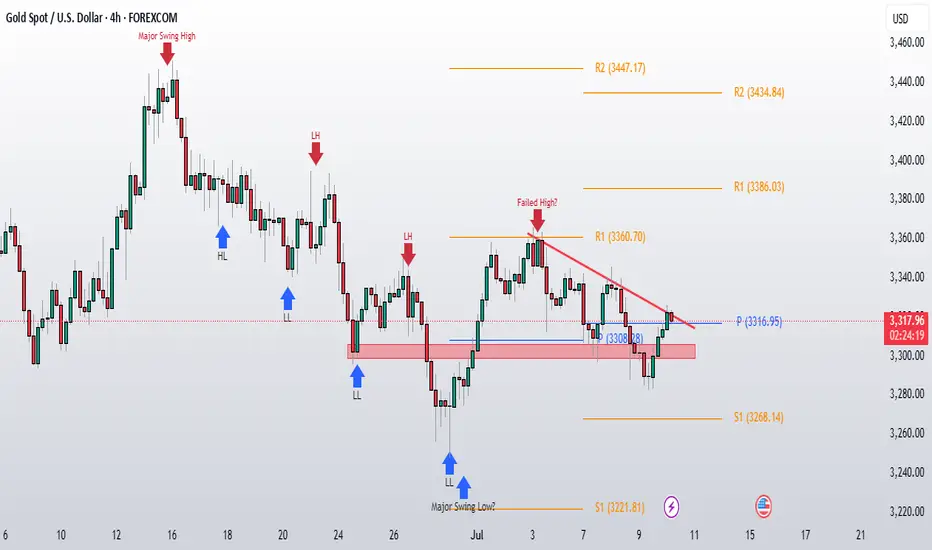
2. Technical patterns and key positions
Daily structure
Core resistance: 3330 (5-day/10-day/60-day moving averages densely intersecting area, short-term long-short watershed)
Core support: 3300 (May-June rising trend line support, long defense line)
K-line signal: Wednesday closed with a lower shadow positive line, fell to 3283 and then rebounded to regain 3300, confirming short-term stabilization, but it needs to break through 3330 to open up upside space.
Short-term momentum
Break through the 3296-3282 oscillation range, reaching a high of 3317, and continue the upward trend in the early trading, showing that the bulls are accumulating strength.
If it stabilizes above 3300, it is expected to continue the rebound and test 3330.
3. Long and short logic sorting
Bullish basis:
1. Technical repair completed: After the sharp drop on Wednesday, it quickly fell and rebounded, closing with a positive line to repair part of the decline, and the short-selling potential weakened.
2. Support effectiveness: The 3300 trend line support has been tested for two consecutive trading days (3282 on Tuesday and 3282 on Wednesday), forming a double bottom prototype.
3. Momentum continuation: The rise continued in the early trading, and breaking through the overnight high of 3317 can strengthen the confidence of bulls.
Bearish risk:
1. 3330 strong pressure has not been broken: the triple moving average pressure (5/10/60 days) needs to be broken through with large volume, otherwise it is easy to trigger a sell-off.
2. US dollar pressure: The high level of the US dollar limits the upward space of gold prices.
4. Specific operation strategy
Core idea: Buy on dips, short on key resistance areas
1. Long strategy:
Entry position: Buy after retracement to 3300-3305 (trend line support + neckline of the previous day)
Target: 3320→3330 (lightening area), break through 3330 to see 3345-3350
Stop loss: below 3295
2. Short strategy:
Trigger condition: The first touch of 3330 is under obvious pressure (long upper shadow/1-hour stagflation)
Target: 3315→3305
Stop loss: above 3335 (stop loss when breaking through the moving average concentration area)
3. Breakthrough follow-up strategy:
If the volume breaks through 3330, chase after 3320-3325, target 3345-3350
If 3300 is lost, short at 3305, target 3285-3282
Key reminder:
Focus on the attack and defense of 3300 support and 3330 resistance in the Asian and European sessions, and operate with a light position before the US data.
3345-3350 is a strong resistance area, and long positions can be actively reduced in this area.
V. Risk events
Waiting for the release of US unemployment data: If the data is lower than expected (showing strong employment), it may suppress the expectation of interest rate cuts and be bearish for gold.
Speech by Fed officials: Pay attention to whether the signal of "opposition to July rate cuts" is released (the minutes of the meeting show that most officials tend to wait and see).
Thank you for your attention, and I hope my analysis can help you.
CFDGOLD trade ideas

Gold Resumes Bullish Momentum with Break above 4 hourly 50 EMA
Gold appears to have formed a local demand base at 3305-3310 as bulls succeed defending the psychological zone 3300 and yesterday's FOMC Meeting Minutes provided much needed boost supportive for rally to reclaim 1 hourly 50 EMA 3313 and 4 hourly 50 EMA 3321 also aligning with 38.2% Fibonacci zone of upwave 3248-3366
Today's recovery rally extended to 3328 and price stability above 3320-3317 looks supportive for further upside towards 3330-3332 which meets descending Channel Resistance and bulls need a strong breakout above this area for validation of current bullish trend.
Decisive acceptance above 3332 will face challenge at 3338-3341
In the view of current bullish momentum, any retracement towards support zone 3310-3306 is likely to attract buyers.

Gold’s Recent Movement and Market SentimentXAUUSD: Gold Bounces Strongly From the Bottom, Is This the Start of a New Uptrend?
🌍 Macro Overview – Gold’s Recent Movement and Market Sentiment
Gold recently experienced a strong bounce from the 3.282 USD/oz low, reaching up to 3.317 USD/oz. This move has sparked some optimism, but let’s take a look at the key macro factors that might be affecting gold:
📉 US bond yields have dropped, signaling that market risk aversion is starting to return
💵 The USD remains strong, but buying interest for gold in Asia is increasing, as confidence in fiat currencies begins to wane
🇪🇺 The EU is pushing ahead with negotiations with the US on tariffs before the August 1st deadline. If these talks break down, gold could benefit significantly
🏦 The Fed is maintaining interest rates, but the market is betting that cuts could come in September if inflation remains under control
📊 US unemployment data and the Fed’s speech tonight will be key, with the market waiting anxiously for clues on the Fed’s next move
📊 Technical Analysis – Gold Approaching Key Resistance Zones
Gold is trading within a descending channel, but signs of a breakout are emerging after a solid test of the bottom.
Key resistance levels are around 3330 – 3340, and these will be crucial in determining whether gold can continue its upward momentum.
Fair Value Gap (FVG) has appeared between 3310 – 3320, which suggests that if buying pressure remains, a breakout could be on the horizon.
🎯 Trading Strategy for Today – Focused on Clear Entry Points
🟢 BUY SCALP:
Entry: 3310 – 3308
SL: 3304
TP: 3314 → 3318 → 3322 → 3326 → 3330
🔵 BUY ZONE (safer entry points):
Entry: 3290 – 3288
SL: 3284
TP: 3294 → 3298 → 3302 → 3306 → 3310 → 3320 → 3330
🔴 SELL SCALP (if price hits resistance levels):
Entry: 3335 – 3337
SL: 3342
TP: 3330 → 3325 → 3320 → 3315 → 3310 → 3300
⚫ SELL ZONE (strong resistance at 3360-3362):
Entry: 3360 – 3362
SL: 3366
TP: 3356 → 3352 → 3348 → 3344 → 3340 → 3336 → 3330
📌 Note:
Always place SL and TP to protect your account, especially in a market that may experience significant volatility.
Monitor the volume from London and New York sessions for clearer market direction. A strong breakout above resistance could signal the start of a new uptrend.
💬 Gold has bounced strongly, but is this the start of a larger rally, or just a brief pullback? What do you think about today’s potential trend? Share your thoughts in the comments below!

Elliott Wave Analysis – XAUUSD July 10, 2025🌀 Elliott Wave Structure
On the H4 timeframe, price has returned to test the upper boundary of the converging triangle – currently acting as dynamic resistance. Based on the current wave count, wave e (purple) may have completed at the 3279 low, and price is potentially starting a breakout move.
👉 A confirmed breakout above the triangle would validate the end of the abcde correction and mark the beginning of a new upward trend.
🔋 Momentum Analysis
D1 timeframe: As forecasted yesterday, momentum is entering oversold territory and showing early signs of a reversal. This suggests that an upward trend could dominate over the next 5 days.
H4 timeframe: The two momentum lines are sticking together, indicating a weakening upward drive. A minor pullback may be needed before the next leg up. Key nearby resistance levels to watch are 3330 and 3342.
🎯 Key Price Levels & Validation Zones
The following support zones are crucial for identifying potential entries:
Support Zone 1: 3306 – 3308
Support Zone 2: 3294 – 3297
‼️ Important: A break below 3294 would invalidate the current wave structure, and a new count would be required.
📌 Trade Plan
Scenario 1 – Buy at higher support:
Buy Zone: 3308 – 3306
SL: 3303
TP1: 3342
TP2: 3366
TP3: 3390
Scenario 2 – Buy at deeper support (if stronger correction occurs):
Buy Zone: 3297 – 3294
SL: 3287
TP1: 3342
TP2: 3366
TP3: 3390
Scenario 3 – Safer option (breakout confirmation):
Wait for a breakout above the triangle, then enter on the retest (around 3325–3330)
SL: Based on structure formed during the retest
TP range: 3366 – 3390
📌 Preferred strategy: Wait for H4 to reach oversold or wait for a confirmed breakout and retest to enter safely in alignment with the new uptrend.

Gold Finds Support as Tariff Tensions RiseHello everyone! What’s your take on XAUUSD today?
OANDA:XAUUSD is showing a mild recovery, currently trading around $3,323, gaining over 100 pips on the day. Despite this bounce, the short-term structure still leans in favour of the bears.
On July 9th, President Biden announced a 50% tariff on copper and a projected 200% tariff on pharmaceuticals, following earlier notices of 25–40% tariffs imposed on 14 countries including Japan, South Korea, Thailand, Laos, and Malaysia.
This escalation has led to a sharp rise in international copper prices and reignited fears of global inflation, supply chain disruptions, and slower economic growth. As consumers cut back and companies face contract renegotiations, financial risk is spreading across global markets.
In this climate, investors are returning to gold as a safe haven, seeking capital protection in anticipation of broader market instability.
📈 Outlook: Gold prices may continue to rally in the short term if the U.S. unveils further tariff measures or reveals new negotiation drafts in the coming days.

Gold Update - July 10th, 2025Yesterday we have seen breakdown below Monday's low , but bulls again stepped in at the lower levels and pushed gold back above 3300 by the daily close. This was actually a really encouraging sign that buyers are still willing to defend this level.Things are looking a bit better now. Gold is trading above the weekly pivot, which is a positive shift from yesterday's weakness.
What's in the way:
The immediate challenge is that dynamic trendline you can see on the chart
Bulls need to break through this first ....
After that, the next big test is around 3340 this is a high volume area where we've seen plenty of action before.
old is basically stuck in a range between 3280-85 on the bottom and 3335-40 on the top. Right now, there's no clear direction.
We need a decisive break from this range. Until then, we're just watching price bounce between these levels without any real commitment from either buyers or sellers.
XAUUSD – Gold Maintains Bullish Momentum Amid Trade TensionsGold continues to respect its long-term ascending trendline that started in September 2024. After a corrective move from the $3,450 resistance zone, price has just retested the trendline near $3,060 and bounced strongly — a clear sign that buyers still control the bullish structure.
Fundamentally, gold is supported by two major factors:
The U.S.–14-nation trade conflict, with a tariff deadline set for August 1st, is fueling risk-off sentiment and driving safe-haven demand — pushing gold above $3,300.
The global de-dollarization trend and over $38 billion flowing into gold ETFs in H1 2025 are strengthening gold’s role as a USD alternative.
Looking ahead: If XAUUSD holds above the $3,060 support zone, it may head toward $3,211 and possibly $3,350. The bullish outlook remains intact as long as the trendline is respected.

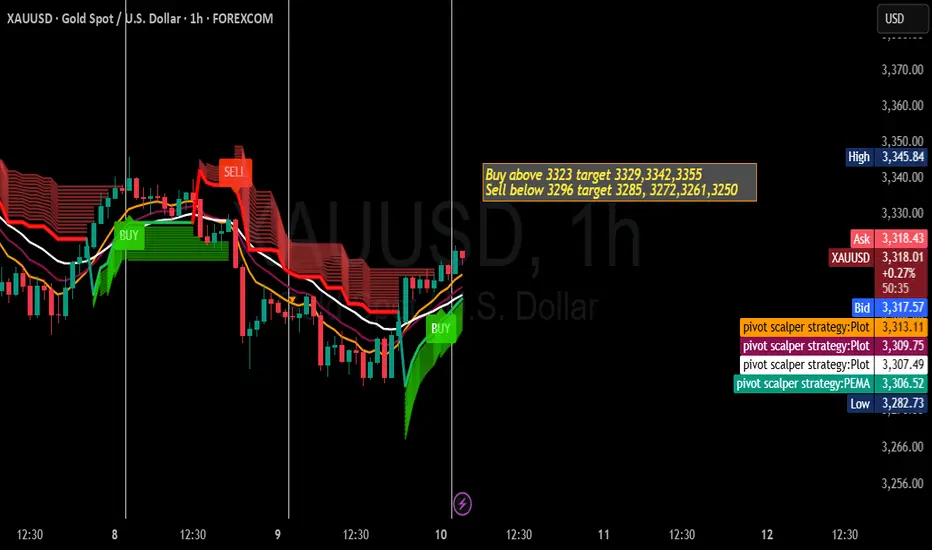
Gold Trading Strategy for 10th July 2025📈 Gold (XAU/USD) Trade Setup – Strategy Based on 1-Hour Candle Breakout
🔹 Buy Setup (Bullish Breakout Strategy)
Entry Condition: Buy above the high of a 1-hour candle only if it closes above $3,323.
Buy Trigger Level: $3,323+
Targets:
🎯 Target 1: $3,329
🎯 Target 2: $3,342
🎯 Target 3: $3,355
Stop Loss: Place a stop loss just below the breakout candle low or a recent support level (suggested: around $3,317 or as per your risk tolerance).
🔻 Sell Setup (Bearish Breakdown Strategy)
Entry Condition: Sell below the low of a 1-hour candle only if it closes below $3,296.
Sell Trigger Level: $3,296-
Targets:
🎯 Target 1: $3,285
🎯 Target 2: $3,272
🎯 Target 3: $3,261
🎯 Target 4: $3,250
Stop Loss: Place a stop loss just above the breakdown candle high or a recent resistance level (suggested: around $3,302 or per your risk tolerance).
⚠️ Important Disclaimer
This analysis is for informational and educational purposes only and should not be considered as financial advice. Trading in commodities like gold involves significant risk and may not be suitable for all investors. Always consult with your financial advisor and use proper risk management. Past performance is not indicative of future results.
Selling pressure, gold downtrendPlan XAU day: 09 July 2025
Related Information:!!!
Gold (XAU/USD) continues to extend its decline on Wednesday for a second consecutive session, as the US Dollar (USD) and US Treasury yields strengthen ahead of the release of the Federal Open Market Committee (FOMC) Meeting Minutes.
The US Dollar Index (DXY) has climbed to a two-week high, exerting downward pressure on XAU/USD, which has fallen below the $3,300 level at the time of writing.
The forthcoming release of the FOMC Minutes from the June meeting is anticipated to provide insight into the Federal Reserve’s internal discussions regarding the future course of monetary policy.
In June, the central bank chose to maintain its benchmark interest rate within the 4.25% to 4.50% range, citing continued labor market resilience and persistent inflationary pressures.
personal opinion:!!!
Gold price is in the accumulation zone below 3300, big selling pressure. Pay attention to selling gold according to the trend line 3294
Important price zone to consider : !!!
support zone point: 3274; 3252 zone
Sustainable trading to beat the market

Gold drops to $3,282 as bears take control below $3,300Gold Bulls lose grip as $3300 psychological handle fails to hold as support.
Strong selling pressure forces Gold to drop to $3282
Bounce back off the lows lacked conviction as relief rally loses steam at $3310
Any resumed rebound attempt faces strategic hurdle at $3307-$3310
Rejection from resistance calls for yet another retest of $3282-$3278-$3273 where buyers may show some interest if price action shows buyers signatures.
Bulls need to clear through immediate hurdle $3300 psychological zone followed by next important resistance $3307 and $3310 which stopped yesterday's rebound attempts. Strong break and Day/Week close above $3321 will further confirm return of bulls.
Markets will closely monitor upcoming FOMC meeting minutes for some clues on macro factors and potential measures, if any.

Is a Pullback Coming or Will the Bulls Continue?Gold Faces Resistance at 3300 – Is a Pullback Coming or Will the Bulls Continue?
Market Overview: USD Gains Pressure Gold as Trade Deals Unfold
Gold has been under pressure recently due to the strong recovery of the US dollar. Positive developments in global trade talks and agreements between major nations, including the US, have been a key driver for the USD, which in turn has weighed on gold.
US inflation data continues to show signs of easing, providing the Fed more room to hold off on rate hikes, strengthening the USD.
FOMC meeting minutes due this week will provide further insight into the Fed’s approach to interest rates.
With geopolitical tensions easing and trade deals stabilizing, the demand for safe-haven assets like gold is slightly reduced.
In the short-term, the market is testing crucial levels, and while gold remains bullish in the long run, the current market conditions suggest potential for a pullback before further upside.
Technical Analysis: Gold in a Range-Bound Market
Looking at the H1 timeframe, gold has formed a clear downward channel between 3360 and 3290, which could signal further corrective action if the price remains within this range. If gold fails to break above resistance at 3360, a dip to 3250 might occur, especially if the USD strength continues to put pressure on gold.
However, waiting for confirmation patterns before entering a trade is key. False breakouts can be a risk when price moves quickly through key levels without sustaining momentum.
Buy Bias in Short-Term with Caution on Bearish Moves
Given the current market structure, there is more room for buy opportunities than for selling at the moment. Watch out for a potential bounce back in the 3320-3325 region as gold might test these levels before continuing its rise. The rejection wick on yesterday's D1 candle shows that the sellers are losing control, and buying pressure is starting to build again.
In the M30 chart, there's a continuation pattern forming around the 16-14 zone, which could be an ideal place to enter a buy position if it holds.
Resistance and Support Levels:
Key Resistance Levels: 3302 – 3310 – 3324 – 3335 – 3361
Key Support Levels: 3275 – 3259 – 3248
Trading Strategy – Buy and Sell Zones
BUY ZONE:
3250 – 3248
Stop Loss: 3244
Take Profit: 3254 → 3258 → 3262 → 3266 → 3270 → 3280 → ????
SELL SCALP:
3303 – 3305
Stop Loss: 3310
Take Profit: 3298 → 3294 → 3290 → 3286 → 3280 → 3270 → 3260
SELL ZONE:
3334 – 3336
Stop Loss: 3340
Take Profit: 3330 → 3326 → 3320 → 3315 → 3310 → 3305 → 3300 → ????
Key Updates to Watch: FOMC and Trade Policy News
With FOMC minutes due and trade policy developments on the horizon, it’s crucial to stay alert for any shifts in market sentiment. Ensure you stick to TP/SL levels to protect your account from any unexpected volatility.

GOLD (XAU/USD) – SELL TRADE SETUP #3GOLD (XAU/USD) – SELL TRADE SETUP #3
🕒 Timeframe: 1H
📅 Date: July 9, 2025
📉 Trade Parameters:
Sell Entry Zone: 3,292 – 3,293 USD/oz
Stop Loss (SL): 3,301 USD
Take Profit (TP): 3,252 USD
📊 Technical Rationale:
Price is retracing into a short-term resistance zone around 3,292 – 3,293, aligning with a downtrend structure and minor descending trendline.
This zone also overlaps with moving average resistance, increasing confluence.
Volume on the retracement is weakening, indicating limited buying pressure.
If price fails to break above 3,301, a continuation to the downside toward 3,252 is likely.
Fl we here and X!

Gold at a Crossroads – Rebound or Breakdown?Gold just faced a sharp sell-off as optimism surged around a potential trade truce. After President Trump announced a 25% tariff on Japan and South Korea, the deadline was surprisingly pushed to August 1st, giving countries room to negotiate. That pause eased market fears and triggered a short-term risk-on sentiment.
But the real pressure came from a stronger US Dollar and 10-year Treasury yields hitting a two-week high – a deadly combo for gold, which offers no yield. The shift in capital flow toward safer, interest-bearing assets pushed gold further into the red.
Now, all eyes are on the upcoming Fed minutes and speeches from key officials this week. If the tone is hawkish, gold could lose further ground. But a dovish hint might spark a bounce from the $3,290 support zone.

Elliott Wave Analysis – XAUUSD July 9, 2025
🔻 Momentum Analysis
D1 timeframe: Momentum is approaching the oversold zone and may reverse upwards today or tomorrow.
H4 timeframe: Momentum is already in the oversold zone. The two momentum lines are converging, signaling weakening downward pressure and a potential reversal.
🌀 Elliott Wave Structure
The price level around 3318 (previous buy zone) failed to hold, despite a ~100-pip bounce before continuing to decline.
Currently, price is nearing the lower boundary of a contracting triangle – a typical abcde corrective pattern.
Based on the current wave structure:
Wave d (purple) appears to be complete.
Price is now likely forming wave e, expected to end near 3279, which coincides with the triangle’s bottom support.
If the pattern holds, a strong breakout above the upper triangle boundary is expected once wave e completes.
However, note: the formation of a triangle during a corrective wave often signals that the uptrend is nearing its end in the longer term.
📌 Trading Plan
Given the complex 3-wave structure typical of triangles, risk is elevated, so:
Trade with reduced position size, or
Preferably wait for a confirmed breakout above the triangle before entering.
Suggested Trade Setup:
✅ Buy Zone: 3280 – 3277
❌ Stop Loss: 3270
🎯 Take Profits:
TP1: 3309
TP2: 3342
TP3: 3390

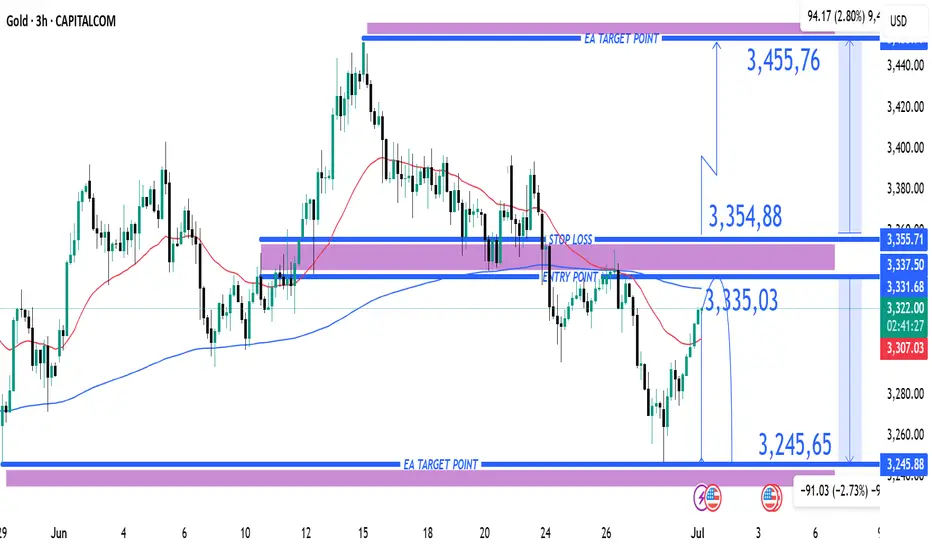
(XAU/USD) 3H Chart – Bearish Reversal Setup from Resistance Zone1. Entry Point (Sell):
Marked at 3,335.03
This is a key resistance level where price is expected to reverse downward.
2. Stop Loss:
Placed above at 3,354.88
This acts as a protection level in case the trade goes against the direction.
3. Take Profit Targets (EA Target Points):
TP1 (Downside): 3,245.65
TP2 (Upside - if Stop Loss is hit): 3,455.76 (in case of reversal or long position)
4. Price Action Observation:
Price is currently around 3,320.56, climbing back toward the entry zone.
The red 50-period moving average (EMA) and blue 200-period MA show convergence, often preceding volatility.
---
📉 Bearish Scenario (Main Setup)
Sell Bias is expected from the 3,335 region.
If price respects the resistance zone and breaks down again, the target is 3,245.65, yielding approximately 90-point move.
This is a risk-reward favorable setup, with:
Risk: ~20 points
Reward: ~90 points
RRR ≈ 1:4.5
---
⚠️ Bullish Invalidity (Stop Loss Hit)
If the price breaks and closes above 3,354.88, it invalidates the bearish setup.
Then, the market may shift towards targeting 3,455.76 — about 100 points to the upside.
---
🔧 Technical Factors Supporting the Setup
Supply zone marked by the purple box around the entry.
Trend previously bearish — recent upward move may just be a retracement.
Confluence with MAs: Price is testing MAs — rejection here would add bearish confirmation.
---
✅ Summary of Trade Setup
Element Value
Entry 3,335.03
Stop Loss 3,354.88
Take Profit 3,245.65
Alt Target 3,455.76 (if SL hit)
Risk-Reward ~1:4.5
Bias Bearish (Sell Setup)
7.9 Gold Analysis7.9 Gold Analysis
I. Market Overview
Gold price fell sharply: On July 8, spot gold plummeted by more than 1%, hitting a low of $3287.06/ounce (a new low in a week), and closed at $3301.53. The main reasons include trade optimism (tariff extension) weakening safe-haven demand, a stronger dollar and rising U.S. Treasury yields.
II. Analysis of core influencing factors
1. Trade policy and risk aversion
The Trump administration postponed the effective date of tariffs from July 9 to August 1, and imposed tariffs on 14 countries (up to 70%), but stated that negotiations with the EU and China were "progressing smoothly", and market expectations for easing trade frictions increased, weakening the safe-haven appeal of gold.
Japan and South Korea responded quickly to the negotiations, further boosting risk appetite.
2. Suppression of the U.S. dollar and U.S. Treasury yields
The U.S. dollar index surged to 97.83 (a one-week high), and non-U.S. currencies were under pressure (such as the yen depreciating due to the threat of tariffs on Japan).
The 10-year U.S. Treasury yield rose to 4.435% (a two-week high), increasing the holding cost of interest-free gold.
3. Inflation and Fed policy game
Tariff policies (such as a 50% tariff on copper) may push up inflation, which is good for inflation-resistant gold in the long run; but in the short term, it may delay the Fed's interest rate cuts and suppress gold prices.
Market expectations: A 50 basis point interest rate cut by the end of 2025 (starting in October), focusing on the signals released by the Fed's meeting minutes and officials' speeches.
3. Technical analysis
Daily level
Trend: After being blocked at the high of $3,365 on July 3, it has fluctuated downward, and the moving average system has turned downward to suppress it, which is weak in the short term.
4-hour level
It is in a downward channel, and the low of 3,287 has stabilized but no reversal signal has been formed. MACD crosses the zero axis, and RSI is below 50, and the short side is dominant.
4. Trading strategy suggestions
Short-term:
Short order: short at highs in the 3305-3315 range, stop loss at 3320, target at 3290.
Long order: try long with a light position in the 3290-3285 range, stop loss at 3280, target at 3300-3310.
Medium-long term:
Wait for opportunities to deploy in batches at 3275/3265/3255, long-term target at 3400+. (Trump criticized Powell for stepping down, implying that the Fed’s meeting minutes will not cut interest rates, and it is worth waiting patiently.)
5. Today’s focus events
US EIA crude oil inventory linked to energy market sentiment
Federal Reserve monetary policy meeting minutes, interest rate cut path signal (core focus)
Trading must be cautious and control risks! I wish you a smooth transaction!
