Fed Cuts & Geopolitical Risks Keep Gold Strong📊 Market Overview
Gold is holding firm above 3750 USD/oz, extending gains and refreshing daily highs in the European session. Expectations that the Federal Reserve will continue cutting rates this year are supporting bullish sentiment, while ongoing geopolitical tensions keep safe-haven demand elevated. For Indian traders, this combination of softer USD and global uncertainty keeps gold attractive both as a hedge and a short-term trading instrument.
🔎 Technical Analysis (H1/H4)
Price structure remains bullish while holding above 3750.
Buy Zones: 3742–3740 (main support) and 3757–3755 (scalp setup).
Resistance nearby at 3778, with extended upside potential towards 3813–3815 (liquidity sell zone).
A rejection at 3813–3815 could trigger a short-term pullback to demand levels.
🔑 Key Levels
Resistance: 3778 - 3813 - 3815
Support / Buy Zones: 3757 - 3755 - 3742 - 3740
📈 Scenarios & Trading Plan
✅ BUY ZONE (Main Setup): 3742–3740
SL: 3735
TP: 3748 - 3752 - 3756 - 3760 - 3770 - 3780 - …
✅ BUY SCALP (Quick Entry): 3757–3755
SL: 3750
TP: 3762 - 3766 - 3780 - …
✅ SELL ZONE (Liquidity Trap): 3813–3815
SL: 3820
TP: 3810 - 3805 - 3800 - 3795 - 3790 - 3780 - …
⚠️ Risk Management Notes
Watch out for false breakouts at 3813–3815 — liquidity sweeps are likely before reversals.
Focus on buying confirmed pullbacks rather than chasing price mid-range.
Keep trade size moderate — volatility can increase on Fed comments or geopolitical updates.
✅ Summary
Gold’s bullish trend remains intact, supported by Fed cut expectations and geopolitical risks. Trading plan: buy dips at 3757–3755 and 3742–3740, aiming for 3770–3780, while monitoring the 3813–3815 zone for short-term sell opportunities if rejection occurs.
📢 Follow MMFLOW TRADING on TradingView for intraday setups, liquidity-based strategies, and high-probability trade ideas tailored for global traders.
CFDGOLD trade ideas

Gold Soars: Will a Weak USD Open the Door for New Highs?Hello traders, it’s clear that gold is rising sharply, supported by the weakening of the USD. Can gold continue to conquer new highs?
On the chart, the price is moving within a clear upward channel. The key support level at 3,750,000 has been tested multiple times, and if the price holds above this level, gold could continue rising towards 3,827,000. The areas near recent highs also show an increase in trading volume, reinforcing the bullish trend.
Forecasts indicate that the U.S. labor market is slowing down, with 233K jobs created, slightly higher than the previous 231K. This weakens the USD, creating an opportunity for gold to continue its rise, as gold typically benefits from a weaker USD.
With strong technicals and a weakening USD, XAU/USD could continue its upward momentum. Get ready for some exciting opportunities!

Gold 1H – Should We Hold or Fade Liquidity at 3800?On the 1-hour timeframe, gold is trading near 3,776 within a corrective channel. Premium liquidity remains clustered above 3,800–3,798, while discount demand is positioned at 3,725–3,727. Recent BOS (Break of Structure) signals confirm bullish intent, but engineered sweeps into premium zones are still likely before price retraces toward discount levels.
Today’s headlines on the Federal Reserve’s cautious approach and ongoing geopolitical tensions in the Middle East are reinforcing safe-haven demand. However, intraday volatility may continue to produce liquidity grabs before clear direction is established.
________________________________________
📌 Key Structure & Liquidity Zones (1H)
• 🔴 SELL GOLD LIQUIDITY 3,800–3,798 (SL 3,807):
Premium resistance where liquidity sweeps may cause rejections towards 3,770 → 3,760 → 3,755.
• 🟢 BUY ZONE 3,725–3,727 (SL 3,720):
Discount demand in line with BOS, with upside targets at 3,740 → 3,760 → 3,775.
________________________________________
📊 Trading Ideas (Scenario-Based)
🔻 Sell Setup – Liquidity Run (3,800–3,798)
• Entry: 3,800–3,798
• Stop Loss: 3,807
• Take Profits:
o TP1: 3,770
o TP2: 3,760
o TP3: 3,755
🔺 Buy Setup – Discount Demand (3,725–3,727)
• Entry: 3,725–3,727
• Stop Loss: 3,720
• Take Profits:
o TP1: 3,740
o TP2: 3,760
o TP3: 3,775+
________________________________________
🔑 Strategy Note
With the Fed’s cautious stance and geopolitical risks supporting gold, the broader bias remains buy-the-dip. At the same time, fading engineered sweeps into premium liquidity zones can offer tactical short-term opportunities. Expect volatility around 3,800 liquidity runs before retracements into well-defined discount zones.

xau usd- LONGxauusd - 1h mss+golden zone +fvg=3800. smc -sell side liquidity sweep and buy side mss .waiting for pullback for long entry

LiamTrading – XAUUSD IN-DEPTH ANALYSIS OF CURRENT TRENDLiamTrading – XAUUSD Scenario Today: Opportunities at Key Price Levels
Gold continues its strong upward momentum, currently fluctuating around the 376x–377x range after a series of breakthroughs. The technical structure on the H1 chart shows the market is forming clear resistance and support zones, suitable for short-term trading plans.
Technical Analysis
RSI is cooling off from high levels, indicating the possibility of a short-term correction.
The upper price range around 3818–3821 is a strong confluence of resistance, coinciding with wave peaks and Fibonacci extensions, making it prone to selling reactions.
Conversely, the support zones at 373x and 370x exhibit dense liquidity, serving as potential buying points when prices adjust.
The short-term Dow structure still leans towards an uptrend, but attention is needed for the sell confirmation zone if gold fails at the peak.
Reference Trading Plan
Sell Zone: 3818 – 3821, SL 3828, TP 3805 – 3785 – 3760 – 3732 – 3650
Buy Scalping: 3728 – 3731, SL 3723, TP 3750 – 3777 – 3790
Buy Zone: 3706 – 3709, SL 3700, TP 3725 – 3738 – 3750 – 3777 – 3790
In summary, the main trend still leans towards an increase, but with gold approaching strong resistance zones, the likelihood of a correction is very high. Traders need to patiently wait for reactions at the marked zones for optimal entries, while managing risk tightly.
This is my personal view on XAUUSD. If you're interested in gold scenarios, follow me for the fastest updates.

Gold hits record 3,759 | Safe-haven flows surge back🟡 XAU/USD – 23/09 | Captain Vincent ⚓
🔎 Captain’s Log – Context & News
Today Gold surged nearly +2% , hitting a record $3,759/oz .
Geopolitical tensions : Israel launched missiles into Lebanon, killing 5 (including 4 US citizens) → safe-haven demand rushed back into Gold.
USD weakened , capital flowed out of stocks & bonds → strong support for precious metals.
ETFs & speculators : heavy buying amplified the rally.
Silver : jumped to its highest level in 14 years, reinforcing strength in the precious metals sector.
⏩ Captain’s Summary : Gold is fueled by geopolitics, macro factors, and safe-haven demand. But after a hot rally, the big question: continue breaking highs or face sharp swings if the FED shifts tone?
📈 Captain’s Chart – Technical Analysis (H45)
Storm Breaker (Resistance / Sell Zone)
3,771 – 3,787 (Fibo 0.5–0.618 confluence, ATH test zone)
Golden Harbor (Support / Buy Zone)
Near support: 3,740 (previous high turned support)
OB Dock: 3,717 – 3,723
Breakout Harbor: 3,689 – 3,691
Market Structure
Gold broke out to Higher High around 3,755 – 3,759.
Main trend remains bullish, but prone to volatility / pullback after a hot rally.
🎯 Captain’s Map – Trade Plan
✅ Buy (trend-follow priority)
Buy Zone 1 (OB)
Entry: 3,717 – 3,723
SL: 3,707
TP: 3,725 – 3,730 – 3,735 – 3,740 – 3,750
Buy Zone 2 (Breakout Retest)
Entry: 3,689 – 3,691
SL: 3,678
TP: 3,699 – 3,710 – 3,7xx
⚡ Sell (short-term scalp if overbought)
Sell Zone (ATH test)
Entry: 3,783 – 3,785
SL: 3,795
TP: 3,759 – 3,740 – 3,717
⚓ Captain’s Note
“The geopolitical storm pushed the Golden sails past 3,759. Golden Harbor 🏝️ (3,717 – 3,689) is the safe dock for sailors to board the northbound trend. Storm Breaker 🌊 (3,771 – 3,787) may raise heavy waves, suitable for short Quick Boarding 🚤 scalps. The main voyage remains bullish, but after a hot rally, sailors must keep a firm hand on the helm to avoid being thrown off by choppy swings.”

Elliott Wave Analysis XAUUSD – September 24, 2025📊
________________________________________
🔹 Momentum
D1
• Daily momentum is currently rising.
• So far, we have counted 4 bullish candles, which is the minimum requirement to complete a momentum cycle.
• There may be 1–2 more daily candles before momentum enters the overbought zone and reverses.
H4
• H4 momentum is in the oversold zone and about to reverse.
• The upcoming H4 bullish swing is critical:
o If it breaks the previous high → the uptrend continues, and we can expect another 1–2 daily bullish candles before reversal.
o If it fails to break the high → we must prepare for a reversal scenario.
H1
• H1 momentum is also heading into the oversold zone.
• This creates a confluence between H4 and H1, signaling a possible bullish move ahead.
________________________________________
🔹 Wave Structure
D1
• The yellow wave ⑤ has reached its first target at 3789.
• This is a strong resistance zone because:
o It aligns with the 0.382 Fibo retracement of waves ①–③ yellow.
o Wave ⑤ equals the length of wave ① yellow.
• If D1 momentum enters the overbought zone and price fails to break 3789, this may mark the top of wave ⑤ yellow, potentially triggering a sharp and prolonged decline.
H4
• Price has already seen a 5-candle decline on H4, with momentum in the oversold zone → this correction is near completion.
• Two possibilities:
1. It is wave ④ of wave ⑤ yellow.
2. It is the start of wave ① of a new bearish structure.
• If the next bullish move fails to break the previous high, the bearish wave ① scenario is confirmed, leading to a wave ③ decline with strong and steep characteristics.
H1
• A deeper and longer correction than previous ones has appeared, which is unusual, especially since price already reached the first target of wave ⑤ yellow.
• However, we should not rush to catch the top, as this unusual behavior is only visible on H1, while H4 and D1 still look normal.
• If this is wave ④, or wave ① of a bearish structure, or even just wave A → the next move should still bring a bullish swing confluence, providing an opportunity to look for Buy entries.
________________________________________
🔹 Key Support Zones
• 3747 – 3737
• 3729
________________________________________
🔹 Trading Plan
Scenario 1:
• Buy Zone: 3747 – 3744
• SL: 3735
• TP: 3774
Scenario 2:
• Buy Zone: 3730 – 3727
• SL: 3720
• TP: 3767

XAUUSDGold short at 3671 and keep SL at 3685 to 3688 as personal comfort, 🎯 target is 3630
Sort term bearish view only

Gold Trading Strategy | September 23-24✅ 4H Chart Analysis: Gold has been trending upward since stabilizing around 3613, reaching as high as 3791, where it encountered resistance and pulled back into consolidation at high levels. The overall trend remains bullish, but there is short-term correction pressure. The moving averages are still in a bullish alignment, with the MA20 rising and providing support below. Gold is currently in a strong upward trend but consolidating at the highs; if it fails to break through 3791–3810, there is a risk of a short-term pullback. Key supports to watch are 3760 and 3726.
✅ 1H Chart Analysis: On the 1-hour chart, gold pulled back quickly after meeting resistance at 3791 and is now fluctuating between 3770–3780, entering short-term consolidation. The short-term moving averages have turned down, with price hovering around the MA10. If gold cannot quickly reclaim 3790, further downside consolidation may follow.
🔴 Resistance Levels: 3790–3795 / 3800–3810
🟢 Support Levels: 3765–3760 / 3738–3726
✅ Trading Strategy Reference:
🔰 Long Setup (Buy on pullback, trend-following)
● Entry Zone: 3760–3765
● Stop Loss: Below 3750
● Take Profit Target: 3790–3810
🔰 Short Setup (Sell on resistance)
● Entry Zone: 3790–3795
● Stop Loss: Above 3805
● Take Profit Target: 3765–3738
🔥Trading Reminder: Trading strategies are time-sensitive, and market conditions can change rapidly. Please adjust your trading plan based on real-time market conditions.

Gold Neowave Forecast
Update Type- Intraday
Yesterday wave-((iii)) Completed at the top, currently we are in wave ((iv))
after blue (a)(b)(c), market will continue the previous buy cycle for wave-((v))..
we will see after the structure we should buy or not
Learn More about trend here

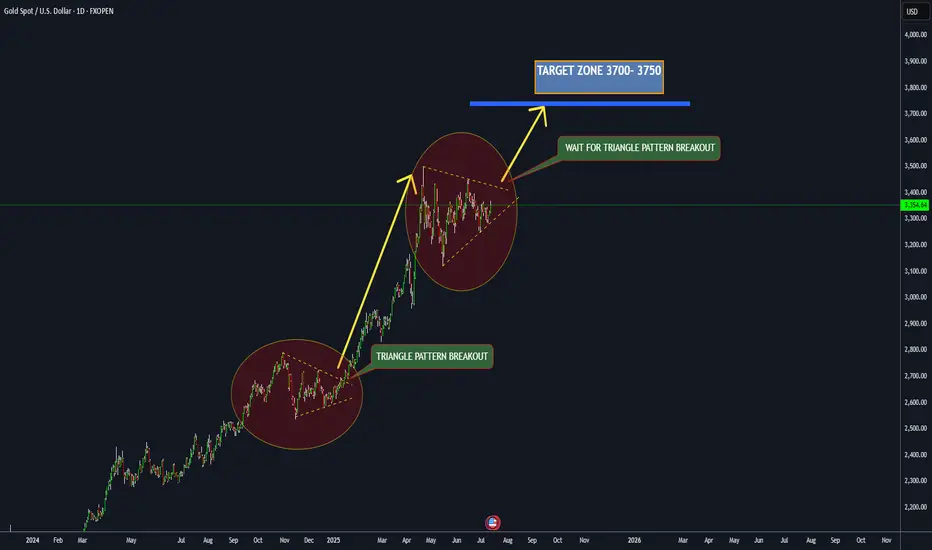
Gold .....Triangle pattern in the making ?Do you see what i see ?
Marked on the above chart are two triangular patterns which are identical in nature, one already formed and one in the making . if we break the sloping trend line on the upside, the targets mentioned is possible. stoploss for the trade will be the swing low of the structure which breaks the upper trend line. Plan your trade and then trade the plan.
This is just my view. Trade according to your risk management or consult your financial consultant before taking the trade.
Gold Prices Continue to Rise Amid Rate Cuts and Geopolitical RisGold prices today are being strongly supported by growing expectations that the Federal Reserve (FED) will continue to cut interest rates and the increasing demand for safe-haven assets amid rising geopolitical instability.
Last week, the FED made its first rate cut of 0.25% since December, causing gold prices to surge. While some investors took profits, most experts believe the uptrend is not over yet.
This week, investor focus will be on the U.S. Personal Consumption Expenditures (PCE) data for August, the FED's preferred inflation measure, which may provide further clues about future rate cuts. Many forecasts predict a slowdown in core PCE, reinforcing the case for continued rate cuts by the FED.
Additionally, safe-haven flows are further supported by prolonged geopolitical risks, including the Russia-Ukraine conflict and concerns over economic impacts from U.S. tariffs.
Furthermore, strong gold buying activity from global central banks plays a crucial role in strengthening the bullish outlook for the precious metal.

How to Control Trading Risk Factors1. Understanding Trading Risk
Before controlling trading risk, you must understand what “risk” means in trading.
1.1 Definition of Trading Risk
Trading risk refers to the potential for financial loss resulting from trading activities. It arises due to various internal and external factors, including market volatility, economic changes, human errors, and systemic uncertainties.
1.2 Types of Trading Risks
Trading risks can be broadly categorized as follows:
Market Risk: Losses due to price movements in stocks, commodities, forex, or derivatives.
Liquidity Risk: The inability to buy or sell assets at desired prices due to insufficient market liquidity.
Credit Risk: The risk that counterparties in trades fail to meet obligations.
Operational Risk: Risks arising from human errors, technology failures, or process inefficiencies.
Systemic Risk: Risks related to the overall financial system, such as economic crises or political instability.
Understanding these risks allows traders to create a comprehensive strategy for mitigation.
2. The Psychology of Risk
2.1 Emotional Discipline
Trading is as much psychological as it is technical. Emotional decisions often lead to risk exposure:
Fear: Selling too early and missing profit opportunities.
Greed: Over-leveraging positions and ignoring risk limits.
Overconfidence: Ignoring stop-loss rules or trading based on intuition alone.
2.2 Behavioral Biases
Behavioral biases amplify trading risk:
Confirmation Bias: Seeking information that confirms existing beliefs.
Loss Aversion: Avoiding small losses but risking larger ones.
Recency Bias: Overweighting recent market trends over long-term data.
Controlling these psychological factors is critical to managing risk effectively.
3. Risk Assessment and Measurement
3.1 Position Sizing
Determining how much capital to allocate to a trade is crucial:
Use the 1–2% rule, limiting potential loss per trade to a small fraction of total capital.
Adjust position size based on volatility—larger positions in stable markets, smaller positions in volatile markets.
3.2 Risk-Reward Ratio
Every trade should have a clear risk-reward profile:
A risk-reward ratio of 1:2 or 1:3 ensures potential profit outweighs potential loss.
For example, risking $100 to gain $300 aligns with disciplined risk control.
3.3 Value at Risk (VaR)
VaR calculates potential loss in a portfolio under normal market conditions:
Traders use historical data and statistical models to estimate daily, weekly, or monthly potential losses.
VaR helps in understanding extreme loss scenarios.
4. Risk Mitigation Strategies
4.1 Stop-Loss Orders
Stop-loss orders are essential tools:
Fixed Stop-Loss: Predefined price point to exit the trade.
Trailing Stop-Loss: Moves with favorable price movement, protecting profits while limiting downside.
4.2 Hedging Techniques
Hedging reduces exposure to adverse market moves:
Use options or futures contracts to protect underlying positions.
Example: Buying put options on a stock to limit downside while holding the stock long.
4.3 Diversification
Diversification spreads risk across multiple assets:
Avoid concentrating all capital in one asset or sector.
Combine stocks, commodities, forex, and derivatives to balance risk and reward.
4.4 Leverage Management
Leverage magnifies both gains and losses:
Use leverage cautiously, especially in volatile markets.
Understand margin requirements and potential for margin calls.
5. Market Analysis for Risk Control
5.1 Technical Analysis
Identify trends, support/resistance levels, and patterns to anticipate market moves.
Use indicators like RSI, MACD, Bollinger Bands to time entries and exits.
5.2 Fundamental Analysis
Evaluate economic indicators, corporate earnings, and geopolitical factors.
Understanding macroeconomic factors reduces exposure to unforeseen market shocks.
5.3 Volatility Monitoring
Higher volatility increases risk; adjust trade size accordingly.
Use VIX (Volatility Index) or ATR (Average True Range) to measure market risk.
6. Trade Management
6.1 Pre-Trade Planning
Define entry and exit points before executing trades.
Calculate maximum acceptable loss for each trade.
6.2 Monitoring and Adjusting
Continuously monitor positions and market conditions.
Adjust stop-loss and take-profit levels dynamically based on market behavior.
6.3 Post-Trade Analysis
Review each trade to identify mistakes and improve strategy.
Track metrics like win rate, average profit/loss, and drawdowns.
7. Risk Control in Different Markets
7.1 Stock Market
Diversify across sectors and market capitalizations.
Monitor earnings releases and economic indicators.
7.2 Forex Market
Account for geopolitical risks, interest rate changes, and currency correlations.
Avoid excessive leverage; use proper position sizing.
7.3 Commodity Market
Hedge with futures and options to mitigate price swings.
Consider global supply-demand factors and seasonal trends.
7.4 Derivatives Market
Derivatives can be highly leveraged, increasing potential risk.
Use proper hedging strategies, clear stop-loss rules, and strict position limits.
8. Risk Management Tools and Technology
8.1 Automated Trading Systems
Algorithmic trading can reduce human emotional error.
Programs can enforce stop-loss, trailing stops, and position sizing automatically.
8.2 Risk Analytics Software
Platforms provide real-time risk metrics, VaR analysis, and scenario simulations.
Enables proactive decision-making.
8.3 Alerts and Notifications
Real-time alerts for price levels, volatility spikes, or margin requirements help mitigate sudden risk exposure.
9. Capital Preservation as the Core Principle
The fundamental rule of trading risk control is capital preservation:
Avoid catastrophic losses that wipe out a trading account.
Profitable trading strategies fail if risk is not controlled.
Focus on long-term survival in the market rather than short-term profits.
10. Professional Risk Management Practices
10.1 Risk Policies
Institutional traders operate under strict risk guidelines.
Examples: Daily loss limits, maximum leverage caps, and mandatory diversification.
10.2 Stress Testing
Simulate extreme market conditions to assess portfolio resilience.
Helps prepare for black swan events.
10.3 Continuous Education
Markets evolve constantly; traders must learn new techniques, understand new instruments, and adapt to regulatory changes.
11. Common Mistakes in Risk Management
Overleveraging positions.
Ignoring stop-loss rules due to emotional bias.
Failing to diversify.
Trading without a risk-reward analysis.
Reacting impulsively to market noise.
Avoiding these mistakes is essential for long-term trading success.
12. Conclusion
Controlling trading risk factors requires a blend of discipline, knowledge, planning, and continuous monitoring. Traders must combine:
Psychological control to avoid emotional decision-making.
Analytical tools for precise risk measurement.
Strategic techniques like diversification, hedging, and stop-loss orders.
Capital preservation mindset as the foundation of sustainable trading.
Successful risk management does not eliminate losses entirely but ensures losses are controlled, manageable, and do not threaten overall trading objectives. By adopting a systematic and disciplined approach to risk, traders can navigate volatile markets confidently, optimize returns, and achieve long-term financial success.
Daily Trading Plan: Liquidity Zones & Bullish Outlook📊 Market Context
Gold is holding strong after its breakout, trading near 3760 USD/oz as safe-haven demand stays elevated. The combination of geopolitical tensions, global fund flows into ETFs, and a weaker USD continues to support the bullish bias. For Indian traders, gold’s rally is closely watched as both an investment hedge and a short-term trading opportunity. While the broader structure remains bullish, price may first sweep liquidity in key zones before pushing towards higher levels.
🔎 Technical Analysis (H1/H4/2H)
Price recently tested 3760, confirming bullish momentum.
Immediate support: 3725, marked as a CP retest zone.
Stronger support: 3689–3690, overlapping with OBS + FVG demand zone.
Resistance targets: 3788 (short-term liquidity pool) and 3805–3830 (major liquidity area).
Overall structure: Still bullish, but likely to retest demand zones before the next leg higher.
🔑 Key Levels
Resistance / Sell Zones: 3760 ➡️ 3788 ➡️ 3805–3830
Support / Buy Zones: 3725 ➡️ 3689–3690
📈 Scenarios & Trading Plan
✅ BUY ZONE 1 (Shallow Pullback): 3725
SL: 3716
TP: 3760 ➡️ 3788 ➡️ 3805 …
✅ BUY ZONE 2 (Deeper Liquidity Retest): 3689–3690
SL: 3680
TP: 3725 ➡️ 3760 ➡️ 3788 ➡️ 3830 …
✅ SELL SCALP (Liquidity Trap Setup): Around 3788–3805, if rejection patterns confirm
SL: 3810
TP: 3775 ➡️ 3760 ➡️ 3740 …
⚠️ Risk Management Notes
Watch out for false breakouts above 3788 or below 3725 – liquidity sweeps are common.
Enter trades only after confirmation; avoid chasing price in the middle of the range.
Keep risk per trade controlled, as Fed speeches and geopolitical headlines could spark volatility.
✅ Summary
Gold remains in a strong uptrend, with 3788–3805 as the next upside magnet. The plan is to buy dips at 3725 or 3689–3690, while keeping an eye on potential short-term sell setups near 3788–3805. The bias stays bullish, but risk management is key.
📢 Follow MMFLOW TRADING for intraday updates, liquidity-based setups, and strategies tailored for global gold traders.

all commodities closing predictions As per chart patterns and technical indicators, there is a possibility that gold will close lower today compared to the previous closing.
As per chart patterns and technical indicators, there is a possibility that silver will close lower today compared to the previous closing.
As per chart patterns and technical indicators, there is a possibility that natural gas will close lower today compared to the previous closing.
As per chart patterns and technical indicators, there is a possibility that crude oil will close higher today compared to the previous closing
STEVEN XAUUSD – Buy Scenario Aligned with the TrendTechnical Analysis
Gold continues its strong upward trend after breaking out from the previous accumulation zone. Currently, the price has tested the 3,742–3,744 range and is showing signs of pausing for a short-term correction.
The EMA200 H1 (3,662) remains upward sloping, confirming that the main uptrend is intact.
Fibonacci Retracement for the latest upward move:
The 0.786 level (3,738) coincides with the Volume Profile area – this is the first support for the short-term buy scenario.
The 0.618 level (3,707) coincides with the old resistance now turned support – a strong confluence, suitable for finding the main Buy point.
The RSI (14) is around 63–65, not yet in the overbought zone, indicating there is still room for an increase.
Trading Scenario
Buy aligned with the trend
Entry 1: 3,738–3,740
SL: 3,730
TP: 3,750 – 3,760
Entry 2: 3,707–3,710
SL: 3,695
TP: 3,738 – 3,760 – 3,780
Price Levels to Watch
3,742–3,744: short-term resistance, may cause adjustments.
3,738–3,740: nearby support, suitable for quick Buy.
3,707–3,710: strong support, important Buy zone.
3,780–3,785: extended resistance, target of the upward trend.
This is a reference scenario, not an investment recommendation. Stay tuned for earlier analyses and scenarios in upcoming sessions.

Elliott Wave Analysis XAUUSD – September 23, 2025
Momentum
• D1: Momentum is in an uptrend, currently on the 3rd bullish candle of the cycle. This suggests we may see at least 2 more bullish daily candles from now.
• H4: Momentum has turned bearish, indicating the possibility of a corrective decline within today’s H4 structure.
• H1: Momentum has already turned bearish and is approaching oversold territory. This shows the current decline is weakening, and a short-term rebound is likely. However, if momentum turns back up and enters the overbought zone but fails to break the previous high, another bearish leg may follow.
________________________________________
Wave Structure
• D1: After completing wave 4 (yellow), price broke the previous high, confirming the continuation of the uptrend. Wave 5 (yellow) targets are projected at 3789.019 and 3887.117.
• H4: Wave 3 (yellow) has completed, followed by a corrective structure in a flat WXY pattern. Currently, price is rising steeply, suggesting wave 5 (yellow) is underway. With H4 momentum turning bearish, this pullback could correspond to wave 4 within the ongoing wave 5 (yellow).
• H1: Wave 3 (black) has formed with a complete 5-wave sequence (blue). Price is now in wave 4 (black), which could develop as a Zigzag, Flat, or Triangle correction.
Wave 4 (black) target zones:
1. 3729.447
2. 3709.732
3. 3696.422
Once H4 momentum turns bullish from the oversold region, the nearest level among these zones is the most likely end of wave 4.
________________________________________
Trading Plan
Buy limit strategy at support zones:
• Buy Zone 1: 3730 – 3727
o SL: 3719
o TP: 3760
• Buy Zone 2: 3710 – 3707
o SL: 3696
o TP: 3729
If price extends lower, additional buy opportunities can be considered around 3696 or deeper levels marked on the chart.
________________________________________
👉 The primary trend remains bullish, with wave 5 (yellow) in progress. The plan is to wait for wave 4 (black) to complete and then enter Buy positions in alignment with the larger uptrend.

XAUUSD – Wolfe Waves forming on H4 chart, clear correction signaHello Trader,
On the H4 chart, gold is forming a quite standard Wolfe Waves pattern. The 5th wave has completed, and the price is moving into the crucial resistance zone of 3760 – 3770, which is also a potential Sell Zone. Given the current structure, the preferred scenario is a short-term downward correction before the main trend resumes.
Technical Analysis
The price has touched the 2.618 Fibonacci Extension and reacted with a decline, indicating profit-taking pressure.
The MACD still shows the previous buying force was quite strong, but the histogram is starting to weaken, aligning with the possibility of a correction wave emerging.
Area 3760 – 3770: a critical resistance zone, also coinciding with the 5th wave line of Wolfe Waves.
Trading Scenario
Sell order according to Wolfe Waves
Entry: 3760 – 3770
SL: 3782 (above resistance zone)
TP: 3710 -3660 -3610 – 3620 (key level Wolfe target)
Sell when price confirms below trendline
Entry 3727-3730
sl 3735
tp 3715-3700-3686-3665
Short-term Buy Scalping
Entry: 3705 – 3708
SL: 3700
TP: 3720-3730 – 3745- 3766
Note: This is just a short-term retracement strategy, going against the correction, so risk management is crucial.
Conclusion
Short-term: Prioritise observing reversal signals at 3760 – 3770 to Sell.
Medium-term: Wait for Buy opportunities around 3564 – 3574 to align with the main trend.
The market is entering a distribution and correction phase, so patiently waiting for candle confirmations at key zones will be key to optimising entry.
This is the Wolfe Waves scenario I propose for gold during this period. You can refer to and adjust according to your own strategy.
Follow me for the fastest updates when the price structure changes.

GoldGuys our trade on gold long is still running in very good profit but we can still add some more qty at the price of 3740 with strict SL of 3728 and target same as described before 3780

Gold 1H – Fed Signals & Geopolitics Keep Bulls on the MoveGold on the 1H timeframe is trading around 3,705–3,710 after a strong breakout, staying within a rising channel. Liquidity is concentrated above at the premium resistance zone near 3,716–3,718, while demand is positioned lower at 3,687–3,689 and deeper at the FVG zone 3,654–3,656. Recent dovish signals from the Fed following last week’s rate cut, coupled with rising geopolitical tensions, continue to bolster safe-haven demand. However, upcoming U.S. inflation data and Fed speakers could trigger engineered moves into premium supply before retracements into discount demand zones.
________________________________________
📌 Key Structure & Liquidity Zones (1H):
• 🔴 SELL ZONE 3,718–3,716 (SL 3,725): Premium resistance where liquidity sweeps may cause short-term rejections targeting 3,710 → 3,700 → 3,690.
• 🟢 BUY ZONE 3,687–3,689 (SL 3,680): Near-term demand zone aligned with channel structure, offering a pullback entry targeting 3,695 → 3,700 → 3,715+.
• 🟢 FVG BUY ZONE 3,654–3,656 (SL 3,647): Deeper discount support, attractive for longer setups targeting 3,670 → 3,685 → 3,700+.
________________________________________
📊 Trading Ideas (Scenario-Based):
🔺 Buy Setup – Pullback to Demand (3,687–3,689)
• Entry: 3,687–3,689
• Stop Loss: 3,680
• Take Profits:
TP1: 3,695
TP2: 3,700
TP3: 3,715+.
🔺 Buy Setup – FVG Sweep (3,654–3,656)
• Entry: 3,654–3,656
• Stop Loss: 3,647
• Take Profits:
TP1: 3,670
TP2: 3,685
TP3: 3,700+
🔻 Sell Setup – Premium Liquidity Run (3,716–3,718)
• Entry: 3,718–3,716
• Stop Loss: 3,725
• Take Profits:
TP1: 3,710
TP2: 3,700
TP3: 3,690.
________________________________________
🔑 Strategy Note
The Fed’s dovish stance and safe-haven flows from geopolitical risks are sustaining bullish momentum, but intraday structure suggests smart money may first engineer stop-runs into premium resistance before retracing toward demand. Maintain buy-the-dip bias at defined support zones, while cautiously fading liquidity sweeps near 3,716–3,718. Volatility could increase as markets await fresh U.S. inflation data and Fed policy remarks.

XAUUSD – Gold Trading Plan: Fresh Record Highs & Fibo Zone React📊 Market Context
Gold regained strong bullish momentum on Monday, surging to a new record high above 3,720 USD/oz. The Fed’s dovish outlook, signaling the possibility of two additional rate cuts this year, continues to support non-yielding assets like gold. At the same time, geopolitical risks remain a tailwind for safe-haven demand.
🔢 Technical Analysis (H2)
Immediate Resistance / SELL Zones:
3,818.769 – Key reaction zone where sellers may defend aggressively.
3,754.890 – Secondary SELL zone reaction area for short-term pullbacks.
Mid-Level Support / BUY Zone:
3,694.521 – First key area to watch for dips and potential buy reactions.
3,660.130 – Stronger support level if price pulls back deeper.
Major BUY Zone Reaction:
3,583.663 – Critical confluence of structure and Fibonacci support, a potential bounce zone if a major correction unfolds.
📈 Suggested Trading Scenarios
1️⃣ Bullish Continuation Setup
BUY: Look for pullbacks to 3,694–3,660 with bullish candlestick confirmation.
Targets: 3,754 → 3,818, leave partial position open if momentum breaks higher.
Stop Loss: Below 3,645 for safer positioning.
2️⃣ Countertrend SELL Setup
SELL: Enter short at 3,754–3,818 zones only with strong rejection signals.
Targets: 3,694 → 3,660, trail stops aggressively to lock profits.
3️⃣ Deep Correction Opportunity
BUY: If price flushes to 3,583–3,585, consider scaling into longs.
Targets: 3,660 → 3,754, aligning with the broader uptrend.
⚠ Key Trading Notes
Expect increased volatility with Fed guidance and ongoing geopolitical risks.
Use smaller position sizes near resistance zones and employ stop-loss discipline.
Avoid mid-range entries; focus on well-defined zones for optimal risk-to-reward setups.
💬 Community Discussion
📊 Will gold sustain its rally toward 3,818 or see a deep pullback before another leg higher? Share your charts and insights below so we can compare strategies!

Gold's Rally Continues: Why a Fed Cut Isn't Slowing It DownHello, traders!
Gold started the new week on an impressive note, trading at $3,685 in early Monday's session. The main drivers are the market's continued reaction to the Fed's recent rate cut and escalating geopolitical events. So, the big question is, how far will this rally go?
Fundamental Analysis: Why Is Gold Still Soaring?
Although the Fed cut interest rates by 0.25%—the first time in 2025—Chair Jerome Powell maintained a cautious stance, calling it a "risk management cut." While this initially caused some market jitters, in the long run, lower interest rates are a strong supporting factor for gold.
Lower Rates: They reduce the opportunity cost of holding gold, which is a non-yielding asset.
Geopolitical Tensions: Conflicts in Ukraine and the Middle East are escalating, boosting safe-haven demand. Ukrainian President Zelenskyy reported that Russia carried out a major drone and missile attack, reaffirming gold's role as a protective asset against global risks.
Technical Analysis: Breaking Resistance, The Uptrend Continues
Gold had a powerful rally at the start of the week, successfully breaking the key resistance zone at $370x. The price is currently hovering around $3720 with a slight correction, but the uptrend remains firmly intact.
Outlook: Given the strong upward momentum, short-selling (going short) with a tight stop-loss is extremely risky. We will continue to prioritize long positions (going long) as long as gold holds above the $370x level.
Suggested Trading Strategy (Strict Risk Management):
BUY SCALP
Zone: $3413 - $3711
SL: $3407
TP: $3716 - $3721 - $3726 - $3731 - $3741
BUY ZONE
Zone: $3700 - $3798
SL: $3790
TP: $3708 - $3718 - $3728 - $3738 - $3758
SELL ZONE
Zone: $3734 - $3736
SL: $3744
TP: $3726 - $3716 - $3706 - $3796 - $3779
The market is showing unpredictable volatility. Can gold overcome all barriers and set new records? Share your opinion in the comments below! 👇
#Gold #XAUUSD #Fed #GoldAnalysis #TradingView #FinancialMarkets #TechnicalAnalysis #GoldTrading #USD #Geopolitics
Gold (XAUUSD) Technical Analysis – September 22, 2025Gold (XAUUSD) technical analysis: Strong buy signal at $3,706. Support levels, resistance targets, stop loss strategy. September 2025 trading guide.
