FED shaken by politics | Gold eyes new ATH🟡 XAU/USD – 16/09 | Captain Vincent ⚓
🔎 Captain’s Log – News Context
FED & US Politics :
S. Miran elected to the FED Board but still serves as Trump’s economic advisor → concerns FED may face White House influence.
Michelle Mills elected with a narrow 48–47 margin.
Appeals Court blocked Trump from firing L. Cook, affirming FED’s independence, but raising the risk of a legal battle at the Supreme Court.
US Economy :
6:30 AM (US time): Retail Sales release – key consumer spending indicator.
Probability of a -50bps FED cut this week is down to 1.2% , nearly ruled out. FED is almost certain to deliver -25bps next week.
⏩ Captain’s Summary : Politics create noise, but the macro backdrop (FED easing + weak US data) remains the tailwind supporting Gold’s journey toward new ATH.
📈 Captain’s Chart – Technical Analysis
Storm Breaker (Resistance / Sell Zone) :
3706 – 3714 (Fibonacci resistance)
3722 – 3724 (Strong Sell Zone, potential ATH test)
Golden Harbor (Support / Buy Zone) :
FVG Dock: 3666 – 3668
OB Harbor: 3643 – 3645
Strong Low: 3611 (deep support)
Market Structure :
After a series of BoS , Gold broke out of sideways EqH/EqL and surged.
Preferred scenario: retrace to FVG 3666 , then bounce toward 3714 – 3722.
If 3722 breaks successfully → confirms new ATH and extends bullish momentum.
🎯 Captain’s Map – Trade Plan
✅ Buy (priority)
Buy 1 (FVG)
Entry: 3666 – 3668
SL: 3657
TP: 3690 – 3706 – 3714 – 372x
Buy 2 (OB)
Entry: 3643 – 3645
SL: 3632
TP: 3666 – 3700 – 3714 – 372x
⚡ Sell (short scalp at resistance)
Sell Zone
Entry: 3722 – 3724
SL: 3732
TP: 3714 – 3706 – 3690
⚓ Captain’s Note
“The Golden ship has broken free from sideways waters and is heading toward new peaks. Golden Harbor 🏝️ (3666 – 3643) is the safe dock for sailors to gather strength before sailing further. Storm Breaker 🌊 (3722 – 3724) is the big wave, suitable only for short Quick Boarding 🚤 . With dovish winds from the FED, the Golden sails are set toward new ATH.”
CFDGOLD trade ideas

Wednesday's gold price target: 3750Wednesday's gold price target: 3750
As shown in Figure 1h:
The current converging fluctuation range of gold prices is clearly visible within the fan structure.
Gold prices have remained strong after breaking through.
We expect Thursday's interest rate cut to drive another surge in gold prices across the board.
Expected target: Around 3750 points.
Next, it's important to note that after all the positive news is released, gold prices will be cashed out at high levels, leading to profit-taking. This is likely to cause a waterfall-like decline in gold prices at the top.
Therefore, ordinary traders must remain cautious when buying with the trend.
Currently, the most effective way to profit is scalping, entering and exiting quickly, and setting reasonable stop-loss orders.
Trading Strategy:
Conservative:
BUY: 3675-3685
SL: 3660
TP: 3700-3750
Aggressive:
BUY: 3685-3690
SL: 3675
TP: 3700-3720-3750
Be cautious with short positions.

Gold on Fire: Fed Rate Cuts & Global Tensions Fueling the Rally!Hello, fellow traders! Gold (XAU/USD) is on an absolute tear, closing strong at $3,680.80/oz on September 15, 2025, after hitting a new all-time high (ATH) of $3,685.39/oz. The past week has been solid, with gold up 1.6% as the US dollar weakened (down 0.3% to a one-week low) and US bond yields dropped. The market is buzzing with talk of a sure-shot 0.25% Fed rate cut on September 17, with some even betting on a bigger 0.5% move as per the CME FedWatch Tool. Plus, geopolitical tensions and reports of China easing gold import norms are adding more fuel to this fire. Let's do a deep dive and check out some solid trading setups! 💰
Fundamental Analysis: All That Glitters Is Gold! 🌟
Fed Rate Cuts: The latest US data is a mixed bag—the August CPI was hot, but the jobs market is cooling down. This is giving the Fed a clear signal to cut rates for the first time since December 2024. Lower interest rates are a big negative for the US Dollar, making non-yielding assets like gold super attractive. This is a classic "buy the rumor, sell the news" situation, but right now, the rumor is all about buying gold!
Geopolitical Jitters: The upcoming Fed meeting is quite tense, with political drama and a lot of pressure from the White House. This kind of uncertainty is gold's best friend, as it’s the ultimate safe-haven asset.
Chinese Demand: Recent reports suggest China is making it easier to import gold, which means more demand is coming from the world's biggest consumer. Strong buying from both official and private players in China is a major tailwind for gold's upward move.
Technical Analysis: Breaking All Barriers! 📉
Gold has smashed through the Fibo 2.618 level and is in uncharted territory. What's impressive is that the pullbacks are very shallow, just a $10 blip before it resumes its rally. This shows the bulls are in complete control, and selling pressure is minimal. The strategy is simple: look to buy on dips and be very selective about any shorting opportunities.
Resistance Levels: $3704, $3714, $3724
Support Levels: $3694, $3686, $3674, $3666
Trading Setups (Strict Risk Management Is Key):
Buy Scalp:
Zone: $3688 - $3686
SL: $3682
TP: $3691 - $3696 - $3701 - $3706
Buy Zone:
Zone: $3667 - $3665
SL: $3657
TP: $3675 - $3685 - $3695 - $3705 - $3715
Sell Scalp:
Zone: $3704 - $3706
SL: $3710
TP: $3701 - $3696 - $3691 - $3686
Sell Zone:
Zone: $3724 - $3726
SL: $3734
TP: $3716 - $3706 - $3696 - $3686 - $3676
Gold is at an ATH—so be careful of liquidity traps around the Fed announcement! Above $3694, the target is the sky; below, we could see a test of $3666. Manage your risk tightly before September 17! What's your plan: buy the dip or sell the top? Let me know your strategy in the comments! 👇
#Gold #XAUUSD #Fed #RateCuts #CPI #TradingView #MarketUpdate #Forex #Investing #TechnicalAnalysis #GoldTrading #Finance #Geopolitics #CentralBank

Gold Facing Strong Resistance – Bearish Move Towards Support ?Analysis:
Resistance Zone: Price is struggling to break above the $3,645–$3,650 area, which has acted as a strong resistance multiple times.
Support Levels: Immediate support lies around $3,620 and $3,614, with the major support zone at $3,580.
Price Action: Repeated rejections from resistance indicate weakening bullish momentum. Sellers are gaining control near the resistance zone.
Bearish Outlook: A potential downward move is projected, with price likely to test $3,580 support if resistance continues to hold.
Risk Management: A break and close above $3,650 would invalidate the bearish scenario and could trigger a bullish continuation.
✅ Bias: Bearish below $3,650
🎯 Targets: $3,620 → $3,614 → $3,580
🛑 Invalidation: Above $3,650

Part ! Ride The Big MovesWhat is an Option?
An option is a financial derivative that gives the holder the right, but not the obligation, to buy or sell an underlying asset at a predetermined price (strike price) on or before a specified date (expiration date).
Underlying Asset: This can be a stock, index, commodity, currency, or ETF.
Strike Price: The price at which the asset can be bought or sold.
Expiration Date: The date on which the option contract expires.
Premium: The price paid to purchase the option.
There are two main types of options:
Call Option: Gives the holder the right to buy the underlying asset at the strike price.
Put Option: Gives the holder the right to sell the underlying asset at the strike price.
Call Options Explained
A call option becomes profitable when the price of the underlying asset rises above the strike price plus the premium paid.
Example:
Stock price: ₹1,000
Strike price: ₹1,050
Premium: ₹20
If the stock rises to ₹1,100:
Profit = (Stock Price – Strike Price – Premium) = 1,100 – 1,050 – 20 = ₹30
If the stock remains below ₹1,050, the option expires worthless, and the loss is the premium paid.

Gold 1H – Breakout Liquidity Trap Ahead of ExpansionGold on the 1H timeframe is consolidating around 3,652 after sweeping discount liquidity and reclaiming structure. Price has tapped the breakout zone and is currently trading between the scalp supply in premium and the higher liquidity pools. The structure indicates engineered moves into 3,656–3,658 or deeper liquidity around 3,672–3,674 before the next expansion. Discount demand remains protected at 3,614–3,612.
________________________________________
📌 Key Structure & Liquidity Zones (1H):
• 🔴 SELL ZONE 3,672 – 3,674 (SL 3,679): Premium supply pocket for engineered rejection, targeting 3,660 → 3,650 → 3,640.
• 🔴 SELL SCALP 3,656 – 3,658 (SL 3,663): Short-term premium sweep zone for intraday liquidity grabs, targeting 3,645 → 3,640.
• 🟢 BUY ZONE 3,614 – 3,612 (SL 3,607): Discount demand block aligned with bullish order flow, targeting 3,630 → 3,640 → 3,655.
________________________________________
📊 Trading Ideas (Scenario-Based):
🔻 Sell Setup – Premium Scalp Rejection
• Entry: 3,656 – 3,658
• Stop Loss: 3,663
• Take Profits:
TP1: 3,645
TP2: 3,640
👉 Intraday scalp opportunity if price sweeps into shallow premium liquidity.
🔻 Sell Setup – Deeper Premium Sweep
• Entry: 3,672 – 3,674
• Stop Loss: 3,679
• Take Profits:
TP1: 3,660
TP2: 3,650
TP3: 3,640
👉 Expect an engineered sweep into higher premium before reversal.
🔺 Buy Setup – Discount Demand Reaction
• Entry: 3,614 – 3,612
• Stop Loss: 3,607
• Take Profits:
TP1: 3,630
TP2: 3,640
TP3: 3,655
👉 A high R:R trade if price retraces to the protected demand before expansion.
________________________________________
🔑 Strategy Note
Smart money is likely to manipulate both premium and discount zones near the breakout point. The directional bias favours:
• Scalp sells at 3,656–3,658
• Swing sells at 3,672–3,674
• Discount buys at 3,614–3,612
Strict risk management is essential — expect liquidity sweeps on both sides before the actual expansion.

XAUUSD ANALYSIS 16-SEP-2025LTP 3684.x
Supports: 3610/3397/3313/3119 (base support)
As long as the above supports hold, we will see 3677-3700-3734 (expecting some correction from this level).
Further,
3819-3834-3910
4155
4655

Gold prices are expected to remain volatile: $3,635-3,660.Gold prices are expected to remain volatile: $3,635-3,660.
International gold prices are fluctuating at high levels, with market expectations of a Fed rate cut and geopolitical risks acting as key support.
From a technical perspective, the overbought region supports the view that gold prices will continue to fluctuate within a range.
As shown in Figure 2h:
Key short-term support levels: $3,620-3,635-3,600; resistance level: $3,660.
Market focus is highly focused on this week's Federal Reserve FOMC meeting, with the market pricing in a 25 basis point rate cut probability exceeding 93%.
This is likely to trigger the next directional breakout in gold.
Gold faces short-term technical correction pressure and needs to consolidate before building momentum for the next round of gains.
Key Support and Resistance Levels:
Upward Resistance: Near-term major resistance lies in the $3,657-3,658 range.
A successful breakout could re-challenge the all-time high of $3,675 and open the door for a test of the $3,700 mark. Downside Support: Immediate support lies in the $3,627-3,620 range.
If broken, further declines to $3,600-3,580 (static level, 20-day simple moving average) are possible. Stronger support lies at the psychological level of $3,500.
Current Trend Analysis: Since reaching a new all-time high, gold prices have not shown any clear reversal signals (such as a high-level shooting star or a large black candlestick), indicating that bullish market sentiment remains dominant.
Currently, the price is consolidating at a high level, which can be considered a healthy correction within the trend.
Trading Strategy:
Short-term traders: Try to buy low and sell high in the $3,620-3,660 range, but be sure to maintain a small position and set a strict stop-loss.
Focus on a directional breakout opportunity after the Fed's decision.
Medium- to long-term investors: The bullish trend in gold remains unchanged.
Any pullback caused by the market "selling the facts" or by less-than-expected dovish Fed comments could be an opportunity to establish a phased long position in the $3,600-3,500 support area.
Key Points to Watch Next:
Federal Reserve FOMC Meeting (this week): More importantly, it's not just the interest rate decision, but also the future rate trajectory and Powell's outlook for the economy and inflation.
Other Central Bank Moves: The Bank of England, Bank of Japan, and others will also announce interest rate decisions, which will influence global liquidity expectations and the dollar's trajectory.
Geopolitical Situation: Any escalation in the Russia-Ukraine conflict or the situation in the Middle East could trigger a new round of safe-haven buying.
US Economic Data: Any data on employment, inflation, and economic growth will influence market expectations of Fed policy.

Gold 1H – Fed Week: Liquidity Sweeps Before FOMCGold on the 1H timeframe is range-bound around 3,643 after a series of ChoCH/BOS prints. Liquidity is stacked above the intraday buy zone at 3,658–3,656 and higher at 3,676–3,678, while discount liquidity sits near 3,615–3,613. With markets pricing a possible Fed cut this week and the dot-plot in focus, expect engineered spikes into premium followed by mean reversion before any sustained move.
________________________________________
📌 Key Structure & Liquidity Zones (1H):
• 🔴 SELL ZONE 3,676 – 3,678 (SL 3,683): Premium resistance for an engineered sweep/rejection targeting 3,665 → 3,655 → 3,645.
• 🟢 BUY ZONE 3,658 – 3,656 (SL 3,651): Intraday demand within prior consolidation targeting 3,665 → 3,670 → 3,675+.
• 🟢 BUY SUPPORT 3,615 – 3,613 (SL 3,610): Discount demand at the base of structure targeting 3,630 → 3,645 → 3,655+.
________________________________________
📊 Trading Ideas (Scenario-Based):
🔺 Buy Setup – Intraday Reclaim (3,658–3,656)
• Entry: 3,658 – 3,656
• Stop Loss: 3,651
• Take Profits:
TP1: 3,665
TP2: 3,670
TP3: 3,675+
👉 Look for a sweep into the zone and an H1 close back above 3,656 to confirm order-flow continuation.
🔺 Buy Setup – Deep Discount Sweep (3,615–3,613)
• Entry: 3,615 – 3,613
• Stop Loss: 3,610
• Take Profits:
TP1: 3,630
TP2: 3,645
TP3: 3,655+
👉 High R:R if liquidity runs into protected demand before the New York session.
🔻 Sell Setup – Premium Sweep to Resistance (3,676–3,678)
• Entry: 3,676 – 3,678
• Stop Loss: 3,683
• Take Profits:
TP1: 3,665
TP2: 3,655
TP3: 3,645
👉 Expect a stop-run above recent highs into premium; invalidate on a firm H1 close above 3,683.
________________________________________
🔑 Strategy Note
Into Fed week, smart money often runs both sides of the book. Bias today favours: discount buys at 3,658–3,656 and 3,615–3,613, and a premium fade at 3,676–3,678. Use reduced size, wait for structure confirmation, and avoid holding through any unexpected Fed headlines or USD spikes.

Gold Analysis and Trading Strategy | September 15✅ Fundamental Analysis
🔹 Fed Rate Cut Expectations
The Federal Reserve is almost certain to cut rates by 25 basis points in September, which is the market consensus. The recent rally in gold has been primarily driven by “rate cut expectations” rather than purely safe-haven demand. As the rate decision approaches, market volatility is expected to increase.
🔹 Geopolitical Risk Support
Ongoing global geopolitical risks continue to provide additional safe-haven support, keeping gold prices within a strong range.
🔹 “Buy the Rumor, Sell the Fact” Logic
Before the rate decision: Market sentiment dominates, with gold maintaining a high-level bullish consolidation.
After the rate decision: If the rate cut is delivered and Powell does not sound excessively dovish, a short-term pullback could occur on “sell the fact” behavior.
✅ Technical Analysis
🔸 From a structural perspective, gold broke out of a four-month consolidation range and formed a strong unilateral uptrend, reaching as high as $3674. Based on the principle of “the longer the base, the higher the move,” the trend remains strong, with no clear topping signal yet. However, the rapid rise has caused short-term overextension, suggesting a need for technical correction.
🔸 On the 4-hour chart, the current candles are trading near the Bollinger Band midline (around $3640), showing balanced forces between bulls and bears. The narrowing Bollinger Bands indicate a consolidation phase. A strong breakout above the upper band ($3660) could lead to a retest of $3675–3680. The MA5, MA10, and MA20 are converging, showing that the market is waiting for a directional breakout. As long as prices hold above MA20 ($3640–3620), the bullish structure remains intact.
🔴 Resistance Levels: 3657–3660 / 3675–3680
🟢 Support Levels: 3625–3630 / 3605–3610
✅ Trading Strategy Reference:
🔰 Short-Term Idea: Focus on buying on dips near the 3625–3630 support zone. Light short positions may be considered if the price stalls near 3657–3660.
🔰 Medium-Term Idea: If gold breaks and holds above 3675–3680, the rally could extend toward 3700 or even new highs. If it falls below 3620–3610, a deeper correction may unfold, targeting 3595–3580.
🔥Trading Reminder: Trading strategies are time-sensitive, and market conditions can change rapidly. Please adjust your trading plan based on real-time market conditions. If you have any questions , feel free to contact me🤝
Elliott Wave Analysis XAUUSD – 15/09/2025
1. Momentum
• D1 timeframe: Momentum is about to enter the oversold zone. At the beginning of next week (Monday), D1 may officially enter the oversold area and start reversing upward.
• H4 timeframe: Momentum is also approaching the oversold zone and preparing to reverse. This opens the expectation of a bullish move within the next 1–2 sessions.
• H1 timeframe: Momentum is currently declining, so there may be one more short-term drop to push H1 into oversold conditions before a potential reversal.
________________________________________
2. Wave Structure
• D1 timeframe:
Price is still within wave iv (black). In terms of time, wave ii (black) took 7 daily candles to complete. According to the principle of alternation, waves 2 and 4 often differ in nature. With D1 momentum about to reach oversold, there is a high probability that wave iv (black) is near completion.
• H4 timeframe:
Price is moving sideways, which is consistent with the characteristics of wave iv. If in the next session H4 momentum reverses upward and reaches overbought while price still fails to break above 3657, then the corrective structure may evolve into a triangle or a double three (WXY).
• H1 timeframe:
An ABC corrective structure seems completed, but instead of rallying, price continues to consolidate within the liquidity block at 3657 – 3631. This suggests a more complex structure is unfolding, either a triangle or a WXY combination.
With D1 momentum heading into oversold, the expected downside range is 3631 – 3595, which also aligns with the nearest high-liquidity zones on the chart.
________________________________________
3. Price Zones & Targets
• Breakout level:
o 3657 → A strong candle close above this level would confirm a buy signal.
• Support / Buy zones:
o 3631 – 3632 → Possible bottom of the current correction.
o 3593 – 3596 → Scenario if wave iv develops into a WXY structure.
• Wave v (black) target:
o Projection: 3709 (main target).
________________________________________
4. Trading Plan
1. Buy Breakout 3657
o SL: below breakout candle
o TP: 3709
2. Buy Zone 3632 – 3630
o SL: 3622
o TP: 3709
3. Buy Zone 3596 – 3593
o SL: 3585
o TP: 3709
________________________________________
👉 Summary: Both D1 and H4 momentum are approaching oversold, signaling that wave iv (black) may soon complete. The preferred strategy is to wait for confirmation at liquidity zones (3631 – 3595), or for a strong breakout above 3657, to join the next bullish wave v (black) targeting 3709.

XAUUSD Gold Trading Strategy September 15, 2025XAUUSD Gold Trading Strategy September 15, 2025: Weekly trend outlook, gold still has enough conditions for the possibility of continued price increases.
Basic news: After surpassing the 3670 USD/ounce mark, the highest level in history, the gold price has entered a correction phase, in the context of the market focusing on monitoring the policy moves of the US Federal Reserve (Fed). According to CME's FedWatch tool, investors are almost certain that the Fed will cut interest rates by 25 basis points, bringing the margin to 4 - 4.25%. However, the scenario of the Fed cutting 50 basis points is still considered, because this could cause the USD to plummet and push gold to skyrocket.
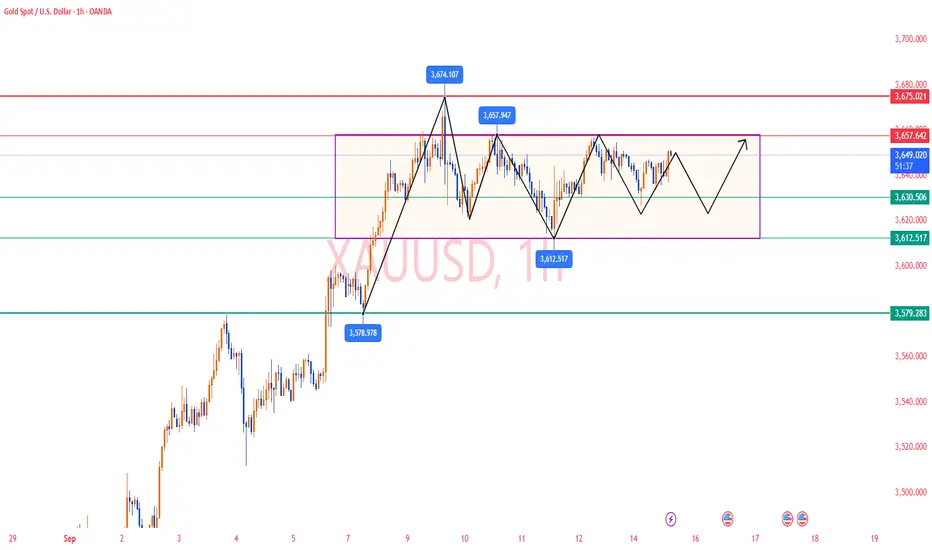
Technical analysis: The sideway range of 3600 - 3660 is still holding. Currently, we will wait for trading points at the 2 edges of the sideway range, but the priority is still mainly trading according to the trend.
Important price zones today: 3600 - 3605 and 3660 - 3665. Today's trading trend: Sideway.
Recommended orders:
Plan 1: BUY XAUUSD zone 3600 - 3602
SL 3597
TP 3605 - 3615 - 3635 - 3665 - OPEN.
Plan 2: BUY XAUUSD zone 3618 - 3620
SL 3615
TP 3623 - 3630 - 3650 - 3665.
Plan 3: SELL XAUUSD zone 3663 - 3665
SL 3668
TP 3660 - 3650 - 3640 - 3630 (small volume).
Wish you a new week of safe, effective and profitable trading.🥰🥰🥰🥰🥰

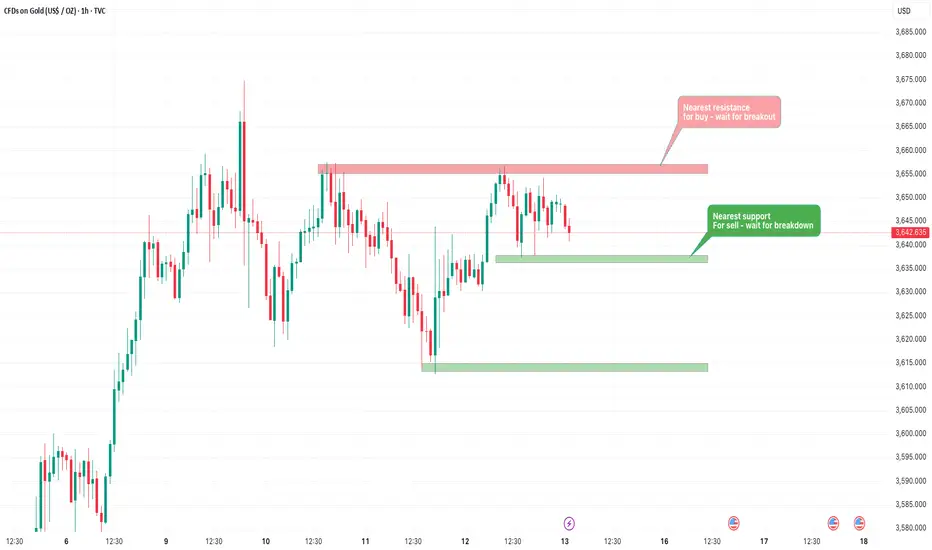
This pattern will go longResistance and support line are made .now we looking for what happen in futures.becase trand is buy so we only focus on buying chance.when price drop support line we will enter trade.target area resistance
Gold faces early selling pressure | Main trend still Buy🟡 XAU/USD – 15/09 | Captain Vincent ⚓
🔎 Captain’s Log – News Context
FED rate cut probabilities this week :
-25bps : 96.4% (up from 89.1%).
-50bps : only 3.0% (down sharply from 10.9%).
Trump : Announced more sanctions on Russia, urged NATO to stop buying Russian oil; also emphasized “the possibility of significant FED rate cuts.”
Key event today : New York Manufacturing Index at 1:30 (US time).
⏩ Captain’s Summary : The sharp drop in -50bps expectations caused early selling pressure on Gold this morning. But overall, FED is still certain to cut rates and inflation is cooling → the bigger trend continues to favor Buy .
📈 Captain’s Chart – Technical Analysis
Storm Breaker (Resistance / Sell Zone) : 3665 – 3670 (Weak High & upper cap).
Golden Harbor (Support / Buy Zone) : 3623 – 3603 – 3587.
Market Structure :
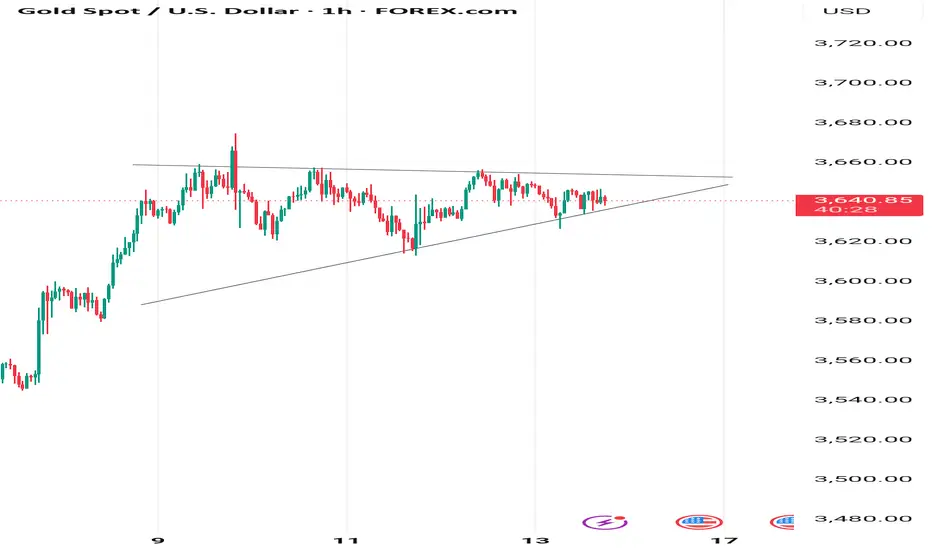
On H1, Gold is moving within a tightening triangle with EqH and EqL .
Main trend stays bullish, but needs a retest of support before rallying toward 3665 – 3670.
🎯 Captain’s Map – Trade Plan
✅ Buy (priority)
Buy Zone 1
Entry: 3623 – 3625
SL: 3612
TP: 3640 – 3650 – 3660 – 3665+
Buy Zone 2 (FVG)
Entry: 3603 – 3605
SL: 3592
TP: 3620 – 3640 – 3655 – 3665
Deep Buy Zone
Entry: 3587 – 3590
SL: 3575
TP: 3610 – 3630 – 3650
⚡ Sell (short scalp at resistance)
Sell Zone
Entry: 3665 – 3670
SL: 3678
TP: 3655 – 3645 – 3635 – 36xx
⚓ Captain’s Note
“The Golden ship faces headwinds this morning as sailors reduce expectations for a -50bps cut. But the larger sail remains filled with dovish FED winds, steering the voyage north. Golden Harbor 🏝️ (3623 – 3603 – 3587) is the safe dock to gather strength. Storm Breaker 🌊 (3665 – 3670) may raise waves, suitable for short Quick Boarding 🚤 . The main journey still favors Buy , waiting for the FED to blow more tailwind into the Golden sails.”

xau paper trade placedFollowing the close of the Asian session, market sentiment remains firmly bullish. Key indicators and price action suggest continued upward momentum as we transition into the London session.
Given this outlook, I am initiating a buy-side trade in anticipation of further strength. The setup aligns with our broader strategy and risk parameters, and I will continue to monitor price behavior closely for confirmation and potential scaling.
Please stay alert for any updates or adjustments as the session unfolds

XAUUSD TECHNICAL OUTLOOK , SEP 15,2025📊 XAUUSD Technical Outlook
Over the past week, price has been consolidating in a tight range between 3656 – 3624, indicating a buildup of momentum.
🔑 Key Level to Watch:
📉 Demand Zone: Near 3530, which also aligns with the Fib 61.8% retracement level – a strong confluence area.
A possible retracement toward 3530 could offer buyers a favorable entry before the next bullish leg.
📈 Bias:
As long as price holds above 3530, we anticipate a potential upside continuation after a short-term pullback.
⚠️ Trading Plan:
Watch for bullish confirmation near 3530 before entering long positions.
Manage risk carefully if price breaks and closes below this key level.

Gold Outlook – Short-Term Pullback, Long-Term StrengthGold has shown a strong bullish phase over recent weeks after a long consolidation. The market moved from accumulation into expansion, reflecting renewed participation by larger players. This upward momentum indicates strong capital inflows, supported by macroeconomic uncertainty and shifting investor sentiment.
Technically, price has broken out of a prolonged range and established a clear upward trajectory. Market structure suggests that buyers remain in control, though current price levels are showing signs of potential exhaustion, which could trigger short-term corrective moves before the broader trend resumes.
Fundamentally, global economic pressures continue to boost gold’s role as a safe-haven asset. Concerns over inflation, central bank policy adjustments, and currency volatility are keeping investor demand elevated. With global risk sentiment fluctuating, gold is likely to remain an attractive hedge, sustaining its medium-term bullish outlook despite short-term pullbacks.
Conclusion: Gold is in an expansion cycle, supported by both technical momentum and fundamental demand. Short-term corrections are expected, but the broader trajectory remains upward.

Gold Nears Peak: Fed Cut Hype Fuels Indian Trades!Namaste, traders! Gold (XAU/USD) climbed 0.4% on Friday (12/09/2025), closing at $3,648.55/oz, just shy of its all-time high of $3,673.95/oz (09/09). With a 1.7% weekly gain—its fourth straight week up—gold is riding high on weak US labor data, cementing bets for a Fed rate cut on 17/09. CPI showed inflation up sharply, but labor weakness dominates, making gold a top pick for Indian traders on MCX. Let’s dive into the market and grab trading opportunities! 💰
Fundamental Analysis: Gold’s Shine Bright for India 🌟
Rate Cut Buzz: Weak US jobs (surging claims, 911,000 jobs revised down) and a soft PPI push 100% odds for a 0.25% Fed rate cut, with 0.5% less likely (CME FedWatch). Low rates ease USD and Treasury pressure, boosting gold’s appeal for INR portfolios.
Global Tailwinds: Gold’s 39% YTD rally (after 27% in 2024) is fueled by a weak USD, China’s 10-month gold buying spree, and global unrest. China’s move to simplify gold import rules signals stronger demand—great for Indian investors!
Market Focus: CPI (11/09) showed hotter inflation, but labor weakness keeps Fed easing on track. No major shocks (like Trump tariffs) mean dips are buying opportunities—perfect for MCX futures!
Technical Analysis: Consolidation Near Highs – Buy Dips 📉
Gold’s weekly chart shows consolidation at Fibonacci 2.618 (3650), with wide sideways action, closing below 3650 as anticipated. A deeper pullback isn’t confirmed, but liquidity zones at 359x and 354x are ideal for buying, while 370x is a sell zone if the rally continues. Watch volume for reversal or rejection signals to avoid traps.
Resistance: 3655 - 3684 - 3694 - 3704
Support: 3621 - 3595 - 3582 - 3559 - 3545
Trade Setups (Tight RR):
Buy Zone: 3582 - 3580 (SL: 3572; TP: 3590 - 3600 - 3610 - 3640) – Long-term buy on deeper dips.
Buy Zone: 3546 - 3544 (SL: 3536; TP: 3554 - 3564 - 3574 - 3594) – Buy at strong support.
Sell Zone: 3703 - 3705 (SL: 3713; TP: 3695 - 3685 - 3675 - 3665) – Sell if rally hits round levels.
Gold’s consolidating near highs—beware liquidity traps! Above 3621, bulls eye new highs; below, test 359x/354x. Indian traders, manage risk tightly for Fed volatility! Buy dips or sell highs? Share your MCX strategies below! 👇
#Gold #XAUUSD #Fed #CPI #TradingView #MarketUpdate #Forex #GoldTrading #IndiaTrading #MCX #USInflation #RateCuts #CentralBanks

XAUUSD I saw this in weekly. I saw it in daily as well. Right now we have the previous day's high and low in Gold. I hope Gold will reach the previous day's low. After that we get an order block,This is a Bullish OB, either Gold should sweep this OB or give some LTF confirmation. Then you can get buying from here

Watch for gold prices: Pressure is building in the 3650-3660 ranWatch for gold prices: Pressure is building in the 3650-3660 range.
The gold market is currently being influenced by both bullish and bearish factors. On the one hand, inflation is showing strong resilience, while on the other, the job market is showing clear signs of weakness.
Market expectations for a Fed rate cut remain firm.
The probability of a 25 basis point rate cut is as high as 91%.
Trump's tough rhetoric toward Russia and Europe, as well as escalating tensions in the Middle East, have increased market uncertainty.
In-depth Technical Analysis:
1: Gold has entered a consolidation phase after reaching a record high, facing short-term directional analysis.
2: The daily chart remains extremely overbought.
3: The lack of further declines on Wednesday suggests that the pullback is a normal correction after a significant rebound.
Even if the market peaks, it won't be that simple. It will at least experience a period of "high-level fluctuations turning bearish" or "a secondary rebound, enticing investors to buy before the decline."
4: The current consolidation may be a preparation for further upward momentum or a significant correction.
5: Upward Resistance:
Short-term focus: $3643-3653-3674; subsequently, focus on the psychological level of $3700.
Downward Support:
Short-term support lies in the $3620-3615 area; key support lies at $3600.
6: Two possible scenarios for the next phase of the trend:
Optimistic Scenario: Gold prices hold the $3615 support level and rise again after the Fed's rate cut, testing $3700 or even higher.
Cautious Scenario: Gold prices will first fall back to the $3550-3600 area for consolidation, digesting recent gains before seeking upward movement.
Today's Strategy:
SELL: 3650-3660
SL: 3672
TP: 3640-3630-3615--3600
BUY: 3635-3640 (Aggressive)
SL: 3630
TP: 3650-3660-3670+
BUY: 3610-3620 (Conservative)
SL: 3600
TP: 3630-3640-3650-3660+

Gold - Buy near 3640, target 3657-3674Gold Market Analysis:
Yesterday, gold prices saw a wild swing throughout the day due to the CPI. Gold initially fell, breaking support at a low near 3613. Buying activity took off immediately on the data. Today, we're still looking for volatility. Keeping in mind the broader trend, buying into volatility is more likely to follow a pullback. Furthermore, this volatility has broken through the previous downtrend channel. Today marks the weekly close, and barring any major surprises, the weekly chart will likely close positive. Next week, gold will continue to reach new highs, and a break of 3700 is imminent. The daily moving average has already crossed the K-line, making further volatility less likely. Focus on buying into the upside today. Consider buying opportunities in the Asian session first.
The chart shows support near 3640, the primary support level for the day. Today, we'll target 3640 for buy orders, keeping an eye on resistance at 3657. If it breaks through and then retraces in the Asian session, we can buy directly. The recent trend in gold requires aggressive buying, otherwise it's often difficult to find significant support. Since it's Friday, gold is unlikely to behave normally, so we must be wary of unusual fluctuations.
Support is at 3640 and 3629, while resistance is at 3657 and 3674. 3640 is the dividing line between strength and weakness.
Fundamental Analysis:
The CPI estimate was 2.7%, while the market expected 2.9%, and the price also reached 2.9%. Both market expectations and results were higher than the estimate, which would have weighed on gold in the long term. However, gold did not fall, but instead surged.
Trading Recommendations:
Gold - Buy near 3640, target 3657-3674

How long can the gold "carnival" last?Market News:
Spot gold maintained its overnight volatile trend in early Asian trading on Friday (September 12), currently trading around $3,636/oz. International gold prices fluctuated sharply due to the impact of US CPI and initial jobless claims data. London gold prices rebounded sharply after a sharp drop, paring most of the day's losses and ultimately closing slightly lower. Weak employment and a decline in the PPI have reinforced market expectations of a Federal Reserve rate cut next week. With interest rate expectations shifting toward easing, gold is expected to maintain its strength, but key factors remain in the Fed's policy stance following the meeting. The Fed's monetary policy direction remains the strongest indicator for the gold market, and current market consensus sees a rate cut next week as a certainty. Focus on the UK's July GDP data and the US University of Michigan's preliminary September Consumer Confidence Index on August 8 this trading day, and monitor geopolitical developments.
Technical Analysis:
Weaker-than-expected inflation and initial jobless claims data reinforced expectations of a Fed rate cut. The US dollar index fell in response, ultimately closing down 0.31. Technically, the daily chart showed alternating bearish and bearish trends, with the price closing above the 5-day moving average. Yesterday, support was found again after testing 3612/15. The 10/7-day moving averages moved up to 3690/16, and the RSI indicator was converging above the 70 level. From a 4-hour perspective, support is currently focused around 3610-15. Buying on intraday dips to this level will continue to support the bullish trend. The short-term buying barrier remains at 3600. If the daily chart stabilizes above this level, continue buying on dips. On the 4-hour chart, the price has retreated to the middle Bollinger Band at 3630, converging with the moving average. The RSI indicator is trading above its mid-axis. On the hourly chart, the Bollinger Bands are closing, the RSI is flattening, and the moving averages are converging. The main trading strategy for Friday's pullback remains to buy at low prices. The weekly chart forecasts another bullish candlestick pattern. However, gold prices are trapped within a wide, volatile short-term structural channel, with high-priced selling participating.
Trading strategy:
Short-term gold: Buy at 3620-3623, stop loss at 3612, target at 3640-3660;
Short-term gold: Sell at 3657-3660, stop loss at 3669, target at 3630-3610;
Key points:
First support level: 3628, second support level: 3615, third support level: 3600
First resistance level: 3658, second resistance level: 3667, third resistance level: 3680
