Today(17/11/2025),nifty50 analysis.
CPR: slightly wide + overlapping lower cpr: sideways to bearish.
FII: -4,968.22 sold.
DII: 8,461.47 bought.
Highest OI:
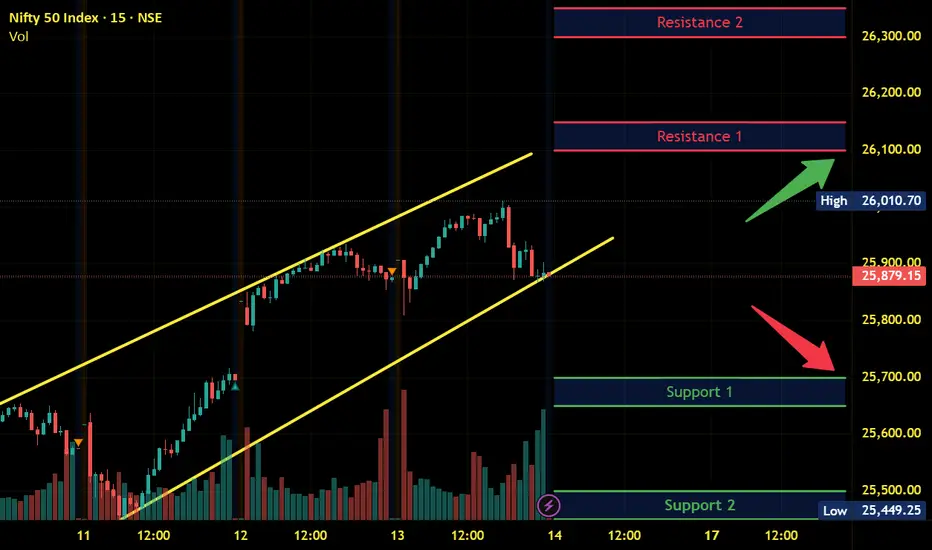
Resistance: 26000, 26100
Support : 25800,25700
conclusion:
My pov: market is neutral to bearish, If and only 26100 is closed and crossed i view as bullish trend lets wait and watch. why because FII keep selling, That the reason i cant clearly think market is in bullish,
psychology fact : Trading is a profession where you have to think freely and creatively.
note:
8moving average ling is blue colour.
20moving average line is green colour
50moving average line is red colour.
200moving average line is black colour.
cpr is for trend analysis.
MA line is for support and resistance.
Disclaimer:
Iam not Sebi registered so i started this as a hobby, please do your own analysis, any profit/loss you gained is not my concern. I can be wrong please do not take it seriously thank you.
Trade ideas

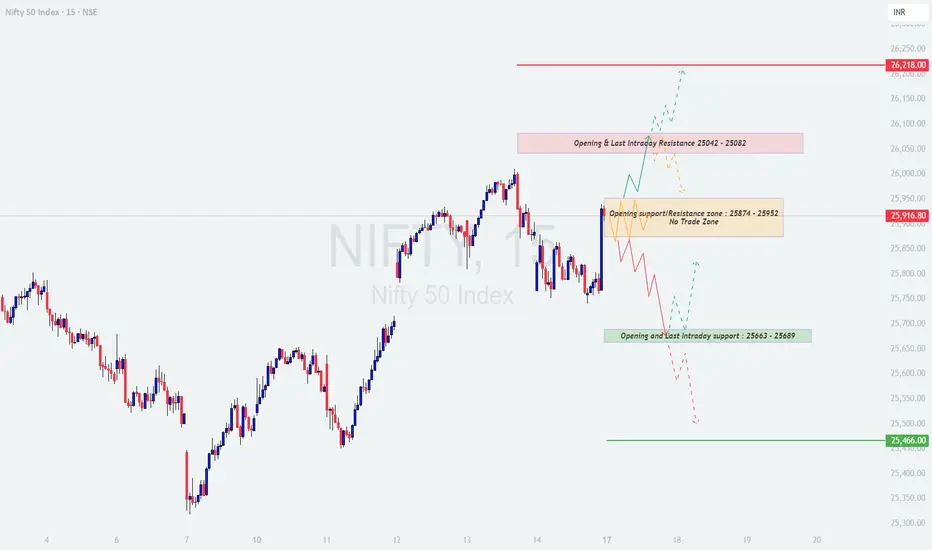
NIFTY : Trading levels and Plan for 17-Nov-2025📊 NIFTY TRADING PLAN — 17 NOV 2025
(Timeframe Reference: 15-Min Chart)
Chart Summary:
Nifty closed around 25,916 , maintaining a balanced but cautious structure ahead of the new trading week. The index currently trades near the Opening Support / Resistance Zone (25,874 – 25,952) , which is a key “no-trade” area as highlighted on the chart.
Immediate resistance lies at 26,042 – 26,082 (Opening & Last Intraday Resistance Zone) , while strong support exists near 25,663 – 25,689 (Opening & Last Intraday Support Zone) .
The index currently shows a neutral-to-slightly bullish undertone as long as price sustains above 25,874 . A breakout above 25,952 can trigger an upmove toward 26,082 – 26,218 , while a breakdown below 25,874 may lead to short-term weakness toward 25,680 – 25,466 .
Key Zones to Watch:
🟩 Support Levels: 25,689 / 25,466
🟥 Resistance Levels: 25,952 / 26,082 / 26,218
⚖️ No Trade Zone: 25,874 – 25,952 (avoid trading until breakout confirmation)
---
🟢 Scenario 1: GAP-UP Opening (100+ Points)
If Nifty opens around or above 26,020 – 26,050 , it will directly test the Last Intraday Resistance Zone (26,042 – 26,082) . A strong gap-up near resistance often attracts early profit booking or sideways consolidation before directional clarity emerges.
If the price sustains above 26,082 with a strong bullish candle and volume confirmation, upside targets open toward 26,180 – 26,218 .
If price faces rejection at 26,082 (long upper wicks or doji patterns), expect a pullback toward 25,952 – 25,874 .
Traders should avoid buying calls immediately after a gap-up; instead, wait for a retest of the 26,042 zone for better confirmation.
Sustained momentum beyond 26,100 will confirm strength and can lead to intraday trend continuation.
💡 Educational Note:
Gap-ups near major resistance zones often trap impulsive traders. The best approach is to let the market test and confirm whether the breakout is genuine or just a liquidity trap. Watch for rising volume with closing candles above the breakout level for confirmation.
---
🟧 Scenario 2: FLAT Opening (Around 25,880 – 25,920 Zone)
A flat opening within the No Trade Zone (25,874 – 25,952) indicates indecision. The price may spend the first 15–30 minutes moving sideways as buyers and sellers battle for control.
Avoid trading inside this range — it’s a “neutral zone” with no clear edge.
If price breaks and sustains above 25,952 , bullish continuation can take Nifty toward 26,082 – 26,218 .
If price breaks below 25,874 , weakness may extend toward 25,689 – 25,466 .
Wait for a strong 15-min candle close beyond the range for confirmation — don’t pre-empt the breakout.
🧠 Educational Tip:
Flat openings near key levels require patience. Most false breakouts occur when traders enter without confirmation. Wait for candle structure and volume validation before committing. Strong moves often follow after consolidations — let the direction emerge naturally.
---
🔴 Scenario 3: GAP-DOWN Opening (100+ Points)
If Nifty opens around 25,700 – 25,750 , it will directly test the Opening & Last Intraday Support Zone (25,663 – 25,689) . This zone will be critical for bulls to defend — a breakdown below could open room for deeper correction.
If reversal patterns (hammer, bullish engulfing) appear around 25,680 , expect a bounce toward 25,874 – 25,952 .
If the price fails to hold 25,663 , next support lies near 25,466 — which can act as a short-term target zone for sellers.
Avoid chasing short trades at the open; instead, wait for a pullback toward 25,850 – 25,880 to initiate low-risk entries.
Volume divergence (falling volume with declining price) near support is often a sign of selling exhaustion — watch closely for reversals.
📘 Educational Insight:
Gap-down openings are often ruled by emotions — panic selling and fear dominate. Experienced traders look for structure, not emotion. Reversal signals near major supports usually offer high reward-to-risk setups once panic subsides.
---
💼 RISK MANAGEMENT TIPS FOR OPTIONS TRADERS:
Avoid entering trades in the first 15 minutes of market open — IV spikes and volatility whipsaws can distort option prices.
Use only 1–2% of total trading capital per position. Focus on longevity, not short-term aggression.
Prefer ATM or slightly ITM options for better delta exposure and lower time decay impact.
Always set a stop-loss — trail it once the trade moves 30–40 points in your favor.
Book partial profits at nearby supports/resistances — protect gains and avoid greed traps.
Do not average losing positions; instead, accept small losses and preserve capital for better setups.
⚠️ Golden Rule: Avoid overtrading in choppy or low-volume conditions — professional traders focus on quality, not quantity.
---
📈 SUMMARY:
🟧 No Trade Zone: 25,874 – 25,952
🟥 Resistance Zones: 26,082 / 26,218
🟩 Support Zones: 25,689 / 25,466
⚖️ Bias: Bullish above 25,952 | Bearish below 25,874
---
📚 CONCLUSION:
Nifty remains at a decisive inflection point near 25,900 . The day’s directional tone will depend on how price reacts around the No Trade Zone (25,874 – 25,952) . Sustained breakout above 25,952 could trigger a move toward 26,218 , whereas a breakdown below 25,874 may pull the index toward 25,680 – 25,466 .
For intraday traders, patience will be the most valuable skill on 17 Nov. Let price confirm before execution — impulsive entries near range zones often lead to losses.
📊 Remember: Markets reward patience and discipline — clarity always follows confirmation.
---
⚠️ DISCLAIMER:
I am not a SEBI-registered analyst . The analysis shared here is purely for educational and informational purposes . Please do your own research or consult a certified financial advisor before making any trading or investment decisions.
Nifty Gearing Up for a Sharp MoveNifty Gearing Up for a Sharp Move
With Pivot moved to 25863, Nifty is now stronger and clearly showing buildup.
PP is also tight, so a sharp move can come anytime.
Support sits at 25777 and resistance at 26010. A breakout above 26010 can lead to a very sharp upside move.
Even if a dip comes, shorting is not advised. That dip should be treated as an opportunity to open short term long positions.
Short term breadth has improved a lot over the last week, which means the trading environment is likely to return to momentum again very soon.
26500 should be the next target if we sustain above 26000 this week.
Telecom sector looks good for the week ahead.
📊 Levels at a glance:
Pivot: 25863
Support: 25777
Resistance: 26010
Bias: Buy on dip / breakout
Sector to watch: Telecom
That will be all for the day. Take care. Have a profitable tomorrow.

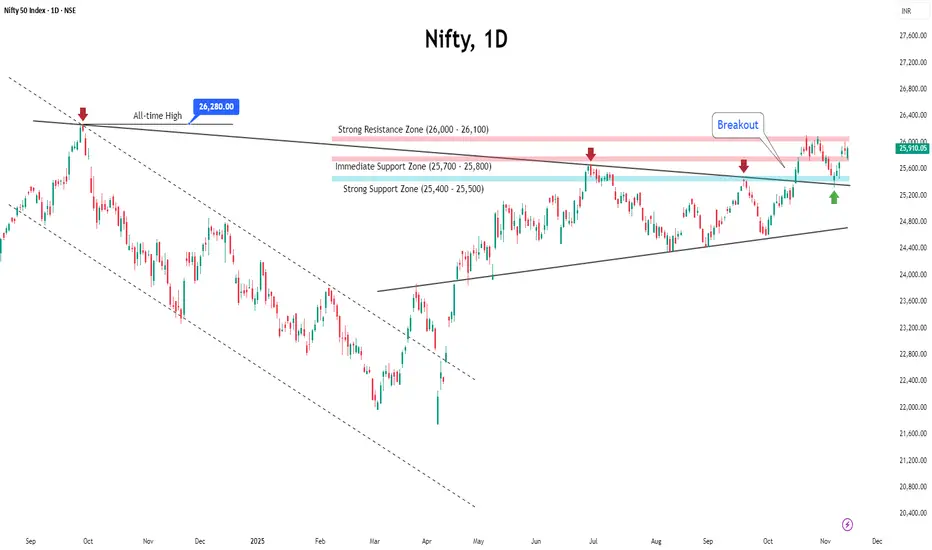
NIFTY looks WEAK as long as it doesn't closes above 26000!Following our analysis, NIFTY couldn't close itself above 26000 mark despite showing strong upmove which was induced by NDA winning over BIHAR which shows political stability in INDIA. On the other hand, despite the recovery, NIFTY couldn't close itself above 26000 mark which shows the lurking weakness which might come in coming trading sessions so plan your trades accordingly and keep watching everyone.

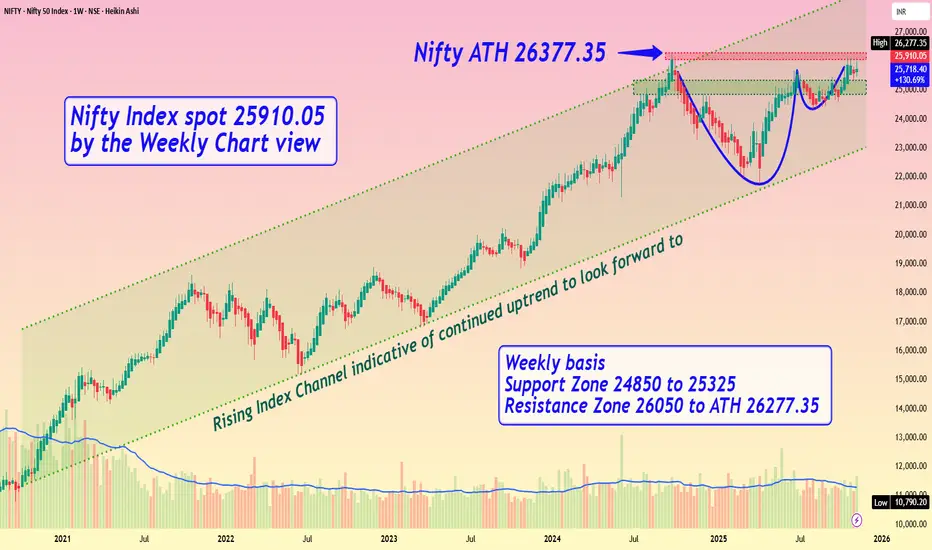
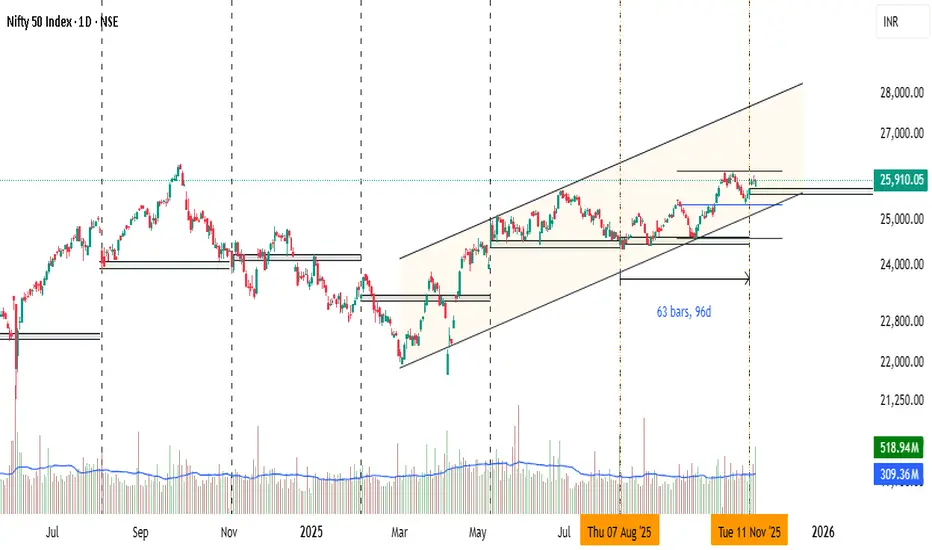
Nifty Index spot 25910.05 by the Weekly Chart viewNifty Index spot 25910.05 by the Weekly Chart view
- Weekly basis - Support Zone 24850 to 25325
- Weekly basis - Resistance Zone 26050 to ATH 26277.35
- Rising Index Channel indicative of continued uptrend to look forward to .....
- Bullish Cup and Handle pattern shows breakout expectation from Resistance Zone
Nifty - Weekly review Nov 17 to Nov 21Price has formed a range between 25750 to 25950. The price is bullish as long as it sustains above 25700. No other pattern is seen in the chart.
Buy above 25920 with the stop loss of 25850 for the targets 25960, 26000, 26060, 26120, 26160, 26200 and 26240.
Sell below 25650 with the stop loss of 25720 for the targets 25610, 25560, 25520, 25460, 25420 and 25380.
If the price faces strong resistance at 26000 - 26100, then it may pull back towards 25700.
How the price reacts at important support/resistance will decide the trend direction.
So far Bank Nifty is supporting Nifty's move.
Always do your analysis before taking any trade.
Nifty Near Key Supply Zone: Breakout Could Unlock 20–25% UpsideNifty is currently trading near a key supply zone and requires a decisive close above 26,100 to confirm further bullish continuation.
The first support is placed around the 25,100–25,200 zone, while major support lies between 24,300–24,450.
A post cup-and-handle retest has been completed, and the price continues to move within a rising channel. Overall, the short-term trend remains positive.
If Nifty successfully breaks through the 25,900 supply zone, a 20–25% upside over the next 10 months appears achievable.

Nifty Analysis - 17/11/25Market was in sideways for the last 3 days but the end of the day closing changed all the dynamics of trend. Now what we can happen tomorrow, if we open flat then we can see a retest of about 60 to 80 points then continuation of uptrend. If we open gap up then we can see a retest to previous day close and then continuation of uptrend. If we see a gap down opening then it will retest till previous day closing or day high then uptrend again. CE above from 25800 till 25920 . PE if we close below 25700 only.

Nifty Opening Monday Upside - 26100 or Downside 25600 (approx.)Sir/Mam,
Tomorrow, Nifty will open in gap either up or down, if it opens UPSIDE that means we are not dependent on Global chaos or if it opens DOWNSIDE that means we are still in concern for Global or some internal tension, real test begins tomorrow. It does not mean that it will show momentum tomorrow itself it will create space to reverse for the coming expiry, for e.g. it wants to close above 26000 it will downfall tomorrow or vice versa.
The real panic for tomorrow is it does not open in FLAT that means 25850 - 25950, this range will be premium eating for both call and put buyers, better to stay out and observe for major single candle (70-80 points) for 15 mins chart pattern.
I hope you all have enjoyed weekends expect who have taken call or put on Friday (waiting to book profit) are nervous.
Let's hope for tomorrow for some big movements.
Asli maza tabh aayega jabh 250 - 300 points ka hulchul hoga :)

Part 9 Trading Master Class with Experts In-the-Money, At-the-Money, Out-of-the-Money
Call Options
ITM: Market price > strike
ATM: Market price ≈ strike
OTM: Market price < strike
Put Options
ITM: Market price < strike
ATM: Market price ≈ strike
OTM: Market price > strike
OTM options are cheap but risky.
ITM options are safer but cost more.

NIFTY- Intraday Levels - 17th November 2025If NIFTY sustain above 25930/34 above this bullish then around 25941/56 above this more bullish then 25996/26000/10 strong level then 26077/84 above this wait more approx levels marked on chart
If NIFTY sustain below 25909 below this bearish then around 25877/70 below this more bearish then 25837/25/17/11/ 25797 strong level then very very strong level 25744/37 below this wait more approx levels marked on chart
My view :-
"My viewpoint, offered purely for analytical consideration, The trading thesis is: Nifty ( bearish tactical approach: sell on rise ) but on good level only. We can expect both side movements , incase market stays buy on dip then the view for expire will be same otherwise expected sell on rise for next two days. This analysis is highly speculative and is not guaranteed to be accurate; therefore, the implementation of stringent risk controls is non-negotiable for mitigating trade risk."
Consider some buffer points in above levels.
Please do your due diligence before trading or investment.
**Disclaimer -
I am not a SEBI registered analyst or advisor. I does not represent or endorse the accuracy or reliability of any information, conversation, or content. Stock trading is inherently risky and the users agree to assume complete and full responsibility for the outcomes of all trading decisions that they make, including but not limited to loss of capital. None of these communications should be construed as an offer to buy or sell securities, nor advice to do so. The users understands and acknowledges that there is a very high risk involved in trading securities. By using this information, the user agrees that use of this information is entirely at their own risk.
Thank you.

Smart Options Strategies1. What Makes an Options Strategy “Smart”?
A strategy becomes smart when it has:
✔ Defined Risk
You must always know the maximum loss before entering a trade. Smart strategies use spreads, hedges, and risk caps.
✔ High Probability of Profit
Instead of chasing home runs, smart traders target high-probability setups using delta, implied volatility, and data-backed levels.
✔ Edge From Volatility
Most retail traders ignore implied volatility (IV). Smart traders sell options when IV is high, and buy options when IV is low.
✔ Time Decay Advantage
Smart strategies often sell premium so theta works in your favor.
✔ Directional but Hedged
Directional trades must include some level of risk protection.
✔ Market Structure Alignment
No strategy works alone; it must match:
Trend (up, down, sideways)
Volatility environment
Support/Resistance
Momentum levels
2. Smart Strategies for Trending Markets
A. Vertical Spreads (Bull Call / Bear Put)
Vertical spreads are smart because they lower the cost, define risk, and give directional exposure with far less stress than naked options.
1. Bull Call Spread (Uptrend Strategy)
Buy ATM call
Sell OTM call
Limited risk & limited reward
Best used in steady uptrends
Why smart?: Reduces premium cost by 40–60% and controls emotions.
2. Bear Put Spread (Downtrend Strategy)
Buy ATM put
Sell OTM put
Works in controlled downtrends
Why smart?: Cheaper than naked puts and gives clear risk-reward structure.
B. Covered Call
If you own stocks and expect slow upward movement, sell OTM calls and earn a consistent income.
Why smart?:
Generates passive premium
Reduces cost basis
Safer than naked options
Ideal for long-term investors who want side income.
C. Cash-Secured Put
Selling a put at a support level
You collect premium
If assigned, you buy stock at a discount
Why smart?:
High-probability income strategy
Great for undervalued stocks
Safer than buying at market price
3. Smart Strategies for Sideways Markets
Most markets are range-bound for 60–70% of the time. Professional traders make money even in flat markets using credit spreads and range strategies.
A. Iron Condor
This is one of the smartest non-directional strategies.
Structure:
Sell OTM call spread
Sell OTM put spread
Collect premium from both sides
Your view: Market stays inside a range.
Why smart?:
High probability (70%–85%)
Neutral strategy
Benefits from theta decay
Risk is defined
Smart traders use Iron Condors in:
Low-volatility phases
Consolidation zones
Before stable events (not before major announcements)
B. Iron Butterfly
A more aggressive version of condor.
Structure:
Sell ATM straddle (call + put)
Hedge with OTM wings
Why smart?:
High premium
Tight risk box
Ideal for strong consolidations
4. Smart Strategies for High-Volatility Markets
During events like Fed meetings, India budget, RBI policy, earnings, or global chaos, IV increases sharply. Smart traders sell expensive options to exploit this.
A. Straddle Sell (Advanced)
Sell ATM call & ATM put
Best used:
Only by skilled traders during extremely stable markets or right after volatility spikes.
Why smart:
Maximum theta advantage
Profits from volatility crush
But needs:
Strict risk management
Adjustment rules
Exit discipline
B. Strangle Sell
Sell OTM call
Sell OTM put
Less risky than a straddle. Suitable when you expect market to stay within a broader range.
Why smart:
Wider profit zone
Higher probability
Uses IV crush effectively
5. Smart Strategies for Low-IV Markets
When implied volatility is very low, option premiums are cheap. Smart traders buy options or debit spreads.
A. Long Straddle
Buy ATM call
Buy ATM put
Used when you expect a big move but uncertain direction.
B. Long Strangle
Buy OTM call
Buy OTM put
Lower cost than a straddle.
Why smart?:
Best for breakout traders
Profits from volatility expansion
6. Smart Adjustments (The Secret Behind Profitable Option Traders)
Strategies alone are not smart—adjustments make them powerful.
✔ Rolling
Move options to a later expiry or better strike if wrong direction.
✔ Converting spreads
Convert naked options → spreads
Convert condor → butterfly
Convert straddle → strangle
✔ Locking gains
When one side of the trade is fully profitable, close it and keep the other side running.
✔ Hedging with futures
Smart traders hedge using Nifty/BankNifty futures when market moves aggressively.
7. Smart Strategy Selection Based on Market Conditions
Market Condition Smart Strategy
Strong Uptrend Bull Call Spread · Covered Calls · Cash Puts
Strong Downtrend Bear Put Spread · Ratio Put Spread
Sideways Market Iron Condor · Calendar Spread · Short Strangle
Volatile Market Straddle/Strangle Sell · Iron Fly · Debit Spreads
Breakouts Long Straddle · Strangle · Vertical Spreads
This is the rulebook professional traders follow.
8. Smart Greeks-Based Trading
Smart traders analyze the Greeks before executing a trade:
✔ Delta – Directional risk
Use delta to position trades according to trend.
✔ Theta – Time decay
Sell premium when theta is in your favor.
✔ Vega – Volatility sensitivity
Sell options when IV is high
Buy options when IV is low
✔ Gamma – Sensitivity to big moves
High gamma helps in long straddle/strangle during breakout phases.
9. Smart Position Sizing
Even the best strategies fail without proper money management.
Smart rules:
Risk only 1–2% of capital per trade
Avoid naked options unless experienced
Prefer spreads for controlled risk
Avoid overtrading during volatile news days
10. Smart Psychology in Options Trading
Your strategy is only 30% of success; psychology is 70%.
Smart traders:
Avoid emotional entries
Don’t chase runaway options
Close losing trades early
Avoid revenge trades
Stick to predefined rules
They understand that options trading is not about prediction—it’s about probability + discipline.
Conclusion
Smart options strategies are structured, risk-defined, volatility-aware tactics used by professional traders to maximize profits while minimizing risk. Whether you are trading trending markets, sideways markets, breakout phases, or volatile conditions, selecting the right strategy gives you a huge edge over random directional betting.
By combining:
Proper strategy selection
Volatility analysis
Greeks
Market structure
Adjustments
Psychology
you transform from a guess-based trader to a smart, systematic options trader.
Nifty Builds Momentum, Breakout Looks Within ReachThe Indian market ended last week on a positive note, supported by the stronger-than-expected performance of the National Democratic Alliance (NDA) in the 2025 Bihar elections.
Nifty jumped over 1.5% to close at 25,910, just below the key resistance level of 26,000. Volatility also eased, with the India VIX falling over 5% on a weekly basis to settle at 11.93.
Open interest data suggests that the 25,700–25,800 zone will now act as immediate support, while 25,500 remains a strong support level.
Recent price action indicates that Nifty may attempt to break above the 26,000 resistance in the coming sessions.
In the week ahead, the overall sentiment is expected to stay positive due to strong domestic cues. Globally, market direction will depend on key U.S. economic releases, including the minutes of the latest FOMC meeting.
Investors should stick to a stock-specific approach, focusing on sectors supported by domestic demand. For traders, a buy-on-dips strategy remains favourable as long as Nifty holds above its key support zones.
Stop Trying to Recover Losses. Start Trying to Build ConsistencyHello Traders!
Every trader goes through losses. But what separates a struggling trader from a successful one is not the size of their wins, it’s what they focus on after a loss.
Most traders waste months trying to “get back” the money they lost.
But the truth is simple: the more you chase recovery, the more you lose.
Your real job is not to recover losses, it’s to build consistency.
1. Loss Recovery Creates Emotional Pressure
When you trade just to recover what you lost, you stop thinking logically.
You increase lot size, enter without confirmation, and ignore your plan.
This emotional pressure makes you take trades you would never take in a calm state.
Recovery trading doesn’t fix losses, it multiplies them.
2. Consistency Has No Ego
Consistency doesn’t care about your last loss or last win.
It’s about following the same rules every day, no matter what happened yesterday.
Small, controlled wins compound over time, and slowly replace every old loss.
Consistency creates stability. Stability creates clarity. Clarity creates profits.
3. When You Stop Chasing, You Start Thinking
You no longer rush entries, you wait for your setup.
You risk only what fits your plan, not what your emotions whisper.
You accept that losses are part of your business, not threats to your ego.
A calm mind sees opportunities a stressed mind can’t.
4. The Real Recovery Happens Naturally
When your focus shifts from recovering to improving, your trades automatically become better.
Consistency makes your equity curve smoother.
Slow, steady growth quietly replaces big losses without you forcing anything.
Professional traders don’t “recover”, they simply continue.
Rahul’s Tip:
Your next breakthrough won’t come from a big winning trade, it will come from a week where you followed your plan perfectly, even if the profits were small.
Consistency is your strongest weapon in trading. Use it.
Conclusion:
Stop fighting your past losses, they’re already gone.
Focus on building the habits that ensure you never repeat them again.
Recovery is temporary. Consistency is permanent.
If this post shifted your mindset, like it, share your thoughts in comments, and follow for more honest trading psychology lessons!
#Nifty Weekly 17-11-25 to 21-11-25#Nifty Weekly 17-11-25 to 21-11-25
25200-25300 is major support 25700-26020 is the range for next week.
Option sellers can consider the above range.
If Nifty sustains above 26020, ABCD activates, targets on long side are 26150/26280.
If Nifty trades below 25700, more downside possible and targets are 25600/25500.
View: Bullish to Sideways

time cycles as a filter within technical analysis(NIFTY)Professional traders often use time cycles as a filter within technical analysis:
What are Time Cycles?
Time Cycle Analysis is a subset or specialized branch of technical analysis that focuses exclusively on the timing of market turns using recurring time intervals, rather than price patterns or indicators.
It studies when price reversals or significant moves are likely to occur, based on:
Historical time intervals between highs/lows
Fixed calendar cycles (seasonal, lunar, anniversary dates)
Mathematical cycles (Fibonacci time zones, Gann time squares, Hurst cycles)
Key Time Cycle Methods:
Method Description
Seasonality e.g., "Sell in May and go away"
Anniversary Dates Markets often reverse near dates of past major highs/lows
Fibonacci Time Zones Vertical lines at Fib intervals (1, 2, 3, 5, 8, 13, 21 days/weeks) from a swing point
Gann Time Analysis Uses squares (e.g., 90-day, 144-day cycles), angles, and dates
Hurst Cycles Identifies dominant cycle lengths (e.g., 18-week, 40-week) using spectral analysis
Goal: Predict when a reversal or acceleration might occur, regardless of price structure.
Key Difference: Time Cycles vs. Technical Analysis
Aspect Technical Analysis (Broad) Time Cycle Analysis (Narrow)
Focus Price + Volume + Patterns Time intervals only
Core Question What is the trend/pattern? When will the turn happen?
Tool sIndicators, patterns, S/R Calendar dates, Fib time, Gann squares
Predicts Direction + levels Timing of potential reversals
Standalone? Yes Usually combined with TA for confirmation
Example "RSI oversold + double bottom → buy" "90 days from March low → expect top"
Analogy:
Technical Analysis = A full GPS system (route, speed, traffic, landmarks)
Time Cycles = Just the clock on the dashboard ("We always hit traffic at 5 PM")
Best Practice: Combine Both
Professional traders often use time cycles as a filter within technical analysis:
Price at support + RSI oversold
AND: We're 144 days from the last major low (Gann cycle)
→ High-probability long setup
Summary
Technical Analysis Time Cycle Analysis
Scope Broad (price, volume, patterns) Narrow (timing only)
Predicts Direction, levels Timing of turns
Relationship Parent method Sub-branch of TA
Time Cycles ≠ Separate from TA — they are a timing tool within technical analysis.
The Herd Mentality – Why Everyone Buys When It’s Too Late?Hello Traders!
You’ve seen it a hundred times, the market rallies, social media explodes, and suddenly everyone starts buying.
Then, just when retail traders feel “safe” entering, the price crashes.
It’s not bad luck, it’s herd mentality .
And unless you understand how it works, you’ll keep following the crowd straight into losses.
1. What is Herd Mentality in Trading?
Herd mentality is the instinct to do what everyone else is doing, buying when others buy, selling when others sell.
It’s rooted in human psychology, our brains feel safer when we’re part of a group.
In trading, this instinct is deadly because the crowd always reacts late.
When you feel comfortable entering a trade, it’s usually because the market has already moved.
2. The Cycle of Fear and Greed
Every bull run begins with a few smart traders who buy quietly when no one’s interested.
As prices rise, social media hype builds, the crowd starts joining in.
Then, when “everyone” is talking about the coin, smart money exits, leaving the herd trapped at the top.
The same happens in bear markets, panic selling at bottoms while professionals buy patiently.
It’s not about intelligence, it’s about emotion.
3. How the Market Exploits the Crowd
Institutions and big traders understand herd behavior better than anyone.
They create liquidity by pushing prices to levels where retail traders feel emotionally forced to act.
The market uses human nature, fear and greed, as its fuel.
The crowd provides the liquidity, and professionals use that liquidity to enter or exit quietly.
4. How to Avoid Becoming Part of the Herd
Develop your own plan, if your entry depends on others’ excitement, it’s not your setup.
Buy when the market feels uncomfortable; sell when everyone feels confident.
Learn to think independently. The best trades usually feel the hardest to take.
Patience and conviction are your weapons against the herd.
5. The Truth Most Traders Don’t Want to Hear
If you wait for social proof to feel confident, you’ll always be late.
By the time the crowd “believes,” the move is already priced in.
You don’t get rich by following others, you get rich by understanding why others behave the way they do.
Rahul’s Tip:
The market doesn’t punish retail traders because they lack knowledge, it punishes them because they act emotionally together.
Train your mind to do what’s uncomfortable, not what’s popular. That’s where the profit hides.
Conclusion:
The herd mentality is the silent killer of most portfolios.
The more people talk about an asset, the less opportunity it holds.
Smart traders buy silence and sell noise.
Once you learn to think independently, you’ll stop being the liquidity, and start trading like the ones who create it.
If this post opened your eyes to herd psychology, like it, share your view in comments, and follow for more deep market insights!

Nifty Analysis for Nov 14, 2025Wrap-up:
Nifty has formed a impulsive pattern and internal wave 5 of internal wave b has been treated as completed once nifty breaks 25746.
What I’m Watching for Nov 14, 2025 🔍
I’ll be watching for the market to break 38.2% level i.e. 25746; thereafter short nifty below 25685 for a target of 25580-25150 SL 25870 (SL on 15 min. candle close).
Disclaimer: Sharing my personal market view — only for educational purpose not financial advice.

Nifty we can sse new ATH next week buy on dip next week 17 nov🔑 Key Highlights
- Price Action: Nifty is holding above the ₹25,900 mark, showing resilience.
- Trend: Active Long Build‑Up confirmed.
- Supports: ₹25,850 / ₹25,700 / ₹25,500.
- Resistances: ₹25,950 / ₹26,100 / ₹26,250.
- Bias: Bullish continuation if above ₹25,850; corrective pullback risk below ₹25,700.

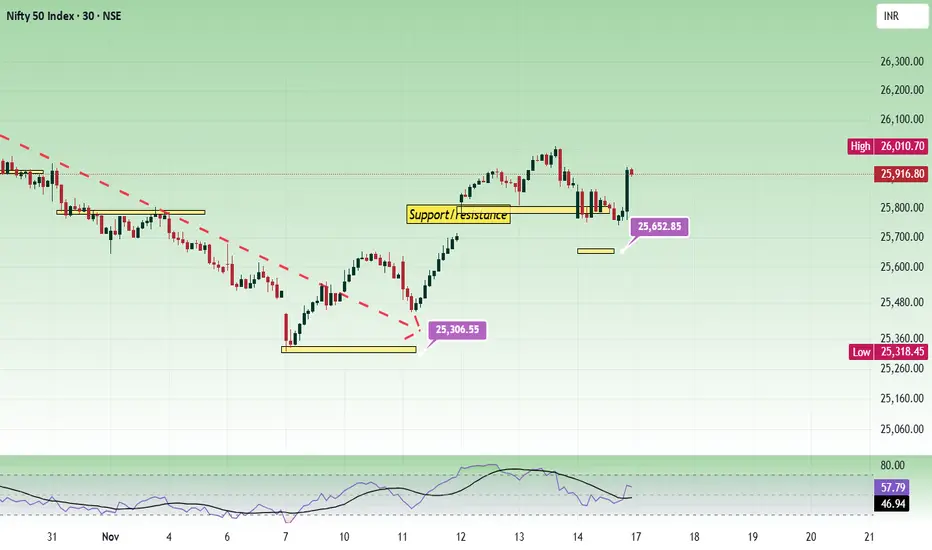
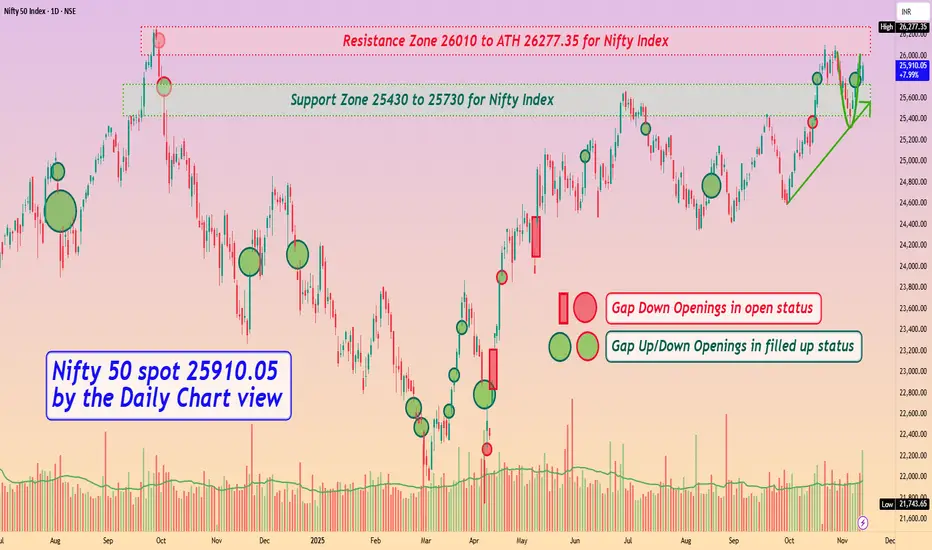
Nifty 50 spot 25910.05 by Daily Chart view - Weekly UpdateNifty 50 spot 25910.05 by Daily Chart view - Weekly Update
- Support Zone 25430 to 25730 for Nifty Index
- Resistance Zone 26010 to ATH 26277.35 for Nifty Index
- Rising Support Trendline seems respected by weekly positive closure
- Rounding Bottom Bullish momentum by Resistance Zone neckline seems sustained
- Nifty timidly shy from creating a New Lifetime High by crossing ATH final hurdle remains effectively elusive
Classic Case of Priced In Optimism & Intraday Liquidity TrapThe market’s behaviour on the Bihar election result day followed a pattern that repeats itself almost every time political outcomes are broadly expected. By the time counting began in the morning, the market had already made its real move. The rally from the 25,350 zone to the 26,000 area in the previous sessions had priced in the possibility of political continuity. Exit polls and early sentiment didn’t leave much room for a fresh surprise, and because of that, the result day itself turned out to be a range-bound session instead of a trend day.
The 5-minute chart shows exactly how the trap formed. The index opened firm, pushed towards 26,000, and immediately met selling pressure. Traders who entered on the assumption that a clear political mandate would trigger a one-way rally were trapped right at the open. Through the middle of the session, the market drifted back into a narrow band, forming lower highs and repeatedly slipping toward the 25,750 support. This is typical behaviour when a major event gets fully discounted before the actual announcement. Without fresh triggers, the market simply rotated around intraday liquidity.
Global cues didn’t help either. Asian markets were soft, risk sentiment was weak, and domestic buying lacked strength. Even with a favourable political outcome, the backdrop wasn’t strong enough to push the index beyond the 26,000 supply zone. This created a clean intraday squeeze: optimism at the open, hesitation through the day, and then a sharp reversal in the last half-hour.
The late spike—more than 100 points in a single 5-minute candle around 3 PM—was largely mechanical. It had the signature of short-covering, expiry-related adjustment, and institutional book-closing rather than genuine trend buying. Moves like this usually appear when intraday shorts square off and larger players rebalance their positions into the close.
The higher timeframe tells the same story. On the 1-hour chart, the index had already hit resistance earlier, and each attempt near 26,000 was met with supply. The trend remains intact on the broader scale, but momentum clearly slowed down once the market realised that the result did not introduce any new variable—it simply confirmed what was already anticipated.
Overall, this session was a textbook example of how markets behave when the news is entirely expected. The initial reaction pulls in emotional traders, the mid-day choppiness shakes out both sides, and the final burst is more about positioning than sentiment. Until Nifty closes decisively above 26,050 on strong breadth, the index is likely to stay in a sideways-to-cautious zone with support near 25,750.
In short, the market didn’t rally because there was nothing new to rally about. The optimism was already embedded in the previous move, and the result day turned into a classic liquidity trap rather than a directional breakout.

Nifty Intraday Analysis for 14th November 2025NSE:NIFTY
Index has resistance near 26100 – 26150 range and if index crosses and sustains above this level then may reach near 26300 – 26350 range.
Nifty has immediate support near 25700 – 25650 range and if this support is broken then index may tank near 25500 – 25550 range.
Learn Candle PatternsCandlestick patterns are one of the most important tools in technical analysis, used by traders around the world to understand market psychology, predict price movement, and identify buying or selling opportunities. Each candle on the chart tells a story—who is in control (bulls or bears), the strength of the price move, and the potential reversal or continuation of the trend. When combined into patterns, candlesticks offer powerful signals that help traders make better decisions.
A single candlestick is made of four data points: open, high, low, and close. The body represents the open-to-close range, while wicks (shadows) show the highs and lows. Bullish candles generally close above the open, and bearish candles close below the open. Understanding this basic structure is essential before analyzing patterns.
Candlestick patterns are broadly categorized into reversal patterns and continuation patterns. Reversal patterns indicate a potential change in trend, while continuation patterns suggest the existing trend is likely to continue. These patterns can be single-candle, double-candle, or multi-candle formations.
