Copper : Bullish we are in the either 4th wave or 5th wave has already started which will lead the prices for higher side
key level 5.4000

Copper : expecting another 5th wave on the upsideKey level : 5.5600
we are still on B wave of higher degree which will take prices to higher zone
if prices goes below key level, then we will switch to bearish scenario

COPPER (USD): Approaching Channel Top – Wave 5 PeakTicker: COPPER Timeframe: Weekly (1W)
Key Observations
1. Wave Structure
The price action is bullish, creating higher highs and higher lows within a clearly defined channel.
We are approaching the upper boundary of this multi-year structure.
2. Key Resistance Zones
$5.54 - $5.73: This is the cr

REVERSAL IN COPPER?
Sell Call on Copper
Copper has formed a clear rejection near the 5.10–5.17 zone after an extended upside move. The price is struggling to sustain above the recent breakout area, indicating that the rally may have exhausted in the short term.
Volumes on the recent candles show distribution, and t

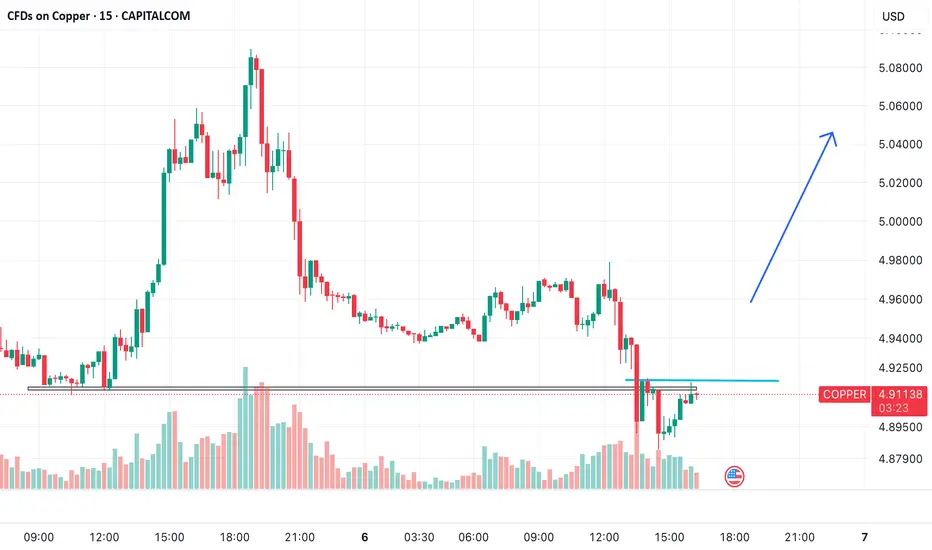
Let’s Ride the Copper Rebound!
Current Price: $4.912
Direction: BUY
Technical Justification:
• Support Reclaim: Price has bounced off a previously respected horizontal support zone (around $4.89–$4.90), forming a potential double bottom.
• Volume Confirmation: Buying volume is increasing near the support zone—an early signal
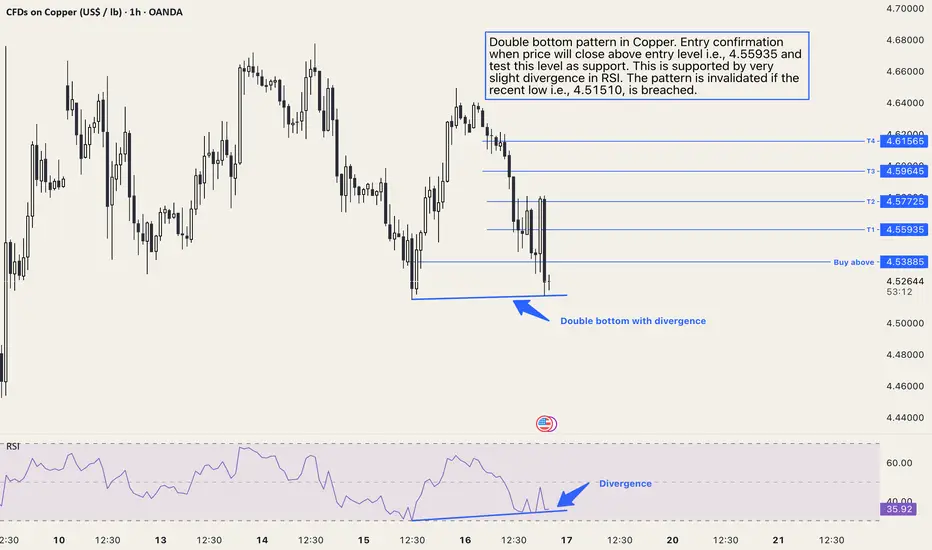
Copper XCUUSD: Double Bottom PatternDouble bottom pattern in Copper. Entry confirmation when price will close above entry level, i.e., 4.55935 and test this level as support. This is supported by a very slight divergence in RSI. The pattern is invalidated if the recent low, i.e., 4.51510, is breached.
The targets are shared on the cha
International CopperThere might be a super rush in all base metals and commodities after this breakout happens
Load up on Industrial metals more than base metals and noble metals

Bearish on Copper - Weekly and Daily viewOn Weekly, The price is trading in a channel/range and looks like it is headed towards the bottom of the channel
On daily, price is displaying corrective structure ABC.
My view: Although it looks like taking support at the trendline on daily, it coud potentially break and go down below.
I am

Copper buying opportunity After striking resistance multiples times price broke the resistance , now the previous resistance will become support

Long Copper Hi everyone, Hope you are having a good day.
Let'sdiscuss the trade idea on copper. I use a volatility contraction pattern which is given by Mark Minervini.
I believe before every explosion, there is a contraction or what i better know it as "silence"
Obviously we have to take all the other thin

See all ideas
Displays a symbol's price movements over previous years to identify recurring trends.