Carbon Credit and ESG Trading: A New Era of Sustainable Finance1. Understanding Carbon Credits
A carbon credit represents a permit that allows a company or organization to emit a certain amount of carbon dioxide (CO₂) or other greenhouse gases (GHGs). Typically, one carbon credit equals one metric ton of CO₂ equivalent (CO₂e). The concept emerged from the Kyoto Protocol (1997) and was further refined under the Paris Agreement (2015), both of which aimed to create global mechanisms to reduce emissions.
There are two primary carbon markets:
Compliance Markets: These are regulated by governments or international bodies. Entities are assigned emission caps, and if they exceed them, they must buy carbon credits from others who have reduced emissions below their limits.
Example: The European Union Emissions Trading System (EU ETS) is the world’s largest compliance carbon market.
Voluntary Markets: Here, companies or individuals purchase carbon credits voluntarily to offset their emissions, even if they are not mandated to do so.
Example: A corporation may offset its air travel emissions by investing in reforestation or renewable energy projects.
2. How Carbon Credit Trading Works
The carbon trading system operates under a “cap-and-trade” model:
Cap Setting: A governing body sets a limit (cap) on the total emissions allowed within a specific sector or region.
Allocation: Companies receive or purchase emission allowances.
Trading: Firms that emit less than their allowance can sell their surplus credits to others who exceed their limits.
Verification: Independent auditors verify emission reductions to ensure integrity and transparency.
This market-based approach incentivizes companies to invest in cleaner technologies, as reducing emissions can generate tradable credits and financial rewards.
3. Economic and Environmental Impact
Carbon trading creates an economic value for emission reductions, encouraging innovation in renewable energy, energy efficiency, and carbon capture. It aligns business incentives with environmental outcomes. By putting a price on carbon, it makes pollution a financial liability rather than an external cost.
Globally, the carbon market is expanding rapidly. The EU ETS, China’s National ETS, and California’s Cap-and-Trade Program together cover billions of tons of CO₂ annually. The voluntary carbon market also reached record highs, driven by corporate net-zero commitments and growing environmental awareness among consumers.
4. Challenges in Carbon Trading
Despite its promise, carbon trading faces challenges:
Lack of Standardization: Different countries and organizations follow varied methodologies for measuring and verifying carbon credits.
Greenwashing: Some companies use carbon offsets to appear sustainable without making real emission reductions.
Price Volatility: Carbon credit prices fluctuate due to regulatory changes and market sentiment.
Double Counting: Ensuring that emission reductions are not claimed by multiple parties remains a key concern.
To enhance credibility, organizations like Verra (VCS), Gold Standard, and Climate Action Reserve have established verification frameworks to certify carbon projects and improve transparency.
5. Introduction to ESG Trading
ESG trading refers to the practice of integrating environmental, social, and governance factors into investment decisions and portfolio management. ESG metrics assess how responsibly a company operates and how sustainable its business practices are in the long term.
Environmental factors include carbon emissions, renewable energy use, waste management, and resource conservation.
Social factors cover labor practices, human rights, diversity, and community impact.
Governance factors focus on corporate ethics, board structure, transparency, and compliance.
Investors increasingly view ESG performance as a proxy for risk management and long-term resilience, rather than mere philanthropy.
6. ESG Investing and Market Growth
ESG investing has grown exponentially over the past decade. Global ESG assets surpassed $40 trillion by 2025, reflecting a major shift in capital allocation. Institutional investors, sovereign wealth funds, and retail traders alike are demanding greater accountability and disclosure from companies.
Financial products linked to ESG include:
Green Bonds: Debt instruments financing environmentally friendly projects.
Sustainability-linked Loans: Interest rates tied to ESG performance targets.
ESG ETFs and Mutual Funds: Funds that invest in companies with strong ESG ratings.
Stock exchanges worldwide—such as the London Stock Exchange, Singapore Exchange, and Bombay Stock Exchange (BSE)—now require listed companies to disclose ESG data, ensuring transparency and comparability.
7. Carbon Credit and ESG Trading: The Connection
Carbon credit trading and ESG investing intersect in several ways:
Environmental Metrics: Carbon reduction is a key “E” metric in ESG scoring. Companies active in carbon markets often score higher on environmental performance.
Financial Innovation: ESG funds are increasingly integrating carbon offset credits into their portfolios or partnering with projects that generate verified credits.
Corporate Strategy: Firms that trade or retire carbon credits to offset emissions can strengthen their ESG profiles, attracting sustainable investors.
In essence, carbon trading contributes to quantifiable ESG outcomes, helping corporations demonstrate tangible progress toward net-zero goals.
8. Technological Advancements in Carbon and ESG Markets
Emerging technologies are transforming both carbon and ESG trading:
Blockchain: Ensures transparency and traceability in carbon credit issuance and trading, preventing fraud or double-counting.
AI and Data Analytics: Improve ESG scoring by analyzing vast datasets from sustainability reports, satellite imagery, and social media.
Tokenization: Digital carbon credits (like KlimaDAO and Toucan Protocol) are creating decentralized carbon markets, enabling small investors to participate.
Such innovations enhance accessibility, liquidity, and trust—key pillars for scaling sustainable finance.
9. Global Policy and Regulation
Governments and regulators are increasingly aligning policies to support carbon and ESG markets:
The Paris Agreement (2015) commits nations to limit global warming to below 2°C.
The Task Force on Climate-related Financial Disclosures (TCFD) promotes standardized climate reporting.
The EU Taxonomy defines what qualifies as a sustainable activity, guiding ESG investors.
India’s Perform, Achieve, and Trade (PAT) scheme and Carbon Credit Trading Scheme (CCTS) are local examples encouraging carbon efficiency.
As climate risks become financial risks, central banks and regulators are integrating sustainability criteria into their frameworks.
10. The Future of Carbon and ESG Trading
The future points toward convergence—where carbon markets and ESG frameworks reinforce each other to drive a sustainable economy. Companies with strong ESG credentials will have better access to carbon finance, and carbon-neutral portfolios will become mainstream.
Looking ahead, the focus will shift from offsetting emissions to reducing them at the source. Investors will increasingly demand measurable impact and verified sustainability data, making transparency a competitive advantage. Carbon credit prices are expected to rise as governments tighten emission caps, creating both opportunities and risks for traders and corporations.
Conclusion
Carbon credit and ESG trading represent the twin engines of sustainable capitalism. While carbon credits place a tangible price on environmental impact, ESG trading embeds sustainability into the financial DNA of markets. Together, they redefine how companies measure success—not merely in profit, but in purpose.
As the global economy moves toward decarbonization, those who integrate carbon efficiency and ESG principles early will not only protect the planet but also unlock new financial value in the green economy of the future.
Trade ideas

Commodities & MCX Gold-Silver Trading: A Complete Guide1. Introduction to Commodity Markets
Commodities have been the backbone of trade for centuries. They represent raw materials or primary agricultural products that can be bought, sold, and exchanged. Commodity markets are essential because they provide a platform for producers, consumers, and investors to manage price risks, discover prices transparently, and facilitate investment opportunities.
Globally, commodities are divided into two main types:
Hard Commodities – Naturally mined resources like gold, silver, crude oil, and copper.
Soft Commodities – Agricultural products such as wheat, coffee, sugar, and cotton.
In India, the commodities market has evolved significantly, moving from physical trade in traditional markets to electronic platforms where futures contracts are traded. Among these, gold and silver have gained prominence due to their dual role as both an investment asset and a hedge against inflation.
2. Evolution of Commodity Trading Globally & in India
Commodity trading has a long history, dating back to ancient civilizations where merchants and farmers would trade goods in local bazaars. In the modern era, commodity exchanges were established in Europe and the United States to provide standardization, transparency, and regulated trading.
In India, organized commodity trading began in the 19th century with local exchanges, but it gained structure with the Multi Commodity Exchange (MCX) in 2003. The MCX enabled electronic trading, introduced standardized contracts, and attracted institutional and retail investors alike. Today, India has several commodity exchanges, but MCX remains the most popular platform for trading gold, silver, and other metals.
3. What is MCX (Multi Commodity Exchange)?
The Multi Commodity Exchange of India (MCX) is India’s largest commodity derivatives exchange. It provides a regulated platform for trading futures contracts in metals, energy, and agricultural commodities. MCX’s key features include:
Transparency: Real-time prices are displayed, ensuring price discovery.
Liquidity: High trading volume allows investors to enter and exit positions efficiently.
Standardization: Contracts have defined lot sizes, expiry dates, and quality specifications.
Risk Management: Use of margins and clearing mechanisms protects both buyers and sellers.
MCX has become a gateway for both domestic and global traders to participate in India’s commodities market, particularly in precious metals like gold and silver.
4. Gold & Silver as Commodities
Gold and silver are unique commodities. They are not just raw materials but also financial assets. Globally, they are recognized as stores of value and act as hedges during times of economic uncertainty.
Gold: Primarily used in jewelry, electronics, and as an investment instrument. Central banks also hold gold reserves as a financial security measure.
Silver: Used in industrial applications (electronics, solar panels, medical instruments) and jewelry. Silver is more volatile than gold due to its dual role as both an industrial metal and a store of value.
The prices of these metals are influenced by global demand-supply dynamics, currency movements, interest rates, and geopolitical events.
5. Factors Driving Gold & Silver Prices
Several factors impact gold and silver prices in the MCX market:
Global Economic Conditions: During economic uncertainty, gold and silver attract investors as safe-haven assets.
US Dollar Strength: Gold and silver are priced in USD globally; a strong dollar often depresses their prices.
Inflation: Precious metals act as a hedge against inflation, driving demand during rising price levels.
Interest Rates: Higher interest rates make non-yielding assets like gold less attractive.
Industrial Demand: Silver prices are more sensitive to industrial usage compared to gold.
Geopolitical Tensions: Conflicts and crises boost demand for safe-haven metals.
6. Gold-Silver Ratio in Trading
The gold-silver ratio represents the amount of silver needed to buy one ounce of gold. It is a key tool for traders:
High ratio: Indicates silver is undervalued relative to gold, potentially a buying opportunity.
Low ratio: Suggests silver is expensive relative to gold, signaling a potential sell or hedge.
MCX traders often use this ratio to make pair trades, hedging one metal against the other to minimize risk while capitalizing on market trends.
7. How MCX Gold & Silver Contracts Work
MCX offers futures contracts for gold and silver. A futures contract is an agreement to buy or sell a specified quantity of metal at a predetermined price on a future date.
Gold Contracts: Standard lot sizes of 1 kg.
Silver Contracts: Standard lot sizes of 30 kg.
Contracts are traded electronically on MCX, and prices fluctuate based on market demand, global metal prices, and domestic factors.
8. Trading Mechanisms (Spot vs Futures)
There are two main trading methods in gold and silver:
Spot Market: Immediate delivery of physical gold/silver at current market price. Mostly used by jewelers and industrial buyers.
Futures Market: Traders speculate on future price movements without owning physical metals. Futures are more popular among investors seeking leverage and hedging opportunities.
MCX focuses on futures trading, allowing participants to profit from both rising and falling markets through buying (long) or selling (short) positions.
9. Risks & Challenges in Commodities Trading
While gold and silver trading is lucrative, it carries risks:
Market Volatility: Precious metal prices can swing sharply.
Leverage Risk: High margins amplify both gains and losses.
Liquidity Risk: Less liquid contracts may be harder to exit at desired prices.
Regulatory Risk: Changes in taxation, import duties, or trading rules can affect profits.
Global Dependence: Prices are influenced by global events beyond domestic control.
Risk management through stop-loss orders, position sizing, and diversification is essential for MCX traders.
10. Conclusion
Gold and silver trading on MCX represents a dynamic intersection of investment, speculation, and hedging. These metals are not just financial instruments but are deeply intertwined with global economic conditions, currency movements, and geopolitical developments.
By understanding contract specifications, trading mechanisms, price drivers, and risk management, traders can navigate the complex world of MCX commodities effectively. While risks exist, disciplined trading strategies, combined with global insights, can make gold and silver futures a profitable and rewarding venture for both retail and institutional investors.
MCX gold and silver trading is more than just buying and selling; it is an art of balancing global insights, domestic trends, and personal risk appetite, making it one of the most engaging markets in India’s financial ecosystem.
India’s Growing Derivatives Market & Weekly Expiries1. Introduction
Financial markets act as the lifeblood of an economy, channelizing savings into productive investments. Within these markets, derivatives have emerged as a vital instrument for managing risk, enhancing liquidity, and providing opportunities for speculation and arbitrage. India, which once lagged behind developed economies in terms of derivatives trading, has today become one of the most vibrant derivative markets in the world.
A unique feature of India’s equity derivatives market is the introduction of weekly expiries, which has not only boosted participation but also changed trading patterns significantly. Weekly options, in particular, have become extremely popular, contributing to record-breaking turnover in Indian exchanges.
This essay explores the growth of India’s derivatives market, the mechanics of weekly expiries, their impact on market behavior, and what lies ahead for India in the global derivatives landscape.
2. Understanding Derivatives
Derivatives are financial contracts whose value is derived from an underlying asset such as equities, indices, commodities, currencies, or interest rates. The main types of derivatives include:
Futures – Contracts obligating the buyer to purchase or the seller to sell an asset at a future date at a predetermined price.
Options – Contracts that give the buyer the right, but not the obligation, to buy (Call) or sell (Put) the underlying asset at a set price before or on expiration.
Swaps – Agreements to exchange cash flows or other financial instruments, often linked to interest rates or currencies.
Forwards – Customized contracts similar to futures but traded over-the-counter (OTC).
Derivatives are used for:
Hedging risk against adverse price movements.
Speculation to profit from price volatility.
Arbitrage opportunities from price discrepancies across markets.
In India, the primary focus has been on exchange-traded derivatives, particularly index futures, stock futures, index options, and stock options.
3. Historical Evolution of Derivatives in India
The Indian derivatives market has grown in phases:
Pre-2000s: Derivatives trading was virtually non-existent, with forward contracts and informal hedging practices dominating.
2000: NSE introduced index futures, followed by stock futures and options. This marked the formal beginning of exchange-traded derivatives.
2001-2010: Rapid growth with increasing investor participation. Index options gained popularity, especially on Nifty 50.
2010-2015: Introduction of new products, including currency derivatives and commodity derivatives, deepened the market.
2016-Present: Weekly options expiries on Bank Nifty (later Nifty and FINNIFTY) fueled a new wave of retail and institutional interest.
Today, India ranks among the largest derivatives markets globally in terms of contracts traded, with a massive rise in retail participation driven by technology, mobile trading, and lower transaction costs.
4. Structure of India’s Derivatives Market
Key Exchanges
National Stock Exchange (NSE): Dominates equity derivatives trading with over 90% market share.
Bombay Stock Exchange (BSE): A smaller share but gaining traction through products like Sensex options.
MCX & NCDEX: Commodity derivatives platforms.
Key Products
Index Derivatives: Nifty 50, Bank Nifty, and FINNIFTY options are the most liquid.
Stock Derivatives: Futures and options on large-cap and mid-cap stocks.
Currency Derivatives: Dollar-Rupee and other currency pairs.
Commodity Derivatives: Gold, crude oil, agri commodities, etc.
Participants
Retail traders (rapidly growing, especially in weekly options).
Institutional investors (mutual funds, FIIs, insurance companies).
Hedgers (corporates and banks).
Speculators & arbitrageurs (seeking short-term opportunities).
5. Weekly Expiries in India: The Game Changer
What are Weekly Expiries?
Traditionally, derivatives contracts had monthly expiries. For example, Nifty options would expire on the last Thursday of every month. However, NSE introduced weekly expiries in 2016 for Bank Nifty options, later extending to Nifty 50 and FINNIFTY.
Bank Nifty Options: Expire every Thursday.
Nifty Options: Expire every Thursday (with monthly still available).
FINNIFTY Options: Expire every Tuesday.
Sensex Options (BSE): Expire every Friday.
This means traders now have contracts expiring almost every day of the week, providing more flexibility and opportunities.
Why Weekly Options Became Popular?
Low Premiums: Since weekly options have a shorter time to expiry, they trade cheaper, attracting retail traders.
Quick Turnover: Traders don’t have to wait an entire month; they can capture short-term moves.
High Liquidity: Bank Nifty and Nifty weekly options see some of the highest daily turnover in the world.
Speculative Opportunities: High leverage and volatility near expiry days create big profit (and loss) potential.
Hedging Short-Term Events: Earnings announcements, policy decisions, and global events can be hedged with weekly contracts.
6. Impact of Weekly Expiries on Indian Markets
Positive Impacts
Liquidity Surge: Weekly expiries brought unprecedented liquidity to Indian options markets.
Retail Participation: The affordability of weekly premiums made derivatives accessible to small traders.
Revenue for Exchanges: Explosive growth in contracts traded significantly increased exchange turnover.
Efficient Hedging: Corporates and institutions can hedge short-term risks more precisely.
Negative Impacts
Rise in Speculation: Retail traders often take excessive risks, leading to high losses.
Increased Volatility on Expiry Days: Option writers adjust positions aggressively near expiries, causing intraday swings.
Behavioral Issues: Many retail traders view weekly options as “lottery tickets,” leading to unhealthy trading habits.
Conclusion
India’s derivatives market has transformed from a fledgling sector in the early 2000s into a global leader in contract volumes. The introduction of weekly expiries revolutionized participation, making derivatives more accessible, liquid, and event-driven.
While weekly options have opened doors for small traders, they also bring higher risks due to speculation, volatility, and leverage. For India, the challenge lies in nurturing this growth while safeguarding investors through education, regulation, and innovation.
If managed well, India’s derivatives ecosystem will not only support domestic financial stability but also position the country as a leading hub for global derivatives trading.
Stock Market is in Risk OnThe US market, as well as some assets, is in a risk-on mode.
Most assets have their own seasonality.
The chart above shows one of them:
In recent years, in the period July-September, a correction began on the US market.
A number of macro indicators also speak in favor of a correction and that it is overdue.
Risk appetite according to Morgan Stanley research has reached a historical maximum
Although seasonality does not guarantee a correction right here and now, but at least it gives reason to think about reducing long positions

Global Macro Factors in TradingIntroduction
Trading is not just about charts, patterns, or company earnings—it’s also about understanding the bigger picture. This bigger picture is shaped by global macroeconomic factors that influence the flow of money across countries, sectors, and asset classes.
A trader who ignores global macro factors risks missing the underlying forces driving market trends. On the other hand, traders who integrate macroeconomic analysis into their strategies can often anticipate market shifts before they appear on technical charts.
In this deep dive, we’ll explore what global macro factors are, why they matter, how they affect different asset classes, and how traders can practically use them in their decision-making.
What are Global Macro Factors?
Global macro factors are large-scale economic, political, and social conditions that impact the performance of financial markets worldwide. They include:
Economic growth cycles (GDP, industrial output, unemployment)
Inflation and deflation trends
Interest rates and monetary policy
Government fiscal policies
Global trade dynamics (exports, imports, tariffs, supply chains)
Geopolitical risks (wars, elections, sanctions, political instability)
Commodities and energy prices (oil, gas, metals, agriculture)
Currency exchange rates
Technological disruptions & structural shifts
Climate change and sustainability policies
These factors drive cross-border capital flows, influence investor sentiment, and dictate the performance of stocks, bonds, commodities, and currencies.
Why Global Macro Factors Matter for Traders
They Move Markets More Than Company News
For example, if the U.S. Federal Reserve raises interest rates sharply, the Indian stock market might fall—even if Indian companies are performing well—because global capital exits riskier emerging markets.
They Explain Market Trends
Sometimes markets rise or fall without obvious technical reasons. Looking at macro data (like inflation, global interest rates, or oil prices) often reveals the underlying cause.
They Help in Asset Allocation
A trader who knows that inflation is rising globally may prefer commodity trading (gold, silver, crude) over growth stocks.
They Reduce Trading Risk
Anticipating macro shocks—such as a recession, a currency crisis, or a geopolitical conflict—helps traders manage risk better.
Key Global Macro Factors in Detail
Let’s go through the most important ones, with trading implications.
1. Economic Growth Cycles (GDP Trends)
What it means:
Gross Domestic Product (GDP) is the main indicator of economic health. High GDP growth attracts foreign investments, boosts corporate profits, and supports strong stock market performance. Slow growth or contraction signals recession.
Impact on Trading:
When global growth is strong → equities, emerging markets, and cyclical sectors (automobiles, banking, infrastructure) perform well.
When growth slows → safe-haven assets like gold, U.S. Treasuries, and defensive sectors (pharma, FMCG) gain.
Example:
In 2020, when the world economy went into lockdown, GDP collapsed globally. Stock markets initially crashed, but later surged when governments and central banks provided massive stimulus, betting on a V-shaped recovery.
2. Inflation & Deflation
What it means:
Inflation is the rise in prices of goods and services. Controlled inflation is good—it indicates demand. But runaway inflation hurts purchasing power. Deflation, the opposite, signals weak demand and economic stagnation.
Impact on Trading:
High inflation → central banks raise interest rates, stock markets fall, bond yields rise. Commodities like gold and oil rally.
Low inflation/deflation → central banks cut rates, boosting equity markets.
Example:
In 2022, global inflation spiked due to supply chain disruptions and the Russia-Ukraine war. Central banks raised rates aggressively, causing sharp declines in tech and growth stocks while energy companies benefited.
3. Interest Rates & Monetary Policy
What it means:
Central banks like the U.S. Federal Reserve, ECB, or RBI control monetary policy—deciding interest rates and liquidity. Interest rates directly affect borrowing costs, investments, and asset valuations.
Impact on Trading:
Rising rates → bearish for stocks (especially tech), bullish for bonds and the U.S. dollar.
Falling rates → bullish for equities and commodities, bearish for the dollar.
Example:
In 2023–2024, markets closely tracked the Fed’s decisions. Whenever the Fed hinted at slowing down rate hikes, global stock markets rallied.
4. Fiscal Policy & Government Spending
What it means:
Governments influence markets through budgets, taxation, subsidies, and spending programs. Fiscal stimulus can boost markets, while austerity can slow them.
Impact on Trading:
Infrastructure spending → benefits construction, cement, steel stocks.
Tax cuts → boost corporate profits and consumer spending.
Subsidies/removals → affect agriculture, energy, and renewable stocks.
Example:
India’s Union Budget announcements often cause sectoral rallies—defense allocations push defense stocks up, while higher infrastructure spending boosts capital goods.
5. Global Trade & Supply Chains
What it means:
Globalization ties economies together. Exports, imports, tariffs, sanctions, and supply chain disruptions influence asset prices.
Impact on Trading:
Trade wars or tariffs → hurt global growth and export-driven stocks.
Strong global trade → boosts commodities and shipping sectors.
Supply chain disruptions → create inflation and shortages (e.g., semiconductors in 2021).
Example:
The U.S.-China trade war in 2018 caused volatility in technology and industrial stocks worldwide.
6. Geopolitical Risks
What it means:
Wars, sanctions, elections, and political instability affect global investor sentiment.
Impact on Trading:
Rising geopolitical tensions → bullish for gold, oil, U.S. dollar (safe havens).
Stable geopolitics → bullish for equities and emerging markets.
Example:
The Russia-Ukraine war in 2022 caused oil and gas prices to spike, benefiting energy companies but hurting global equity markets.
7. Commodities & Energy Prices
What it means:
Oil, natural gas, metals, and agricultural commodities drive costs across industries.
Impact on Trading:
Rising oil → hurts airline, transport, and manufacturing stocks. Benefits energy producers.
Rising gold/silver → signals investor risk aversion.
Agricultural prices → affect FMCG and food companies.
Example:
When crude oil rose above $100 per barrel in 2022, airline stocks crashed while oil & gas companies rallied.
8. Currency Exchange Rates
What it means:
Currencies reflect economic health, capital flows, and interest rate differentials.
Impact on Trading:
Strong USD → hurts emerging markets, commodity prices fall.
Weak USD → boosts gold, commodities, and EM equities.
Currency depreciation → benefits exporters but hurts importers.
Example:
In 2022, the U.S. dollar index hit a 20-year high. This pressured Indian equities as foreign investors pulled money out, and crude oil imports became costlier for India.
9. Technological Disruptions
What it means:
Innovation (AI, blockchain, EVs, renewable energy) shifts capital allocation.
Impact on Trading:
New tech adoption → boosts related sectors (AI → IT companies, EV → battery makers).
Old industries → may lose capital (oil majors losing to renewables).
Example:
AI-driven rallies in 2023–2024 saw tech giants like Nvidia and Microsoft outperform global markets.
10. Climate Change & ESG Policies
What it means:
Sustainability and environmental regulations now influence capital flows.
Impact on Trading:
ESG-focused funds avoid polluting industries.
Renewable energy, EV, and green tech companies benefit.
Carbon taxes and environmental restrictions increase costs for traditional industries.
Example:
Europe’s carbon neutrality push boosted renewable energy companies while hurting coal producers.
How Global Macro Factors Affect Different Asset Classes
Equities (Stocks)
Bull markets when growth, low inflation, and easy money align.
Bear markets during recessions, high inflation, or geopolitical shocks.
Bonds
Bond prices rise when interest rates fall.
Inflation erodes bond returns.
Commodities
Rise in inflation and geopolitical risks → commodity bull runs.
Strong dollar usually weakens commodities.
Currencies (Forex)
Driven by interest rates, trade balances, and capital flows.
Safe-haven currencies (USD, CHF, JPY) rise during crises.
Crypto Assets
Sensitive to liquidity conditions and global risk sentiment.
Perform better during easy monetary policy and risk-on environments.
Conclusion
Global macro factors are the invisible strings that pull the markets in different directions. They influence whether money flows into equities, commodities, bonds, or currencies.
For traders, the ability to combine macro awareness with technical analysis is a powerful edge. It helps anticipate large market moves, align trades with the broader economic cycle, and reduce risk exposure.
In today’s interconnected world, no market operates in isolation. Understanding GDP trends, inflation, interest rates, currency shifts, and geopolitical developments is essential to surviving and thriving as a trader.
Option Trading : Options trading gives you the right or obligation to buy or sell a specific security on or by a specific date at a specific price. An option is a contract that's linked to an underlying asset, such as a stock or another security.

PCR (Put and Call Ratio) TradingThe Put-Call Ratio (PCR) is a technical indicator that measures the relative volume of put options to call options in a specific timeframe. It's used to gauge overall market sentiment, with a higher PCR indicating more bearish sentiment and a lower PCR suggesting more bullish sentiment.

SPDT S&P 500 TRUST analysis for today 17 April 2025Break down below 524.5
Targets will follow as
522
518
I provide analysis for intraday for option traders. Follow me.

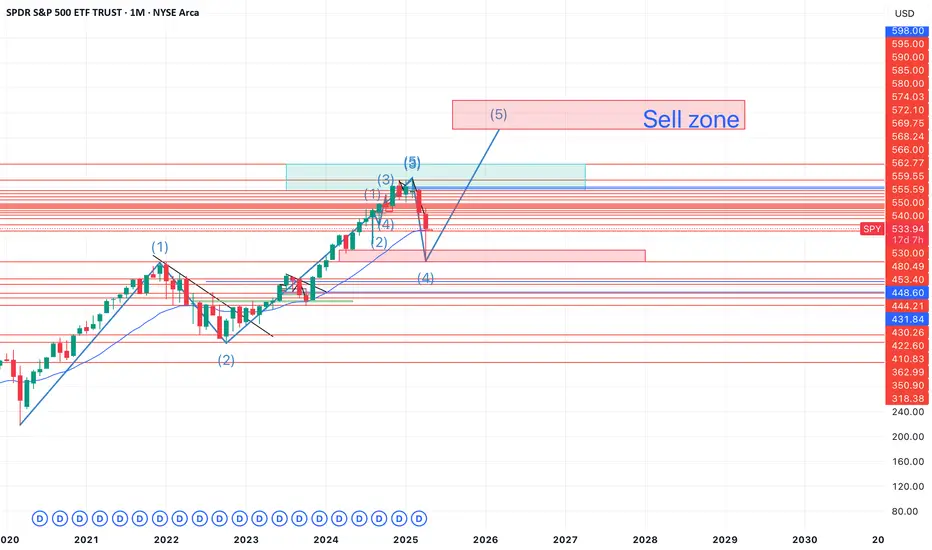
SPY wave 5 on monthlyIf SPY sustains above 480 on monthly close, we can consider it as end of wave 4 and the beginning of wave 5. 640 will act as a resistance and once 640 is broken, SPY target would be 695-740 zone where SPY will complete its wave structure. The move from 640 to 700 is most likely retail fomo. Good zone for booking short term profits and for the stocks bought at end of wave 4
VISUAL INVESTOR: An Investing Tutorial for EveryoneToday is a wonderful day! I am overwhelmed with positive emotions, like a racer who has crossed the finish line. My first book, The Visual Investor, is out on TradingView. It's written for everyone, from those just starting out in the stock market to experienced investors. You could say you're holding it in your hands now.
The idea for this book came to me a long time ago, thanks to the influence of one person, as well as my invisible teachers: Benjamin Graham, Warren Buffett, Charles Munger, Peter Lynch and Mohnish Pabrai. Day after day, I worked on the content of chapters, charts, tables, and drawings to take you from theoretical foundations to applied knowledge that allows you to answer the key questions of any investor: What? When? And how much?
My motivators, namely you, dear subscribers and the TradingView editorial team, also made an invaluable contribution to the creation of this book. Every kind word, constructive criticism and award in the form of “Editors’ Picks” made me happier and helped me to create further.
Why “Visual Investor”? This is my reverence for the technologies we have come to now. The modern investor has incredible opportunities compared to our colleagues, even from the beginning of the 21st century. Access to companies' financial data has become an order of magnitude easier, and their visualization allows for fundamental analysis to be done much faster than before.
Global financial centers are now much closer to investors from different countries, thanks to the development of local regulation, active work of financial institutions and services. All this has expanded the range of investment instruments and formed a new way of life for our savings.
A modern person may not be a passive observer of fluctuations in the purchasing power of his own capital. On the contrary, he can independently make decisions to increase this capacity, using technology and a systematic approach. Unfortunately, unmanaged savings will suffer the unenviable fate of the hundred dollar bill from the beginning of the last century.
This chart shows how the $100 bill has depreciated since 1914 due to inflation. By the beginning of the First World War, the monthly salary of a highly skilled worker or employee could reach exactly this amount. If your super-rich great-great-grandfather buried a chest of these bills, and you found it, you'd probably be furious with him. Because $100 now is like $2 then. “Dear Grandpa, why didn’t you buy something from that list ?” you might say in your heart.
However, we must give credit to our hero, as the propensity to save is a skill that any investor should start with, and something I talk about in the early chapters of my book. As Charles Munger said, “I was a cautious little squirrel who hoarded more nuts than I needed and didn’t climb into my own pile of nuts.”
The book is divided into three parts, allowing you to start with any of them, depending on your current level of knowledge.
Part One
This part will be interesting to anyone who wants to understand why we need investments, what a joint-stock company and a stock exchange are, how the price and its schedule are formed. Duration of study: 3 hours 15 minutes.
Part two
This part will be of interest to anyone who already knows the basics of stock trading but wants to understand the fundamental analysis of a company's business. Duration of study: 5 hours.
Part three
This part will be of interest to anyone who understands the financial statements of companies and wants to build a decision-making system on the stock market based on this knowledge. Duration of study: 11 hours.
I recommend reading the book “Visual Investor” thoughtfully, with pauses to understand each chapter. It is precisely with this measured pace in mind that the estimated duration of study for each block and each article has been calculated. You can move faster if you like. If you devote 1 hour a day to the book, then after 20 days you will be able to master the entire theory. Don't rush to apply the knowledge immediately you've gained in real life. TradingView has great tools for hands-on research, such as Replay and Paper Trading, that will help you solidify your knowledge without risking your capital. Similarly, civil aviation pilots train on a flight simulator before their first flight. Remember that your knowledge, systematic approach, persistence and a pinch of luck can transform everything around you. But if you still need my support, I'm here. Yours, Capy.
Part One
1. Investing is the ability to say "no" so that you can say "yes"
The reader will learn that investing is a conscious skill of foregoing immediate spending in favor of greater value in the future, based on strategy, patience, and an understanding of the difference between investing and speculation. Duration of study: 15 minutes.
2. Raising initial capital: 4 approaches, of which one is not good
The reader will learn about four ways to form start-up capital for investments, and why borrowed money is the least sensible of them. Duration of study: 10 minutes.
3. The lifestyle of your savings, and why Big Mac?
The reader will learn that investing is a conscious way to preserve and increase the purchasing power of savings, in which the level of potential profit is always proportional to the risk taken. Duration of study: 10 minutes.
4. What is a stock? Let me tell you a story
Using the example of a shoe workshop owner, the reader will learn how companies issue shares to raise capital and expand their business. Duration of study: 15 minutes.
5. Stock Company. Selling something that no one will buy piecemeal
Using the same example, the reader is explained the process of transforming a company into a joint-stock company and conducting an IPO to attract investment. Duration of study: 10 minutes.
6. I dream of entering the stock market. The question is: What for?
The reader learns that going public is a way for a company to make its shares available to a wider range of investors, increase liquidity, and simplify the process of raising capital. Duration of study: 10 minutes.
7. How is the share price formed on the stock exchange? We do it
The reader will learn how the price of a stock is formed on the stock exchange through the mechanism of bids from buyers and sellers, reflecting the balance of supply and demand. Duration of study: 20 minutes.
8. Bid/Offer: The Yin and Yang of Stock Prices
The reader will learn how buy (bid) and sell (offer) orders from the order book on the exchange, determining the mechanism for concluding transactions and the formation of the market price. Duration of study: 20 minutes.
9. Market order or the hunger games of stock trading
The reader will learn that market orders allow shares to be bought or sold immediately without specifying a price, satisfying the current demand or offer at prices available in the order book. Duration of study: 15 minutes.
10. The birth of the chart. The evolution of the tape
The reader will learn how price movement charts are formed from the stock exchange quotes feed and will see historical examples of the evolution of methods for displaying market data. Duration of study: 10 minutes.
11. Japanese Candlesticks: Game of Body and Shadows
The reader will learn how Japanese candlesticks are constructed, including determining the opening, closing, high, and low prices for a selected time interval, as well as the importance of the candlestick body and shadows in analyzing price movements. Duration of study: 20 minutes.
12. A little bit about volumes and the master of all averages
The reader will learn how to analyze trading volumes and use a 252-day moving average to evaluate stock price movements. Duration of study: 10 minutes.
13. My Three Comrades: the Chart, the Screener, and the Watchlist
The reader will learn step-by-step how to use the TradingView platform's chart, screener, and watchlist features to find and track stocks even if he doesn't know the company's ticker. Duration of study: 15 minutes.
14. Two captains of the same ship
The reader will learn how to use fundamental analysis to assess a company's financial strength by adding financial indicators to a chart in TradingView, and why the author prefers this method over technical analysis. Duration of study: 15 minutes.
Part two
15. My crazy partner is Mr. Market!
The reader will learn about the concept of "Mr. Market" introduced by Benjamin Graham, which illustrates the irrationality of market behavior and emphasizes the importance of fundamental analysis in making sound investment decisions. Duration of study: 10 minutes.
16. Picking rules - the Lynch method
The reader will learn about Peter Lynch's investment principles, including the benefits of private investors, the importance of a financial safety net, the need to understand a company's performance before investing, and the importance of analyzing its earnings. Duration of study: 15 minutes.
17. A pill for missed opportunities
The reader will learn how to set up alerts in TradingView to react promptly to changes in stock prices, thereby avoiding missing profitable opportunities to buy or sell. Duration of study: 15 minutes.
18. Man on the shoulders of giants
The reader learns the story of an Indian engineer who, after starting to invest in his 30s, achieved significant success, emphasizing the importance of self-education and inspiration from eminent investors. Duration of study: 10 minutes.
19. Price is what you pay, but value is what you get
The reader will learn about Warren Buffett's approach to investing based on the difference between price and the intrinsic value of a company, and the importance of fundamental analysis in making investment decisions. Duration of study: 10 minutes.
20. Balance sheet: taking the first steps
The reader will learn about the structure of the balance sheet, including the concepts of assets, liabilities, and equity. Duration of study: 30 minutes.
21. Assets I prioritize
The reader will learn which balance sheet items are most important for assessing a company's sales performance, and why the author focuses on cash, accounts receivable, and inventory when analyzing current assets. Duration of study: 20 minutes.
22. A sense of debt
The reader will learn about the structure of liabilities and shareholders' equity on a company's balance sheet, including the differences between short-term and long-term debt, and will understand how to analyze debt burden when assessing a company's financial health. Duration of study: 20 minutes.
23. At the beginning was the Equity
The reader will learn about a company's capital structure, including the concepts of retained earnings and return on investment, and will understand how these items are reflected in the balance sheet. Duration of study: 20 minutes.
24. The income statement: the place where profit lives
The reader will learn about the structure of a company's income statement, including key indicators: revenue, cost, gross and operating profit, as well as the importance of these metrics for assessing the financial condition of the enterprise and their impact on the dynamics of stock prices. Duration of study: 30 minutes.
25. My precious-s-s-s EPS
The reader learns that earnings per share (EPS) is calculated as net income available to common shareholders divided by the number of common shares outstanding, and that diluted EPS considers potential increases in the share count due to employee options and other factors that affect earnings distributions. Duration of study: 20 minutes.
26. What should I look at in the Income statement?
The reader will learn which key income statement metrics — such as revenue, gross profit, operating expenses, debt service expense, net income, and diluted earnings per share (EPS Diluted) — the author believes are most important for assessing a company's financial health. Duration of study: 10 minutes.
27. Cash flow statement or Three great rivers
The reader will learn about the structure of the cash flow statement, which includes three main flows: operating, financial and investing, and will understand how these cash flows affect the financial condition of the company. Duration of study: 20 minutes.
28. Cash flow vibrations
The reader will learn how to analyze a company's operating, investment, and financial cash flows to assess its sustainability, strategy, and ability to effectively manage resources. Duration of study: 20 minutes.
29. Financial ratios: digesting them together
The reader will learn that financial ratios are relations between various financial reporting indicators that allow an objective assessment of the financial condition and value of a company, and will understand how to use key multiples to analyze the investment attractiveness of a business. Duration of study: 25 minutes.
30. What can financial ratios tell us?
The reader will learn about key financial ratios such as Diluted EPS, Price/Earnings Ratio (P/E), Gross Margin, Operating Expense Ratio, Return on Equity (ROE), Days Payable and Days Sales Outstanding, and Inventory to Revenue Ratio, and will understand how to use these metrics to assess a company's financial health and investment attractiveness. Duration of study: 30 minutes.
Part three
31. Price / Earnings: Interpretation #1
The reader will learn how the P/E (price to earnings) ratio helps assess the value of a company by determining how many dollars an investor pays for each dollar of earnings, and will understand why a lower P/E may indicate that a company is undervalued. Duration of study: 25 minutes.
32. Price/Earnings: amazing interpretation #2
The reader will learn an alternative approach to interpreting the P/E ratio by viewing it as the number of years it takes to break even on an investment, assuming the company's earnings are stable. Duration of study: 30 minutes.
33. How to apply an indicator that is only available upon request?
The reader will learn how scripts written in Pine Script work on the TradingView platform and what levels of access there are to them: from completely open to requiring an invitation from the author. The article explains how to request access to an indicator if it is restricted, and what steps to take to add it to a chart once permission is granted. Duration of study: 15 minutes.
34. How to assess the fundamental strength of the company?
The reader will learn about the approach to assessing the financial stability of a company through the aggregation of key financial indicators and multipliers, allowing a visual and quantitative assessment of the dynamics and current state of the business. Duration of study: 30 minutes.
35. How to evaluate the work of company management?
The reader will learn about the approach to assessing the effectiveness of a company's management through the prism of the concept described by Eliyahu Goldratt in his book "The Goal", which focuses on three key indicators: throughput, inventory and operational expenses, and will understand how these indicators affect the financial results of the enterprise. Duration of study: 30 minutes.
36. How to evaluate the state of a company's cash flows?
The reader will learn about the importance of cash flow analysis in assessing a company's financial health, including the interpretation of operating, investing, and financing flows. Duration of study: 25 minutes.
37. How to catch the rainbow by the tail?
The reader will learn how to determine optimal price ranges for buying stocks based on the principles of fundamental analysis and the idea of investing with a margin of safety. Duration of study: 40 minutes.
38. How to convert craziness into results?
The reader will learn how to navigate market volatility, make smart stock selling decisions, and use a fundamental approach to turn emotional market swings into rational investment actions. Duration of study: 35 minutes.
39. How to use Replay to study indicators?
The reader will learn how to use the Market Simulator feature on the TradingView platform to analyze historical data and test indicators, including step-by-step instructions for activating the simulator, selecting the start date, adjusting the playback speed, and interpreting the results when analyzing NVIDIA Corporation stock. Duration of study: 30 minutes.
40. How to explain my decision-making system?
The reader will learn about the author's approach to choosing stocks for investment, which includes an analysis of the fundamental strength of the company, cash flow dynamics, news, P/E multiple and other aspects of the decision-making system. Duration of study: 35 minutes.
41. The most subjective facet of my decision-making system
The reader will learn how news, although difficult to formalize, influences the investment decision-making process and why its interpretation is the most subjective aspect in stock evaluation. Duration of study: 35 minutes.
42. Full instructions for studying the fundamental strength of a company
The reader will learn how to use applied tools to evaluate a company's financial results, visually track their dynamics over time, and analyze the movement of key cash flows, which accelerates the process of selecting companies with strong fundamental indicators. Duration of study: 90 minutes.
43. Full instructions for determining price ranges for opening and closing positions
The reader will learn how to determine optimal price ranges and trade sizes when investing in stocks, based on the principles of value investing and Benjamin Graham's "margin of safety" concept. Duration of study: 120 minutes.
44. 10 tricks for developing discipline or here was Warren
The reader will learn ten practical methods to help investors develop discipline, including using alerts, keeping a trading journal, and developing good habits, and will understand how discipline affects the achievement of investment goals. Duration of study: 40 minutes.
45. The Inside Out Investor
The reader will learn how emotional states such as fear, excitement, and fear of missing out (FOMO) influence investment decisions and will understand how awareness of these emotions helps an investor stick to their chosen strategy and make informed decisions. Duration of study: 20 minutes.
46. Effective inefficiency
The reader will learn about the different approaches to using Stop Losses in investment strategies, their impact on the profit/loss ratio, as well as the concept of market efficiency and strategies in it. Duration of study: 30 minutes.
47. Institute of Intermediation and 24 Coffee Lovers
The reader will learn about the factors that create market inefficiencies, such as delays in the dissemination of information, high volatility, the actions of large players and participant errors, as well as the role of intermediaries - brokers and exchanges - in ensuring the efficiency and convenience of trading in financial markets. Duration of study: 25 minutes.
48. Eternal Sunshine of the Spotless Mind
The reader will learn about the life of Charles Munger, vice chairman of Berkshire Hathaway, his investment philosophy based on common sense and discipline, as well as his views on the importance of personal relationships and moderation in achieving success. Duration of study: 5 minutes.

The Inside Out InvestorThere is a common misconception that investing in stocks is always stressful and emotionally overwhelming. Many people think that this activity is only available to extremely resilient people or crazy people. In fact, if you know the answers to three key questions, investing becomes a rather boring activity. Let me remind you of them below:
1. Which stocks to choose?
2. At what price should the trade be made?
3. In what volume?
As for me, most of the time, I'm just in waiting mode. First, I wait for the company's business to start showing sustainable growth dynamics in profits and other fundamental indicators. Then, I wait for a sell-off of strong company shares at unreasonably low prices. Of course, this requires a lot of patience and a positive outlook on the future. That's why I believe that being young is one of the key advantages of being a beginner investor. The younger you are, the more time you have to wait.
However, we still have to get to this boring state. And if you've embarked on this long journey, expect to encounter many emotions that will test your strength. To help me understand them, I came up with the following map.
Next I will comment on each of its elements from left to right.
Free Cash horizontal line (from 0% to 100%) - X axis
When you first open and fund a brokerage account, your Free Cash is equal to 100% of the account. Then it will gradually decrease as you buy shares. If Free Cash is 0%, then all your money in the account was invested in shares. In short, it is a scale of how much your portfolio is loaded with stocks.
Vertical line Alpha - Y axis
Alpha is the ratio of the change in your portfolio to the change in an alternative portfolio that you do not own but use as a reference (in other words, a benchmark). For example, such a benchmark could be an ETF (exchange-traded fund) on the S&P500 index if you invest in wide US market stocks. Buying an ETF does not require any effort on your part as a manager, so it is useful to compare the performance of such an asset with the performance of your portfolio and calculate Alpha. In this example, it is the ratio of your portfolio's return to the return of the S&P 500 ETF. At the level where Alpha is zero, there is a horizontal Free Cash line. Above this line is positive Alpha (in which case you are outperforming the broader market), below zero is negative Alpha (in which case your portfolio is outperforming the benchmark). Let me clarify that the portfolio yield includes the financial result for both open and closed positions.
Fear of the button
This is the emotion that blocks the sending of an order to buy shares. Being captivated by this emotion, you will be afraid to press this button, realizing that investing in shares does not guarantee a positive result at all. In other words, you may lose some of your money irretrievably. This fear is absolutely justified. If you feel this way, consider the size of your stock investment account and the percentage amount you are willing to lose. Remember to diversify your portfolio. If you can't find a balance between account size, acceptable loss, and diversification, don't press the button. Come back to her when you're ready.
Enthusiasm
At this stage, you have a high share of Free Cash, and you also have your first open positions in stocks. Your Alpha is positive. You are not afraid to press the button, but there is a certain excitement about the future result. The state of enthusiasm is quite fragile and can quickly turn into a state of FOMO if Alpha moves into the negative zone. Therefore, it is critical to continue learning the chosen strategy at this stage. A journey of a thousand miles begins with a single step.
FOMO
FOMO is a common acronym used to describe a psychological condition known as fear of missing out. In the stock market, this manifests itself as fear of missing out. This condition is typical for a portfolio with a high proportion of Free Cash and negative Alpha. As the benchmark's return outpaces your portfolio's return, you will be in a nervous state. The main worry will be that you didn't buy the stocks that are currently the growth leaders. You will be tempted to deviate from your chosen strategy and take a chance on buying something on the off chance. To get rid of this condition, you need to understand that the stock market has existed for hundreds of years, and thousands of companies trade on it. Every year, new companies emerge, as well as new investment opportunities. Remind yourself that you are not here for one million dollar deal, but for systematic work with opportunities that will always be there.
Zen
The most desirable state of an investor is when he understands all the details of the chosen strategy and has effective experience in its application. This is expressed in positive Alpha and excellent mood. Taking the time to manage your portfolio, developing habits and a disciplined approach will bring satisfaction and the feeling that you are on the right track. At this stage, it is important to maintain this state, and not to chase after thrills.
Disappointment
This stage is a mirror of the Zen state. It can develop from the FOMO stage, especially if you break your own rules and invest on luck. It can also be caused by a sharp deterioration in the condition of a portfolio, which was doing well in the Zen state. If everything is clear in the first case, and you just need to stop acting weird , then in the second situation you should remember why you ended up in a state of Zen. Investments are always a series of profitable and unprofitable trades. However, losing trades cannot be considered a failure if they were made in accordance with the principles of the chosen strategy. Just keep following the accepted rules to win in the long run. Also remember that Mr. Market is crazy enough to offer prices that seem absurd to you. Yes, this can negatively affect your Alpha, but at the same time provide opportunities to open new positions according to the chosen strategy.
Euphoria
Another way out of the Zen state is called Euphoria. This is typical dizziness from success. At this stage you have little Free Cash, a large share of stocks in your portfolio and phenomenally positive Alpha. You feel like a king and lose your composure. That is why this stage is marked in red. In a state of euphoria, you may feel like everything you touch turns to gold. You feel the desire to take a risk and play for luck. You don't want to close positions with good profits. Furthermore, you think you can close at the highs and make even more money. You are deviating from the chosen strategy, which is fraught with major negative consequences. It only takes a few non-systemic decisions to push your Alpha into the negative zone and find yourself in a state of disappointment. If your ego doesn't stop there, the decline may continue.
Tilt
A prolonged state of disappointment or a rapid fall of Alpha from the Euphoria stage can lead to the most negative psycho-emotional state called Tilt. This term is widely used in the game of poker, but can also be used in investments. While in this state, the investor does everything out of strategy, his actions are chaotic and in many ways aggressive. He thinks the stock market owes him something. The investor cannot stop his irrational actions, trying to regain his former success or get out of a series of failures in the shortest possible time. This usually ends in big losses. It is better to inform your loved ones in advance that such a condition exists. Don't be embarrassed by this, even if you think you are immune to such situations. A person in a state of tilt withdraws into himself and acts in a state of affect. Therefore, it is significant to bring him out of this state and show that the outside world exists and has its own unique value.
Now let's talk about your expectations, as they largely determine your attitude towards investing. Never turn your positive expectations into a benchmark. The stock market is an element that is absolutely indifferent to our forecasts. Even strong companies can fall in price if there is a shortage of liquidity in the market. In times of crisis, everyone suffers, but the most prepared suffer the least. Therefore, the main task of a smart investor is to work on himself until the moment he presses the coveted button. There will always be a chance to do this. As I said, the market will not disappear tomorrow. But to use this chance wisely, you need to be prepared. This means that you should have an answer to all three questions above. Then you will definitely catch your Zen.

Correction wave for SPYAssuming 5 impulse waves ended at 600 for SPY, and considering Friday’s low as the end of wave A, we’re going to retrace back to the range of 592-596 for wave B and then begin wave C. This analysis will be invalid if spy makes a new ATH on daily close.

SPY -Forming Cup and handle pattern on daily SPY -Forming Cup and handle pattern on daily
Need to close abv 563. Today we had very good rally from 539.96 to 555.
we keep in watchlist.
Pattern valid only abv 563 close.

A sign of the times. I think a 4 year Mark Up Just Started. Yeah so basically we could be at the beginning of a massive 4 year bull market.
Imagine if all major big names doubled or tripled. and Imagine if a couple even 5x'd.
Not financial Advice but I'm sticking to my call swings.
I love bottoms.
Imo Gold will be bullish too, been on that since 1800s.
Let's get this bread. lol

SPY Expectations Ellipses mark ranges within which price levels should meet. Monday drop and then a pop

SPY Expectations as of 4/25/2024Green ellipses = range where crest should form.
Red ellipses = range where trough should form.
Based on Mercury Retrograde Trade Strategy as part of EsoMeta Analysis.

SPY Expectation as of 4/25/2024 Green ellipses = crests, red ellipses = troughs.
Price ranges Based on Mercury Retrograde Trade Strategy as part of EsoMeta Analysis.

SPY ExpectationsRed ellipses indicate ranges where troughs are likey to form, green ellipses indicate ranges where peaks are likely to form.

SPY ExpectationsGreen ellipses are ranges where we are likely to see a peak, red ellipses are ranges where we are likely to see a trough

SPY WEEKLY 5TH FEB 2024This is my analysis for SPY for this week. Make sure to DM me for any questions or doubts.
NOTE:DO NOT SHORT THE MARKET


Going To SHORTMany thinks market is bullish but I think this ticker may take reverse and hit at least two of marked line .. let’s see ..
It will take 5-6 months

Breakdown in US ETF's!! Caution Long !!🔴All four major index ETF's in US markets has broken down.
🔴ETF's trading below their 20 DEMA. RDX momentum score<5
🔴Higher volume on sell days & lower volumes when they rise
🔴Daily RSI about to break 40 mark and go lower and lower
🔴SuperTrend also indicating trend change & gave sell signal
🔴Indian markets may follow the suite and have broken 20000
🔴Exercise caution longs. #Nifty can test 19300/19000/18600
