AMAZON Chart analysis on Monthly time frameDescription posted in chart amazon on critical monthly trendline supportby pareeksumit3110
Is it the right time to buy Amazon stock?On the monthly time frame stock is in a rising wedge pattern. It is also outperforming the market from the past few months.Longby Sumanyu_AggarwalUpdated 11
AMZN is not holdingStock was near a major support. But it is falling continuously. It is forming a falling wedge pattern on the weekly chart. Because it broke a major support, we can see a short term bounce, but the overall trend seems to be bearish, until price breaks out of the wedge.by Sumanyu_Aggarwal1
NYSE FANG+ vs AMZNRelative performance. Note that NYSE FANG+ can be bought in India and is pledge-able, as MAFANG security / Mirae Asset NYSE FANG+ ETF Fund of Fundby rushiagr0
Is it breakout coming soon??This is just for educational purpose. Trying to analysis some US top stocks. Enjoy Trading :) Longby snehalpatel11
AMAZON VERY IMPORTANT CONSOLIDATION - ABOUT TO BREAK .WHY BULLISH ? REASONS : 1 . A Long Consolidation And W Pattern ( Which Are Very Important In Terms Of Trend Decider ) Have A Breakout As Seen In The Graph Shared . 2 . Rsi Divergence Breakout Is Also Visible In The Graph . 3 . Best Part Is - As I Am Writing This Article - The Global Market Sentiment Has Gone Bullish - Right Now As I Write This - Global Market Is Up Over An Average Of 2 Percent Which Is Highly Supporting The Breakout . 4 . One is to Two point Five Risk Reward Ratio Can Be Achieved. 5 . Still Best Entry Comes When Day Candle Is Closed Above This Box Created In The Graph Else 1 Hr Candle Has Given The Breakout Still Day Candle Will Give Better Confirmation . 10 Percent at 129 ( and 15 Percent at 136 if price action supports) can be achieved . Warm Request - Kindly Comment If Anyone Find This Information Helpful Or Anyone Who Takes Position In This After Reading This Article .Longby AbhishekingxUpdated 443
amzom buy amazon buy this stock complete candlestick or macd or rsi postive range workLongby HARISHRAO990
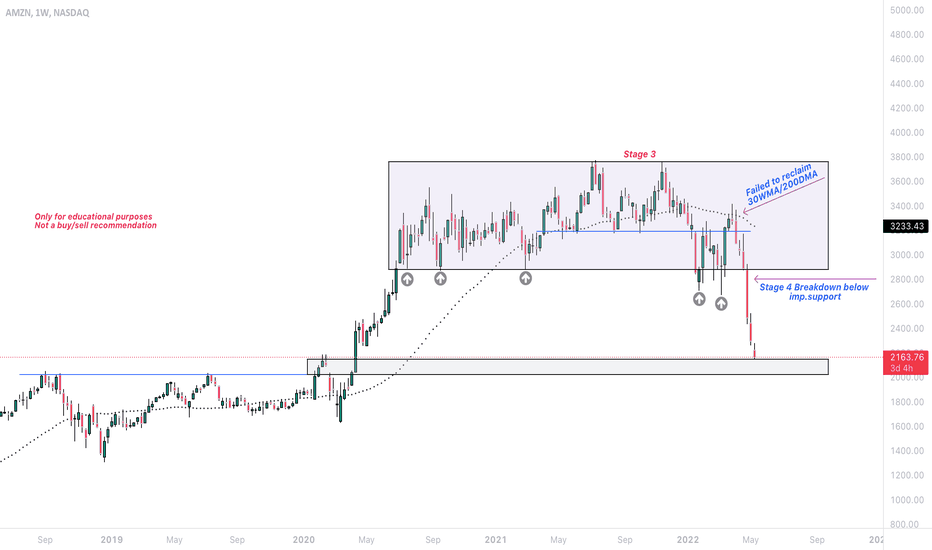
Amazon (AMZN) Stage AnalysisAmazon weekly TF chart.. Stage Analysis. Only for educational purposes, not a recommendation.by Saninvestor0
AMZNWatch how this stock moves through this, which I consider an indicator with which I can know the movement of all the chartsLongby Said4991
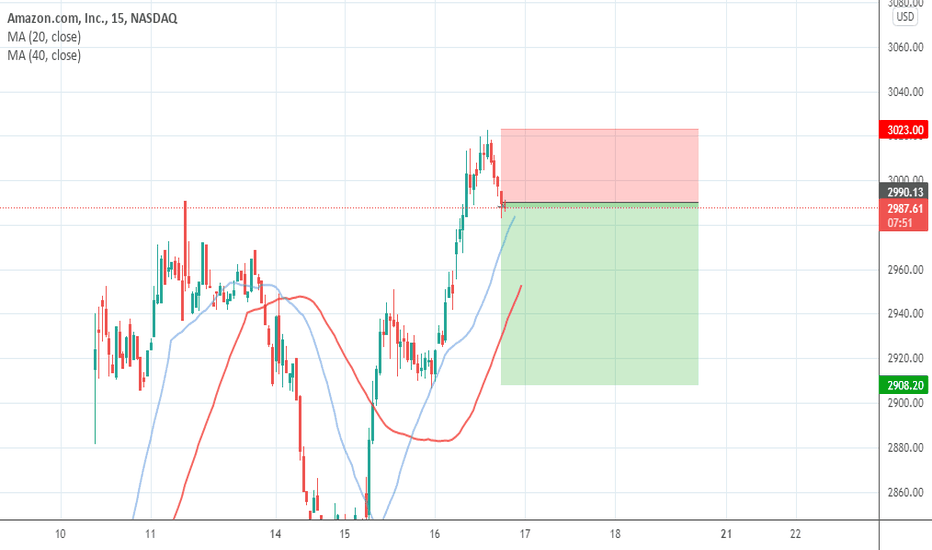
Short Amazon For Intraday Short Amazon at 2986 Target - 2900 Sl - 40 Point There is a Trend revealing Parten in Amazon which can give his fuel to hit a low point. It looks like a trap Shortby SwingOptionTrading2
AMAZON Consolidation Monthly-TimeframeIts very important that the price remains within the parallel consolidation channel. The price should remain in the 2880-3550 consolidation range. As soon a monthly closing happens above or below this channel , we can expect a violent move in that side. Till then bid your time and watch out the VCP pattern playing outby VinP817460
AMZON200 week average at lower levels. 5 year average. around 50% retracement. Weekly RSI Oversold Retracement 50% and 61.8% could be opportunity for passive long term. by hitendravasudeo1
Amazon Head & Shoulder BreakoutCurrently trading at 3430, as market is bullish, ignoring all negative news. If amazon able to post good numbers. It will be super buy above 3555 for new life time high.Longby jayan180
Amazon.com (AMZN) technical analysisHello, This is my first ever published Technical Analysis. According to my analysis the price will go up. We should take entry at 3262 The target should be at 3340 Stop Loss at 3234. Note: This is just a Technical Analysis if by any chance my target doesn't become reality and you lose money then I will not be the liable person for your investment on any particular asset that you have made, only you will be the responsible for your trade/investment.Longby BirhangBasumataryUpdated 1
after a downtrend amz has shown good momentum for upside tgt and sl are indictated. 1st tgt can be 81 for safe traders but thats the least ir can go 90 and 95 are other targets trail your stoploss using Fibonacci or pivots Longby kartiksharma05101
How to ride on a swing trade ??? Ex :AMZNHow to ride on a swing trade? One good strategy in price action is to use 21 EMA and ride on swing trades for short or long terms. 21-day EMA can be called as the Goldilocks of all moving averages. 5,8,13 can be too tight and 50,100,200 are too loose for looking at moving averages, hence 21 EMA can be considered as a powerful average. In this strategy 21 EMA LOW and 21 EMA HIGH are plotted on the graph forming a channel. Any channel breakout up or down triggers a buy or sell respectively. The bar which detaches with the bar which pierced out of channel can be used as a buy or sell. Please remember this bar should be in the trend up or down respectively to the earlier bar which is piercing out of the channel and not at same levels. In uptrend, high of that second bar can be used to buy and in downtrend, low of the second bar can be used to sell. Put stop loss of one bar below for uptrend and one bar above for downtrend. Keep trailing as per the risk appetite. We can add during the trend when the candlestick bars touches the channel line and again detaches itself to follow trend, same second bar high should be used as explained earlier for buy or sell respectively. Keep raiding this trend until the bars touch lower channel in uptrend and upper channel in downtrend respectively. There are many ways to take profit as per your money management. Book profit at 1:2 or 1:3 or 1:4 etc as per the risk. One best way is to put trailing stop loss at high of every bar, it can also be at low but if the size of bar is big and in case of reversal of trend, that bar length of profit would be lost. If the bars are too big then half of the bar can be used for stop loss to average out of profit on reversal. If the bars are far away from channel profits can be booked. This works very well for 1 hour and above time period. Certain stocks may not fall into this strategy due to way they operate or may very rarely follow the above 21 EMA channel pattern. Above chart is an example and we tried to put strategy as simple as we can. Exceptions to strategies will always be there, so please back test as much as you can to understand this method. Hope this helps to gain a bit of knowledge! Please press like or thumbs up button, if you like this strategy, Thanks Educationby AdhigamaTrading229
AMAZON VIEW AT CURRENT PRICE LEVELS1 DAY CHART The cross channel trendline which acted as support previously was broken and the stock dipped. The price has reached the cross channel again which can now act as resistance for a few days. My view Short term- (Sell) it can drop down to support levels back at 3350. Support from both moving averages and trendlines. Long-term= (hold) as it is a Jan ce. It could go back, take support and have a strong up move.Longby AMG11Updated 110
AMZN MOVIN ON UPAMZN BOX JUMPER. pretty boring chart pattern. box and jump. box and.... recaptured averages...can she stay above and fill the gap...if so thats >10%. that gets her above the box. maybe a nice jump up to the next trading range. macd is your friend on the daily; weekly still a little behind -- paytience ....... Longby Lingamfelter0
AMAZON : ASCENDING CHANNEL TRENDAMAZON : ASCENDING CHANNEL TREND As Per Chart Pattern Price Can Hit 3900 Level soon and Stoploss 3250Longby Trading_Freaks1