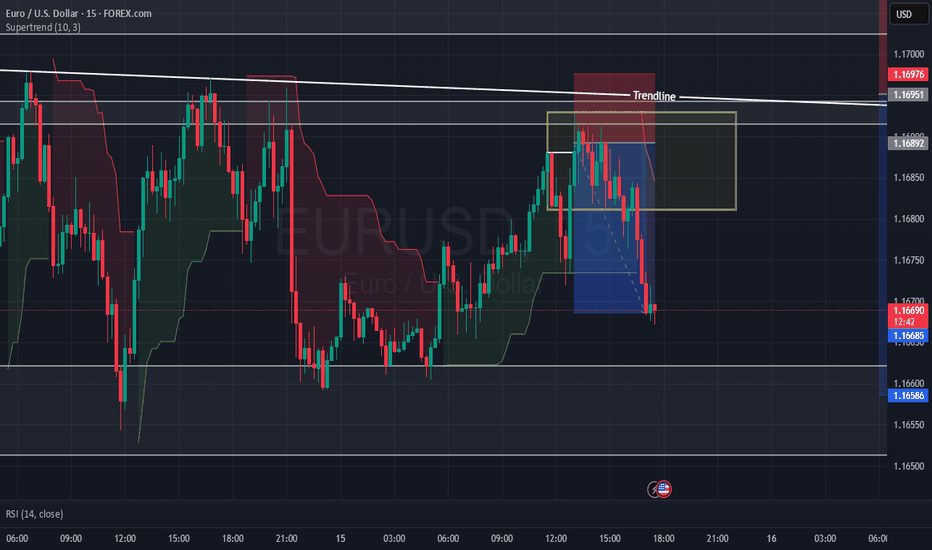
EURUSD trade ideas
EUR/USD Under Pressure: Will the Downtrend Continue?The EUR/USD exchange rate remains under pressure today, fluctuating below the 1.1700 level as the U.S. dollar gains strength following President Trump's announcement of new tariff letters directed at his two largest trade partners, boosting demand for safe-haven assets.
The downtrend may be further reinforced in the near term, if not in the short run. On the chart, a wedge pattern is forming, and breaking this pattern could add fresh momentum to EUR/USD.
Do you agree with my view?
Leave your comments below and don’t forget to like the post for extra luck!
EUR/USD Trading Towards Previous Weekly High?Hello traders , here is the full multi time frame analysis for this pair, let me know in the comment section below if you have any questions , the entry will be taken only if all rules of the strategies will be satisfied. wait for more price action to develop before taking any position. I suggest you keep this pair on your watchlist and see if the rules of your strategy are satisfied.
🧠💡 Share your unique analysis, thoughts, and ideas in the comments section below. I'm excited to hear your perspective on this pair .
💭🔍 Don't hesitate to comment if you have any questions or queries regarding this analysis.
Dollar is about to strengthen again EURUSD 1.1625
Elliott - this rally is done and now a three wave correction should start from here. I have divided the C waves into its own 5 waves on the weekly charts on the right. Hence the rally is done.
RSI - the RSI continues to oscillate in the bear zone indicating the long term trend is still down. Composite is giving a negative divergence at resistance which is trend reversal.
Conclusion - this is in particular very imp to us as the change in trend first happens in the currency mkt. Weak EUR against dollar means weakness for the Equity mkt.
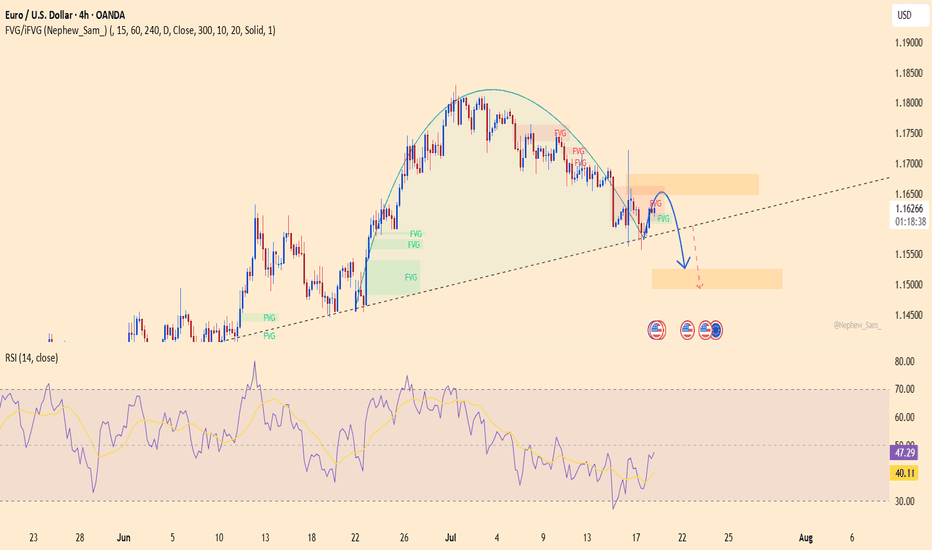
EURUSD on the verge – a trap waiting for the carelessThis pair has just completed a classic rounding top, with a sharp rejection near 1.16500. Buying momentum is fading, RSI is dropping, and the recent retest of the broken trendline might have been the final warning – the “kiss of death” could already be in play.
On the fundamental side, the U.S. keeps fueling the dollar: consumer spending is rising, jobless claims are falling, and the Fed shows no sign of easing up. Meanwhile, the ECB is still searching for direction, leaving the euro exposed and vulnerable.
If the current support level breaks, EURUSD could slide quickly to lower zones. This is no longer a time for hope – it’s time to choose a side and act.
EURUSD under pressureEURUSD is moving within a well-defined descending channel, forming consistent lower highs and lower lows. The price has recently rejected the resistance zone near 1.16100, showing signs of continued bearish momentum.
On the fundamental side, stronger-than-expected U.S. retail sales—especially in the core figure—have boosted the U.S. dollar, putting downward pressure on the euro. Coupled with ongoing concerns about Eurozone economic growth, the pair is likely to continue its decline toward the 1.15400 support area. RSI remains below the neutral zone, confirming short-term bearish bias.
Traders should watch closely for reactions at support to assess further short opportunities.
"Big Move Loading on EUR/USD! 🔥 "Big Move Loading on EUR/USD! 🚨"perfect Elliott Wave trap is forming – will you catch the fall or get caught at the top? 📉📈
Future Projection (Right Side Drawing)
You have projected a Bearish 5-Wave Impulse (Elliott Wave):
1. The market is expected to reverse from the C wave top (around 1.16023 - 1.16294).
2. After this, a 5-wave bearish pattern may unfold.
3. Target: Down to the 1.16017 → 1.15449 zone.
---
📌 Key Levels to Watch:
Level Significance
1.16294 Strong resistance (Wave C potential top)
1.16023 Minor resistance
1.16022 Price is near this resistance zone
1.16017 Break of this confirms bearish impulse
1.15937 Minor support
1.15449 Major support / Final target
---
🧠 Trading Insight:
If you're trading this:
✅ Sell Setup Activation: Wait for rejection in the C zone (1.16022–1.16294).
📉 Short Entry: After confirmation (bearish engulfing, trendline break, etc.).
🎯 Targets: 1.16017 → 1.15937 → final target 1.15449.
🛑 Stop Loss: Above 1.16300 ideally
Falling Wedge Pattern
ABC Zigzag Correction
Elliott Wave (5-wave bearish projection)
Supply & Demand Zones
Price Action Confirmation
---
Euro Slips Further as Safe-Haven Demand for USD GrowsThe EUR/USD pair is facing strong selling pressure as global financial markets continue to reel from geopolitical and trade-related tensions. The Euro is weakening as investors increasingly turn to the U.S. Dollar as a safe haven, following a series of aggressive tariff policies announced by the United States.
Adding to the Euro’s struggles is the lack of positive economic data from the Eurozone, which has further diminished hopes for a meaningful recovery. Traders are now closely watching for monetary policy signals from both the ECB and the Federal Reserve, but so far, the bearish trend remains firmly in place.
On the technical front, EUR/USD continues to move within a descending channel, while the bearish crossover of the EMA 34 and 89 keeps sellers in control. With risk sentiment leaning defensive and capital flowing toward safe-haven assets, the pair may see further downside unless surprise bullish catalysts emerge from upcoming data or central bank remarks.
EUR/USD Slumps – Shakeout or New Sell-Off?The euro took a sharp nosedive, falling from 1.168 to nearly 1.160 in its steepest drop of the week, after hotter-than-expected U.S. CPI data shocked the market. This move reflects a classic repricing of rate expectations, as traders quickly rotated back into the dollar – the “sleeping giant” now seemingly reawakened.
Is this just a technical pullback or the beginning of deeper pain for EUR/USD bulls? With the Fed signaling it may hike again if inflation persists, the macro bias clearly favors USD strength. However, if the 1.160 support holds and we see a strong bounce with rising volume, a short squeeze could be in the making – catching late bears off guard.
Integration of SWAP charges and Leverage for Strategy backtest.Backtesting in Pine Script often gives idealized results, but real trading involves financing costs like SWAP charges and the impact of leverage. Ignoring these can lead to a misleading strategy performance.
✅ Use-case:
Forex swing trading
Overnight Index strategies
Leveraged day-trading
📌 Key Features:
Adjustable leverage (e.g., 5x, 10x)
Customizable SWAP cost (as % or fixed amount)
P&L adjusted after each trade entry/exit
Performance metrics reflect net of financing costs
💬 Question for the community:
How to integrate SWAP charges and Leverage (for Forex trading) into Pine Script to backtest a strategy? Have you found a more precise or automated method (perhaps broker feed integration)?
Let's improve Pine-based backtesting together.
Drop your ideas, techniques, or improvements below. 👇
LONG OPPORTUNITY ON EURUSDThere is a buying opportunity available on eurusd as the market structure is bullish for now but there is two probability available for long which I have mark the levels with black zone if Market comes to the second black zone then that would be a good buy as there is also the fib 61.8% level note only trade on zone when the trendline is break+retest here retest is imp while retesting ensure that market must failed to break the previous low and enter on a buying green healthy candle.
FED CHAIR POWELL SPEECH EURUSD 15 ANALYSISTodays fed chair speech our target for eurusd is marked on the chart as a buyside liquidity , as we are bullish in eurusd and we have buyside liquidity we are targeting that it may go lower to take some liquidity and then go for the buyside....keep following me for more updates.
EURUSD 1H ANALYSIS (ICT MARKET STRUCTURE)As we have taken support form 1h fvg and the bias is bearish , when the take supprt from fvg we make a swing high as itm(intermediate high)and his left and right side we make short term high (STH),we are expecting to reach the target that i have marked but if we break sth then we will close the trade ....for more update keep following me.
EUR/USD Cooling Off – Buying Opportunity Ahead?After a strong bullish run fueled by Fed rate cut bets, EUR/USD is now pulling back to the FVG zone near 1.1620 as the USD finds some footing on Powell’s hawkish remarks. Despite the pause, the bullish structure remains intact. The pair is still supported by the Ichimoku cloud and volume flow hasn’t left the market.
Ideal scenario: Look for a long setup if price tests 1.1600–1.1620 with rising volume confirmation.
EUR/USD: Continuing Downtrend and Key Levels to WatchHello traders, what are your thoughts on EUR/USD?
Today, EUR/USD continues its strong downtrend, currently trading around 1.161. One of the key factors driving this decline is the strong recovery of the USD. Following the release of positive data from the US, especially the unemployment report, the market has reinforced expectations that the Fed will maintain high interest rates for a longer period. This has reduced the appeal of the euro, putting significant pressure on EUR/USD.
From a technical perspective, the price is approaching the trendline's lower limit, and a breakout at this point could push EUR/USD further down. Personally, I expect the EMA 89 area to be an ideal target for this strategy.
What about you, do you agree with my outlook? Feel free to share your thoughts, and let’s discuss!
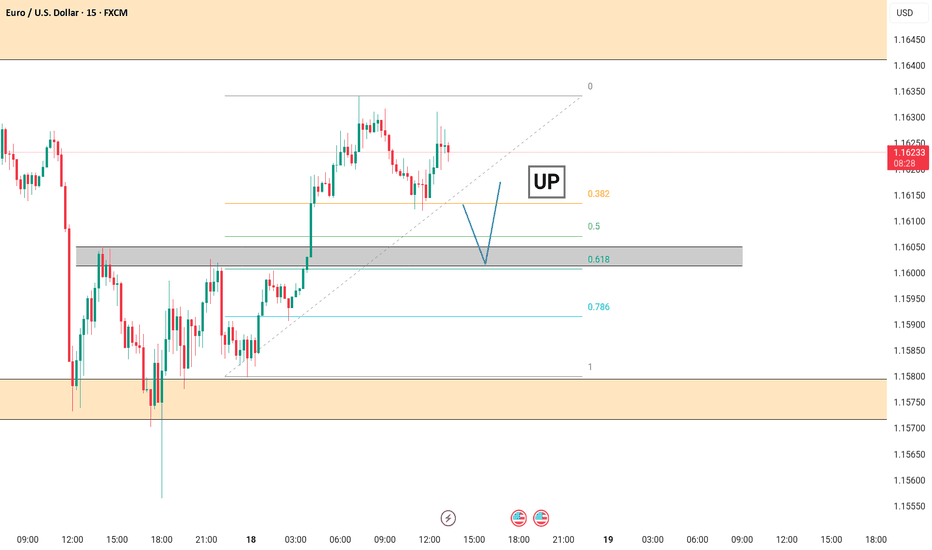
LONG OPPORTUNITY ON EURUSD 1.16048 LEVELOn 1hr time frame market is bullish and a pull back is remaining for a market to move upside as soon as we shift to 15 min time-frame we can see a level of resistance become support on 1.16048 zone level and also there is a Fibonacci retracement 61.8% golden ratio ONLY ENTER WHEN MARKET TAP AT THAT ZONE AND A HEALTHY BULLISH BAR CANDLE CLOSE.
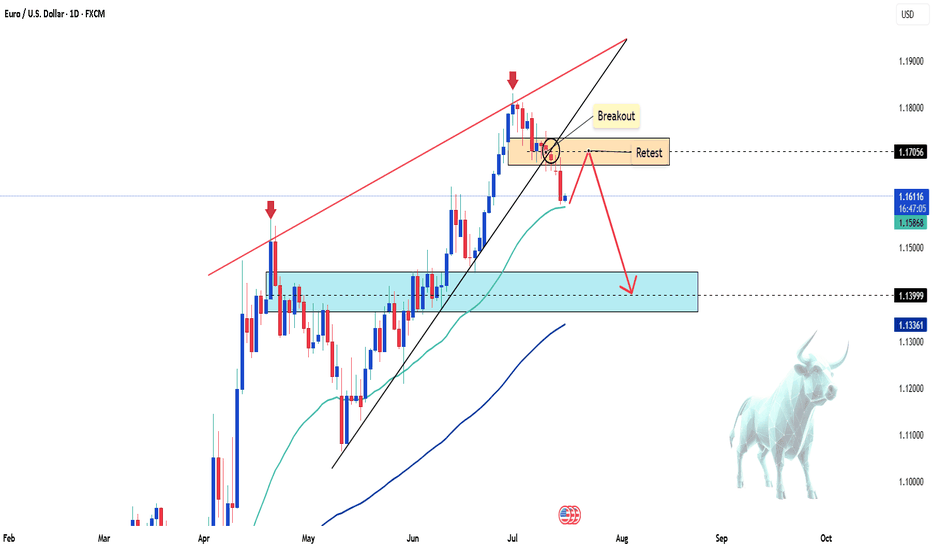
EUR/USD Faces Strong Sell-off, Is a Deeper Correction Coming?The FX:EURUSD pair continued its sharp decline this morning, currently trading around 1.161, after breaking through the bullish wedge pattern on the daily chart. This key technical signal suggests that the previous uptrend has ended, opening the possibility for a deeper correction in the short term. The inability to hold the 1.171 resistance after two attempts further confirms the ongoing downtrend.
The selling pressure is driven by the strong recovery of the USD, as investors seek refuge in safe-haven assets amid concerns about global growth and geopolitical instability. Additionally, U.S. bond yields have rebounded following strong economic data, reducing the appeal of the euro. The expectation that the Fed will maintain high interest rates for a longer period also contributes to the downward pressure on EUR/USD.
In the short term, if EUR/USD fails to hold the 1.158 support, there is a high likelihood of a drop towards 1.140, a level that acted as strong support in the past. Traders should closely monitor signals from the Fed and the upcoming PMI data for the Eurozone to assess the next trend direction.
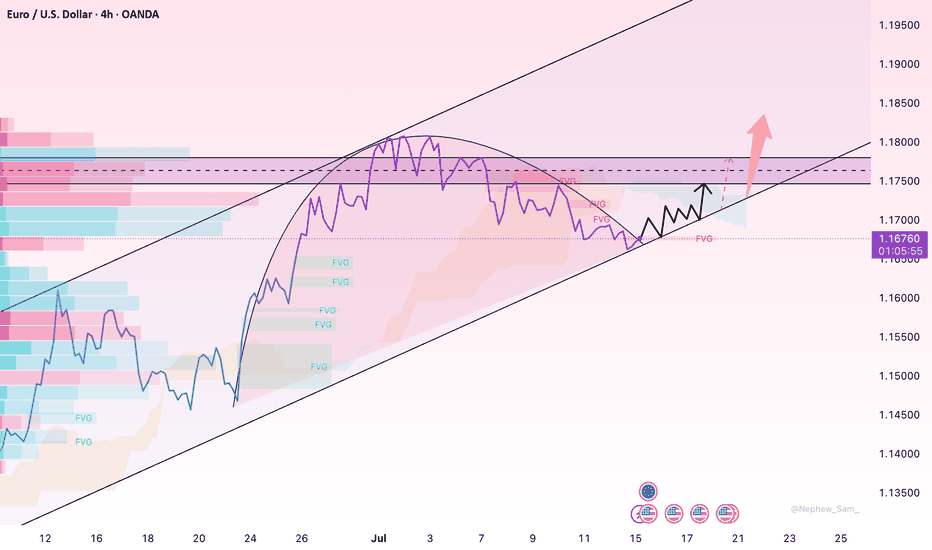
EUR/USD in Tight Range – Calm Before the Data StormOANDA:EURUSD is currently trading in a tight range around 1.1670, consolidating after a sharp decline from 1.1850. On the 4H chart, price action shows repeated rejections from old Fair Value Gaps, hinting at indecision from both bulls and bears.
Yet, there's a clear setup building: unfilled FVGs overhead suggest unfinished downside potential, while growing volume under 1.1650 may signal a possible short squeeze – especially if US CPI data underperforms.
With CPI, PPI, retail sales, and multiple Fed speeches all lined up this week, the pair is poised for a breakout. Volatility is coming – it’s only a matter of direction.


