EUR/USD Analysis: Bullish Breakout Towards 1.09524EUR/USD 30-Minute Analysis – Potential Bullish Breakout Towards 1.09524 📈
Key Observations:
Support Level: Around 1.08700, acting as a critical area for price action.
Resistance Zones: A key resistance area is visible around 1.09000 before reaching the target of 1.09524.
Moving Averages:
The 30 EMA (red) at 1.08747 is currently near price action, indicating short-term dynamic support.
The 200 EMA (blue) at 1.08601 suggests a broader trend still in transition.
Trendlines & Structure:
A downward trendline has been broken, and price is now retesting previous resistance-turned-support.
The expectation is a bounce from the support area leading to a potential bullish move.
Potential Trade Setup:
Bullish Scenario: If price holds above the 1.08700 support, a push toward 1.09524 could be expected.
Bearish Scenario: A failure to hold the support may indicate a return to the 1.08600 region.
EURUSD_SPT trade ideas

EUROUSD TRADING POINT UPDATE > READ THE CHPTIANBuddy'S dear friend
SMC Trading Signals Update 🗾🗺️ SMC-Trading Point update you on New technical analysis setup for Euro USD) Euro USD) Technical patterns choch looking for Bullish patterns support level 1.0866 Resistance level 1.09361 ) good luck guys 🤝
Key Resistance level 1.09361+ 1.09483
Key Support level 1.08802 - 1.08666
Mr SMC Trading point
Pales support boost 🚀 analysis follow)

lecture for option traderOption trading allows traders to profit from market movements using Call and Put options. Calls are used when expecting a price rise, while Puts are for a decline. Key strategies include Covered Calls, Iron Condors, and Spreads to manage risk. Understanding option Greeks (Delta, Theta, Vega, Gamma) helps in better decision-making. Mastering risk management is crucial for long-term success.

EURUSD MULTI TIME FRAME ANALYSISHello traders , here is the full multi time frame analysis for this pair, let me know in the comment section below if you have any questions , the entry will be taken only if all rules of the strategies will be satisfied. wait for more price action to develop before taking any position. I suggest you keep this pair on your watchlist and see if the rules of your strategy are satisfied.
🧠💡 Share your unique analysis, thoughts, and ideas in the comments section below. I'm excited to hear your perspective on this pair .
💭🔍 Don't hesitate to comment if you have any questions or queries regarding this analysis.

EURUSD - Emotion was wrong Perfect Setup Rule was RIGHTEURUSD 1W Fisher was in uptrend. 1D fall was limited due to 1W positive Fisher. But emotions prevailed over Perfect Setup Rule and the result was wrong observation in my previous post. This happened due to fast changing tariff and geopolitical related global scenario. And irony is that Right observation was within the prediction itself which was blatantly ignored by me. A minor fall in 1D Fisher only trigerred 1W TSI thus making the up move more strong in EURUSD. Emotions are very costly in trade decisions. Please see my previous post on EURUSD.
TAKEAWAY - Stick to Rules. Emotions will only ruin your trade.
WRONG ANALYSIS I MUST ADMIT: Here is the Text of Wrong Analysis (See the solution in problem itself) -
"With 3 Month and 1 Month Fisher Negative Crossover, 1W maximum
upside (KOD) is achieved. Perfect Setup in 1 Day where its upside target
has been achieved where Fisher has gone well above 0 and /TSI unable
to cross 0 and this is called FFFHTSI i.e. Full Fisher Half TSI.
It is going to fall so that a TSI double bottom on 1 Week Chart will be the extent of this fall.
Negative for few Weeks."
And this is why PERFECT SETUP RULE is so powerful for analysis.

Fibre/EURUSD ready to move higher...Hello traders!
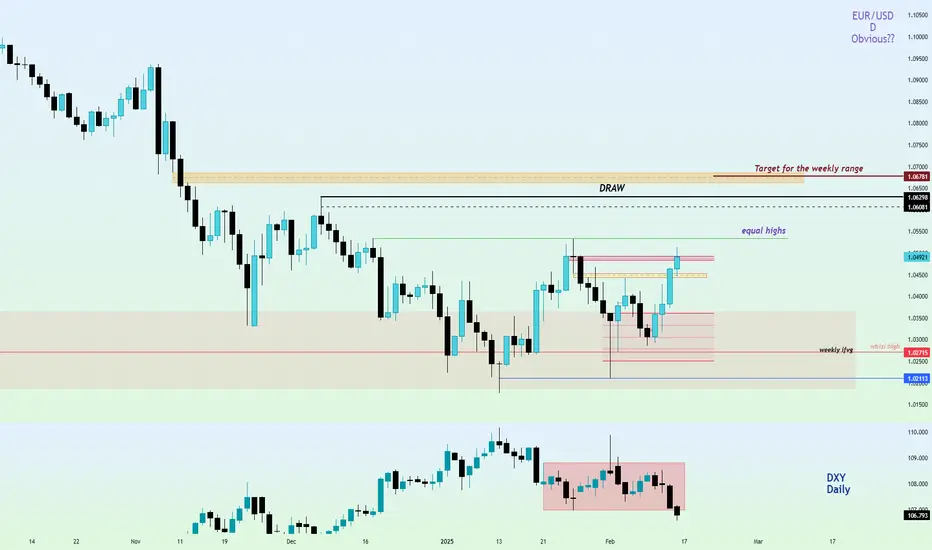
There is so much on the Daily chart of Fibre that points to obvious bullishness of the market that I could not place all of it on the chart. But I have marked what seemed crucial to be seen.
Market has taken smooth lows of 15th, 16th, 17th, & 20th January, 2025 and strongly rejected from 1.02113 . Also, observe how 20th January's daily candle shifted the market structure . We're inside a Bullish breaker on the daily, supported by a daily ifvg (check how the market has respected the consequent encroachment of that gap perfectly).
Things don't end here. DXY has broken the range to the downside with lower draws. Market symmetry is currently missing but Fibre should follow DXY soon.
The draw and the targets for the weekly range have been marked on the chart. Equal highs is the low hanging fruit.
Narrative is paramount when it comes to applying ICT concepts. That takes a lot of practice and time. Having said that, let's discuss when this idea will be marked as failed. 3 PDAs. If 3 PDAs fail on the daily timeframe, I'll not engage the market and wait for more feedback from the market.
Have a wonderful and learning-oriented week.
GLGT.
EUR/USD Trading Plan: Key Support, Resistance & Entry PointsAs we analyze the EUR/USD currency pair for March 11, 2025, we will look at multiple timeframes, key support and resistance levels, potential breakout points, and a detailed trade setup.
1. High-Quality Analysis: Overview
Recent economic data trends from both the Eurozone and the U.S. indicate continued divergence in monetary policy outlook, influencing the EUR/USD dynamics. The European Central Bank (ECB) is leaning towards a more hawkish stance due to persistent inflation, while the Federal Reserve (Fed) is more cautious, reflecting mixed economic signals.
2. Multiple Timeframe Perspectives
Daily Chart:
The daily chart shows that EUR/USD has been consolidating in a range between 1.0900 and 1.1000. A breakout above or below this range could set the trend for the next few trading sessions.
4-Hour Chart:
On the 4-hour chart, the price action shows minor spikes around 1.0930 - 1.0960, indicating short-term support and resistance levels within the larger daily range.
1-Hour Chart:
The hourly chart presents a more refined view of intraday movements, showing oscillations around 1.0950, indicating a potential pivot point for short-term traders.
3. Key Support and Resistance Levels
Support Levels:
1.0930: A crucial intraday support level showing previous price rejection.
1.0900: A significant psychological level and prior low.
Resistance Levels:
1.0960: A nearby resistance level that's been tested multiple times.
1.1000: A strong resistance level that aligns with the daily high.
4. Breakout Points
Bullish Breakout: A move above 1.0960 would confirm a bullish breakout, targeting higher levels such as 1.1000.
Bearish Breakdown: A fall below 1.0930 could lead to testing lower levels toward 1.0900.
Detailed Trade Setup
Trade Idea: Bullish Scenario
Based on the current analysis and outlook, we'll set up a bullish trade.
Entry Point:
1.0965: Just above the resistance level to capture momentum on a breakout.
Stop Loss (SL):
1.0945: Placed slightly below the support level at 1.0950 to limit potential losses.
Take Profit (TP):
1.0990: Targeting just below the strong resistance level at 1.1000 for a risk-to-reward balance.
Risk Management
Risk on Trade:
From entry at 1.0965 to the stop loss at 1.0945, the risk is 20 pips.
Potential Reward:
From entry at 1.0965 to take profit at 1.0990, the target is 25 pips.
Risk-Reward Ratio:
Risk-Reward Ratio: 1:1.25 (Risk of 20 pips for a potential gain of 25 pips).
Summary of Recommendations
Action: Buy EUR/USD
Entry: 1.0965
Stop Loss: 1.0945
Take Profit: 1.0990
Final Considerations
Market Sentiment: Monitor economic data releases, particularly from the U.S. and Eurozone, as these could impact existing positions.
Adjust Strategy: Be ready to adapt the trade setup based on real-time market developments, and use additional indicators (like RSI, MACD) for confirmation.
Stay Informed: Follow news on central bank developments and global geopolitical events that may influence market trends.

EUR/USD Trading Plan: Key Support, Resistance & Entry PointsThe EUR/USD currency pair is one of the most traded pairs in the world and is often influenced by various factors, including economic indicators, geopolitical events, and monetary policies from the European Central Bank (ECB) and the Federal Reserve (Fed). As of March 10, 2025, the pair has been showing volatility due to recent economic data releases, interest rate expectations, and market sentiment.
Daily Chart Analysis:
• Trend: The daily trend shows a bullish outlook, with the EUR/USD maintaining above the 200-day moving average.
• Key Levels:
o Support: 1.0900
o Resistance: 1.1050
4-Hour Chart Analysis:
o Trend: The 4-hour chart indicates a recent bullish correction after a small pullback.
o Key Levels:
Support: 1.0930)
Resistance: 1.1040
1-Hour Chart Analysis:
o Trend: Short-term gauges a consolidation phase.
o Key Levels:
Support: 1.0920
Resistance: 1.0990
Key Support and Resistance Levels
• Support Levels:
o 1.0900: Strong psychological level and previous resistance.
o 1.0850: Fibonacci level that provides additional support.
• Resistance Levels:
o 1.1050: Recent swing high, seen as major resistance.
o 1.1100: Upper bound of the recent trading range.
Breakout Points
• A breakout above 1.1050 could signal further bullish momentum, targeting 1.1100 and potentially higher levels, depending on broader market conditions.
• A breakdown below 1.0900 would indicate bearish sentiment, possibly retesting lower support levels at 1.0850.
Trade Setup
Trade Idea
Bullish Setup: Buy EUR/USD
• Entry Point: 1.0955 (confirmation above key resistance on the 1-hour or 4-hour)
• Stop Loss: 1.0920 (below the recent support level)
• Take Profit: 1.1050 (targeting the established resistance)
✅ #forex
✅ #forextrading
✅ #forexanalysis
✅ #forexsignals
✅ #fxtrading
✅ #trading
✅ #eurusd
✅ #eurusdforecast
✅ #eurusdanalysis
✅ #eurusdtrading
✅ #eurusdsetup
✅ #eurusdsignal
✅ #technicalanalysis
✅ #priceaction
✅ #supportandresistance
✅ #trendanalysis
✅ #chartpatterns
✅ #elliottwave
✅ #swingtrading
✅ #daytrading
✅ #scalping
✅ #riskmanagement
✅ #tradingpsychology
✅ #tradingview
✅ #forexcommunity
✅ #marketanalysis

EURUSD MULTI TIME FRAME ANALYSISHello traders , here is the full multi time frame analysis for this pair, let me know in the comment section below if you have any questions , the entry will be taken only if all rules of the strategies will be satisfied. wait for more price action to develop before taking any position. I suggest you keep this pair on your watchlist and see if the rules of your strategy are satisfied.
🧠💡 Share your unique analysis, thoughts, and ideas in the comments section below. I'm excited to hear your perspective on this pair .
💭🔍 Don't hesitate to comment if you have any questions or queries regarding this analysis.

EURUSD – The Perfect Catch at 1.02! (Heading Upside in Wave 3?)Patience rewarded! EURUSD dipped right into the 1.02-1.04 box zone as projected in Jan & March 2024, marking the completion of Wave C before delivering a powerful bounce to 1.08883! 📈🔥
How many of you held steady?
From 0.95358, we identified a leading diagonal wave, signaling a long-term uptrend. The retracement to 1.02-1.04 (50-61.8%) was all part of the base-building phase, preparing for the next major wave—Wave 3! 🚀
📉 Wave C = Wave A projection hit the zone at 1.03118!
📍 Low: 1.01766 (61.8% retracement nailed!)
📈 Bounce: 1.08883 – The move begins!
Now, as the foundation is set, is EURUSD ready for its next wonder wave—Wave 3? Let’s wait and watch the magic unfold!
📊 Check the previous TradingView idea & last tweet for reference!


Monstrous Volatility following Tariffs and NFP ForecastsHello Traders, It's that time of the month! :D Not what you are thinking.. But It's NFP Week! What an eventful week it's been already for the Euro. 450 Pips and we still have 3 more trading sessions to complete. I looked back two years and still did not find a week of matched volatility. A Major upside push has seen EurUsd tear it's way back from the depths of near Par (1.04) to well back inside the Monthly range between 1.104 and 1.056.
Trump Tarriff speeches, and fueled further by weak U.S. ADP data on Wednesday has given the Euro a monstrous exscuse to gain more value than it's seen in Years aginagst the dollar. Prepare for a wild end of the week with Jobs data forecasted to improve slighlty across the past data point.
What prices do we like moving into NFP day?
-Bullish targets are a tap into 1.08740, Weekly Resistaance Level
-Bearish targets could be 1.074
Otherwise we have some 1hr and 4hr Zones in the middle which could provide good risk/reward trade ideas.
Please leave a Rocket if you enjoyed and Follow for more Analysis.

**EUR/USD** daily chart ### **Market Analysis & Trading Plan (Long & Short Positions)**
#### **Technical Analysis Overview**
The **EUR/USD** daily chart, using **Heikin Ashi candles**, displays a significant price movement:
- **Trend Analysis:** The price was in a strong downtrend, staying below the **BB 104 0.1** (thick white band). Recently, the price has surged above **BB 104 0.1**, indicating a potential trend reversal.
- **Bollinger Bands (BB 20 1):** The price has broken above the **Upper Band 1 (UB1)**, signaling strong bullish momentum.
- **Momentum Shift:** The aggressive upward breakout suggests a potential overextension, increasing the likelihood of a short-term pullback.
---
### **Trading Plan**
#### **Long Position (L) Strategy:**
1. **Entry Conditions:**
- A retracement towards **LB1 (Lower Band 1 of BB 20 1)** or BB 104 0.1, confirming support.
- If price remains above **BB 104 0.1**, a dip buy opportunity may present itself.
- Monitor **DMI (+DI & ADX)** to confirm trend strength.
2. **Position Sizing:**
- If **SMA 104 slopes upward**, open **2/3 of the full position**.
- If the slope is neutral, reduce to **1/2 of the full position**.
3. **Exit Strategy:**
- **Partial Take Profit (TP1):** Near **UB1** (Upper Band 1).
- **Full Exit (TP2):** If price extends towards a key resistance level.
- **Stop Loss (SL):** Below **LB1** or BB 104 0.1 (depending on volatility).
---
#### **Short Position (S) Strategy:**
1. **Entry Conditions:**
- If the price extends far above **UB1**, indicating overextension.
- Look for **bearish confirmation signals** (e.g., rejection candles, divergence, or failure to hold above resistance).
- If **SMA 104 remains in a downtrend**, prioritize short opportunities.
2. **Position Sizing:**
- If the price remains in a **strong downtrend**, open **1/3 of the full position** or wait for further confirmation.
- If the price is near resistance but lacks clear bearish confirmation, avoid premature short entries.
3. **Exit Strategy:**
- **Partial Take Profit (TP1):** Near **MB (Middle Band of BB 20 0.2)**.
- **Full Exit (TP2):** If price retests **LB1** or support areas.
- **Stop Loss (SL):** Above the recent high or **UB2 (Upper Band 2)** to manage risk.
---
### **Final Considerations**
- **Market Structure Shift:** The breakout suggests a possible **trend reversal**, but confirmation is needed.
- **Dynamic Risk Management:** Adjust **position sizes** based on **SMA 104 slope and DMI signals**.
- **Scalability:** Use **position scaling** instead of full entry/exits to optimize risk-reward.

"EUR/USD Trading Plan: Key Support, Resistance & Entry PointsAs of March 6, 2025, the EUR/USD currency pair has experienced significant movements influenced by both fundamental developments and technical factors. Below is a comprehensive analysis incorporating multiple timeframe perspectives, key support and resistance levels, breakout points, and a detailed trade setup with clear entry and exit points, including take profit and stop loss levels.
Fundamental Overview
The euro has recently surged, marking its largest three-day rally since November 2022, rising 3.1% to $1.07. This uptick is attributed to increased European spending and a slowing U.S. economy. Germany's plans to exempt defense spending above 1% of GDP from its "debt brake" and establish a €500 billion infrastructure fund, along with a proposed €150 billion EU rearmament loan from the European Commission, have contributed to the euro's strength. Conversely, weak U.S. data and increased tariffs on Mexico, Canada, and China have weakened the U.S. dollar, with the dollar index hitting its lowest since November at 104.85.
Additionally, the European Central Bank (ECB) is set to cut its deposit rate to 2.50% on March 6, 2025, aiming to spur growth amid a sluggish eurozone economy and escalating trade tensions. This monetary easing stance is expected to influence the EUR/USD dynamics.
Technical Analysis
Monthly Timeframe:
The EUR/USD continues to trade within an ascending pitchfork formation extending from the 2022 low. The April advance previously faltered just ahead of resistance at 1.1275 into the close of Q2. The subsequent reversal was poised to close a third-consecutive monthly loss as of late December, with EUR/USD attempting to mark a close below support around the 2015 low at 1.0463.
Weekly Timeframe:
Recent price action shows a rebound from the 1.0200 level, which aligns with the 23.6% Fibonacci retracement of the broader uptrend. This area has acted as a significant support level, leading to the recent bullish momentum.
Daily Timeframe:
The pair is comfortably trading beyond the 1.0500 mark, slightly lower than the recent yearly highs around 1.0560. Immediate resistance stands at the 2025 top of 1.0559 (March 4).
Key Support and Resistance Levels
Support:
1.0463 (2015 low)
1.0200 (23.6% Fibonacci retracement)
Resistance:
1.0559
1.0939
1.1038
Trade Setup
Strategy: Given the recent bullish momentum and fundamental support, a long position is favored.
Entry Point: 1.08313
Take Profit: 1.0930 (just below the March high resistance)
Stop Loss: 1.0450 (below the 2015 low support)
Risk Management: This setup offers a risk-to-reward ratio of approximately 1:2, aligning with prudent trading practices.
Conclusion
The EUR/USD pair's recent surge is underpinned by both fundamental developments, such as increased European fiscal spending and anticipated ECB rate cuts, and technical factors, including rebounds from key support levels. Traders should monitor upcoming economic data releases and central bank communications closely, as these could influence the pair's trajectory. Adherence to the outlined trade setup and vigilant risk management are essential for navigating the current market environment
✅ #forex
✅ #forextrading
✅ #forexanalysis
✅ #forexsignals
✅ #fxtrading
✅ #trading
✅ #eurusd
✅ #eurusdforecast
✅ #eurusdanalysis
✅ #eurusdtrading
✅ #eurusdsetup
✅ #eurusdsignal
✅ #technicalanalysis
✅ #priceaction
✅ #supportandresistance
✅ #trendanalysis
✅ #chartpatterns
✅ #elliottwave
✅ #swingtrading
✅ #daytrading
✅ #scalping
✅ #riskmanagement
✅ #tradingpsychology
✅ #tradingview
✅ #forexcommunity
✅ #marketanalysis

Bill Ackman: The Activist Investor Who Challenges the Status Quo
Hello Traders!
Today, we’re going to explore the trading and investment philosophy of one of the most successful activist investors in the world – Bill Ackman . Known for his bold moves and unapologetic approach, Ackman has built a reputation for making large, influential investments and actively working to restructure companies in order to create value. With his hedge fund, Pershing Square Capital Management , Ackman has turned millions into billions by taking concentrated positions in underperforming companies, often pushing for changes that he believes will improve shareholder value.
Bill Ackman’s Investment Strategy
Ackman’s investing philosophy is rooted in a few key principles that have guided his success:
Activist Investing: Ackman is known for buying large stakes in companies and pushing for significant changes. This often involves changes in management, strategy, or financial structure to unlock value. He doesn’t just buy stocks, he buys control to influence the direction of companies.
Concentrated Bets: Unlike most fund managers who diversify, Ackman makes concentrated investments, believing in a small number of high-conviction ideas. He typically goes big on the companies he believes will give the highest returns.
Long-Term Vision: While Ackman is an activist, he is also a long-term investor. He’s known to hold onto stocks for years as he works through his plans to improve the companies he invests in.
Thorough Research and Analysis: Before making any moves, Ackman ensures he has done comprehensive research. He’s known for his deep dives into a company’s fundamentals, industry trends, and potential catalysts for growth.
Notable Investments and Activist Moves
Ackman’s career has been built on several high-profile, successful investments. Here are some of his best-known plays:
Herbalife: One of his most controversial investments, Ackman shorted Herbalife, claiming the company was a pyramid scheme. Despite facing heavy opposition and pressure, Ackman stuck to his position, although ultimately the trade didn’t work out as he anticipated. It became a case study in risk and persistence.
Target: Ackman took a large position in Target, pushing for changes in the company’s real estate strategy and retail business. His work with Target helped to bring greater shareholder value.
Valeant Pharmaceuticals: Ackman’s investment in Valeant Pharmaceuticals initially gained massive attention. Despite the stock’s later troubles, his involvement in the company drew attention to the power of activism and led to changes in leadership at Valeant.
Chipotle Mexican Grill: Ackman has also invested in Chipotle, pushing for operational improvements and better management. His efforts have been instrumental in driving changes in the company’s strategy, helping the stock recover from earlier setbacks.
Risk Management and Position Sizing
When it comes to risk management, Ackman follows a few key strategies to minimize losses and maximize returns:
Concentration of Capital: Ackman often places large amounts of capital in a few high-conviction investments. This allows him to have a significant impact on the companies he invests in but also requires disciplined risk management and careful positioning.
Leverage and Shorting: Ackman has used leverage in some of his more aggressive plays, such as shorting positions in Herbalife, to maximize returns. This adds a level of risk, but when used correctly, it can significantly amplify his gains.
Focus on Catalyst-Driven Events: He places his investments based on company-specific catalysts like management changes, mergers, or restructurings. This allows him to predict when a stock will outperform or underperform.
What This Means for Investors
Bill Ackman’s approach to investing is not for the faint of heart. It involves big risks and big rewards. His activist investing style is about taking concentrated positions, being willing to fight for change, and holding onto those investments for the long haul.
For investors, there are valuable lessons to be learned from Ackman’s strategies:
Don’t be afraid to make big bets. If you believe in a company’s long-term potential, be prepared to back it with significant capital.
Know the companies you invest in. Ackman is famous for his in-depth research before making any move. This is a lesson for every investor – do your homework before making investment decisions.
Take a long-term view. While Ackman is an activist, he is also a patient investor. He understands that meaningful change takes time, and he’s willing to wait for the payoff.
Conclusion
Bill Ackman’s approach to investing has made him one of the most influential investors of his time. By focusing on concentrated bets, thoroughly researching companies, and taking an activist role, Ackman has proven that bold moves and long-term vision can lead to great success.
Have you followed any of Bill Ackman’s investments or strategies? Share your thoughts and experiences in the comments below! Let’s learn and grow together!
Tags: activistinvesting, BillAckman, valueinvesting, stockmarket, investmentstrategies, hedgefund, riskmanagement, longterminvesting, traderpsychology
Title: Mastering Activist Investing with Bill Ackman: A Strategy for Big Returns

EUR/USD Trading Plan: Key Support, Resistance & Entry Points The European Central Bank (ECB) is anticipated to proceed with an interest rate cut, influenced by the U.S. administration's restraint from imposing broad trade tariffs. This expectation has solidified market sentiments towards monetary easing in the eurozone.
Key Support and Resistance Levels:
Support: 1.05946, 1.0574
Resistance: 1.0469
Trade Setup:
take profit 1.0700
sl 1.05800
echnical Analysis and Sentiment:
EUR/USD Rally: The EUR/USD pair surged 1.4% on Tuesday, climbing 140 pips in a single session as markets sold off the U.S. dollar amid expectations of tariff policy shifts.
Technical Indicators: According to Investing.com's technical analysis, the EUR/USD pair is currently exhibiting strong buy signals across various moving averages and technical indicators.
Alternative Scenario:
If the price fails to break above 1.0500 and shows signs of bearish reversal, consider entering a short position below 1.0480, with a take profit at 1.0376 and a stop loss at 1.0500.
Conclusion:
The EUR/USD currency pair is currently exhibiting bullish tendencies across multiple timeframes, supported by recent economic developments and technical indicators. Traders should monitor key levels and potential breakout points to capitalize on trading opportunities, ensuring proper risk management with well-defined entry and exit points.
✅ #forex
✅ #forextrading
✅ #forexanalysis
✅ #forexsignals
✅ #fxtrading
✅ #trading
✅ #eurusd
✅ #eurusdforecast
✅ #eurusdanalysis
✅ #eurusdtrading
✅ #eurusdsetup
✅ #eurusdsignal
✅ #technicalanalysis
✅ #priceaction
✅ #supportandresistance
✅ #trendanalysis
✅ #chartpatterns
✅ #elliottwave
✅ #swingtrading
✅ #daytrading
✅ #scalping
✅ #riskmanagement
✅ #tradingpsychology
✅ #tradingview
✅ #forexcommunity
@marketanalysis

GOING LONG FOR EUR/USD FOR SWING TRADE1. Market Structure & Bias:
Bearish to Bullish Transition: The price was in a clear downtrend but is now forming a possible reversal pattern.
Liquidity Sweep: The price has cleared previous lows, indicating potential accumulation by smart money.
Break of Structure (BOS): A bullish BOS is forming, signaling a shift in momentum.
2. Key ICT Concepts Applied:
Liquidity: The lower red line represents a liquidity zone where stop-losses of retail traders may have been taken.
Order Block (OB): A bullish order block is likely forming in the gray area, which could act as support.
Fair Value Gap (FVG): The price might fill inefficiencies before continuing higher.


"EUR/USD Trading Plan: Key Support, Resistance & Entry Points The EUR/USD pair has shown resilience below the 50% Fibonacci retracement level of the rally witnessed in February. The subsequent move above the 38.2% Fibonacci level suggests that the pullback from the 1.0525-1.0530 area has run its course. However, oscillators on the daily chart are yet to confirm a positive bias, warranting caution for bullish traders amid concerns about US President Donald Trump's tariff plans
Key Support and Resistance Levels
Support Levels:
1.0370: .
Resistance Levels:
1.0450: Fibonacci level.
1.0500: P
1.0525-1.0530:
Potential Breakout Points
Upside Breakout: A sustained move above the 1.0450 resistance level could lift spot prices to the 1.0500 psychological mark. Further strength beyond this level could challenge the 1.0525-1.0530 area,
Downside Breakout: A break below the 1.0432 support level could drag the EUR/USD pair to the 1.0330 region The downfall could extend further
Trade Setup
Based on the current technical landscape, a potential trade setup is as follows:
Entry Point: Buy at 1.0420.
Stop Loss: 1.0400.
Take Profit: 1.0530.
Fundamental Considerations
The EUR/USD pair will be in focus this week as the United States and Europe publish key economic numbers. Europe will release the preliminary consumer price index (CPI) data for February, with expectations of a slight decrease. Additionally, manufacturing and services PMI data from both regions will provide insights into economic performance.
Conclusion
The EUR/USD currency pair is at a critical juncture, with technical indicators suggesting potential bullish momentum, provided key resistance levels are breached. Traders should monitor fundamental developments, especially economic data releases and geopolitical events, as they can significantly influence market dynamics.
✅ #forex
✅ #forextrading
✅ #forexanalysis
✅ #forexsignals
✅ #fxtrading
✅ #trading
✅ #eurusd
✅ #eurusdforecast
✅ #eurusdanalysis
✅ #eurusdtrading
✅ #eurusdsetup
✅ #eurusdsignal
✅ #technicalanalysis
✅ #priceaction
✅ #supportandresistance
✅ #trendanalysis
✅ #chartpatterns
✅ #elliottwave
✅ #swingtrading
✅ #daytrading
✅ #scalping
✅ #riskmanagement
✅ #tradingpsychology
✅ #tradingview
✅ #forexcommunity
✅ #marketanalysis


EURUSD MULTI TIME FRAME ANALYSISHello traders , here is the full multi time frame analysis for this pair, let me know in the comment section below if you have any questions , the entry will be taken only if all rules of the strategies will be satisfied. wait for more price action to develop before taking any position. I suggest you keep this pair on your watchlist and see if the rules of your strategy are satisfied.
🧠💡 Share your unique analysis, thoughts, and ideas in the comments section below. I'm excited to hear your perspective on this pair .
💭🔍 Don't hesitate to comment if you have any questions or queries regarding this analysis.

EURUSD - PRE BREAKOUT CONSOLIDATION - ASCENDING TRIANGLESymbol - EURUSD
CMP - 1.0485
The EURUSD pair continues to display bullish signals, suggesting the potential for sustained upward movement. However, significant resistance lies ahead, and the market is currently undergoing a pre-breakout consolidation phase. The U.S. dollar is experiencing a corrective phase, influenced by economic data, domestic political developments, and indications from both President Trump and Federal Reserve Chairman Jerome Powell regarding the possibility of an imminent interest rate cut.
The euro is benefiting from the weakening dollar, though the duration of this trend remains uncertain, particularly in the context of the ongoing trade tensions between the U.S. and Europe.
From a technical perspective, the current chart suggests a bullish outlook. An ascending triangle is forming within the prevailing uptrend, generally indicative of market optimism. Key focus is placed on the pattern’s base, with resistance located at the 1.0530 level.
Support levels: 1.0450, 1.0400
Resistance levels: 1.0530
Should the dollar continue its downward trajectory, the pair is poised for potential growth. A retest of the trend support level, possibly marked by a false breakout, could occur before a decisive breakout. A successful breakout and sustained consolidation above the 1.0530 resistance level may trigger further upward movement.

