Psychology of Indian Traders – Short Real-Life Cases!Hello Traders!
India has one of the fastest-growing trading communities in the world.
But despite access to charts, tools, YouTube, and education, most retail traders still repeat the same emotional mistakes.
Here are a few short real-life cases that show how psychology shapes the journey of Indian traders more than any strategy or indicator.
1. The Salary Trader, “I Just Want to Recover My Losses”
A 28-year-old IT employee from Bengaluru started trading BankNifty options after watching influencers brag about profits.
He made ₹6,000 on his first day, and believed trading was easy income.
Then he lost ₹45,000 in two weeks. Instead of stopping, he kept trading bigger lots to recover.
Within 3 months, he wiped out his entire savings.
His mistake wasn’t strategy.
It was thinking recovery is more important than discipline.
2. The Overconfident Trader, “Market Mere Hisab Se Chalega”
A 33-year-old trader from Gujarat had one big lucky win in 2021 during the bull market.
He made ₹3.5 lakh in one week and believed he was naturally talented.
He increased his position size, stopped using stop loss, and ignored risk.
The next correction wiped out not just his profit, but his entire capital.
His mistake was thinking “luck = skill.”
3. The FOMO Trader, “Sab Log Le Rahe Hain, Main Kyun Chhodo?”
A young trader from Mumbai bought every trending coin, SHIB, PEPE, FLOKI, without checking charts or fundamentals.
He only entered after seeing pumps on Twitter.
He never bought dips, only tops.
Today, he holds a portfolio down 70%, waiting for “next bull run” to save him.
FOMO always makes you late.
4. The Quiet Winner, “Main Kam Karta Hun, Par Sahi Karta Hun”
A disciplined trader from Pune took only 2–3 trades a week.
He risked just 1% per trade, journaled every entry, and treated trading as a skill.
In 18 months, he grew his account slowly but consistently, without blowing up once.
He is not rich yet, but he is stable, confident, and improving every month.
Consistency beats speed, every time.
Rahul’s Tip:
Most Indian traders don’t need more indicators, they need more patience, more control, and more clarity.
Before learning complex setups, learn yourself.
Your psychology decides your wealth more than your strategy ever will.
Conclusion:
These real-life cases show one truth, the Indian market doesn’t destroy traders.
Their habits do.
If you want to be different, think differently.
Trade slow, trade smart, and build discipline before expecting profits.
If this post felt relatable, like it, share your story in comments, and follow for more real-world trading psychology lessons!
Trade ideas

Bullish sentiments on goldWe're in an uptrend so today we're trading from an h1 fvg targeting the opposite external liquidity....since London session we expect to see a continuation to the target.
OVERVIEW FOR TODAY - CHART H1 OVERVIEW
Price is currently sitting inside the POC zone – the area with the highest traded volume → the market usually consolidates here before choosing a direction.
Prior trend: Strong uptrend → distribution → correction.
The ascending trendline has been broken → short-term trend is bearish (downtrend).
Volume Profile shows the VAH above as strong resistance, and VAL below as strong support.
1: Price bounces from POC → moves up toward VAH (medium probability)
Conditions:
Price holds above the POC zone (~4000–4010).
Bullish price action appears (pin bar, engulfing, break of structure on H4).
Targets:
4120–4160 (VAH zone) → this is major resistance.
If VAH breaks → trend may resume upward with a larger target around 4300+.
Assessment:
Possible, but not the highest probability, because recent bearish momentum is still strong.
2: Price breaks below POC → retest → drops to VAL (HIGHEST PROBABILITY)
Current candles show strong rejection from VAH → falling directly into POC → bearish confirmation.
If D1 closes below the POC:
Bearish continuation becomes likely.
Targets:
3920–3950 (VAL zone) → very strong support.
Volume Profile thins out here → price tends to move quickly through this area.
Assessment:
This is the most likely scenario because:
✔ Trendline is broken.
✔ Weak bullish reaction at VAH.
✔ Volume Profile structure favors a move downward into VAL.
3: Price breaks below VAL → deeper drop toward Demand zone (low probability but dangerous)
Conditions:
D1 closes below 3920 (VAL)
Breaks the horizontal support.
Deep Targets:
3550–3600 (major Demand zone).
This is where the longer-term uptrend may recover.
Assessment:
Low probability, but if triggered → gold will make a sharp correction.
FINAL CONCLUSION
Highest probability: BEARISH continuation → drop toward VAL zone (3920–3950)
Because:
Strong rejection from VAH
Price sitting weakly on POC
Short-term structure turning bearish
[bTrading Suggestions
For short setups:
Look to sell on a retest of POC (4000–4010).
SL above VAH (4060–4080).
TP at VAL.
For long setups:
Only buy at VAL zone when clear reversals appear (pin bar, engulfing).
Avoid buying between POC → VAL.
⚠️ Disclaimer
All analyses and insights provided in this content are for informational purposes only and should not be considered financial advice. The financial market carries inherent risks, and every trader is fully responsible for their own decisions. Trade with a plan, discipline, and proper risk management.

Gold Turning BEARish #XAUUSD turning BEARish 🐻
Now at 4060.
SELL on RISE 🤞
Expecting significant downside moves
that may last for a couple of hours...
Until trades below 4064 weak trend wud remain
&
wud get intensified after crossing 4049-51 range...🤞
Expected to hit-
TP 1: 4041
TP 2: 4029
TP 3: 4019
SL: 4087

Gold Trading Strategy for 20th November 2025🟡 GOLD INTRADAY LEVELS – 30-Min Strategy
📈 BUY SETUP (Long Position)
🔸 Entry Condition:
Buy above the High of the 30-min candle after price closes above $4122.
💰 Targets:
🎯 $4132
🎯 $4145
🎯 $4160
📌 Notes for Traders:
Wait for a strong bullish candle close above $4122 to confirm the breakout.
Ideal if volume increases as the breakout happens.
Keep the trendline/market structure in view before executing.
📉 SELL SETUP (Short Position)
🔻 Entry Condition:
Sell below the Low of the 30-min candle after price closes below $4056.
💰 Targets:
🎯 $4044
🎯 $4032
🎯 $4018
📌 Notes for Traders:
Look for a strong bearish candle close below $4056.
Breakdown is more reliable if accompanied by increasing selling pressure.
Always confirm with momentum indicators (RSI, MACD, etc.) if possible.
⚙️ Risk Management (Highly Recommended)
🔒 Use Stop-Loss just below breakout candle for buys / above breakdown candle for sells.
📏 Risk–Reward ratio: Minimum 1:2.
💼 Avoid over-leveraging; trade only with allocated risk capital.
⚠️ Disclaimer
This information is provided only for educational and informational purposes.
It is not financial advice, and trading in gold or any financial instrument involves high market risk.
Always consult your financial advisor and trade at your own discretion.

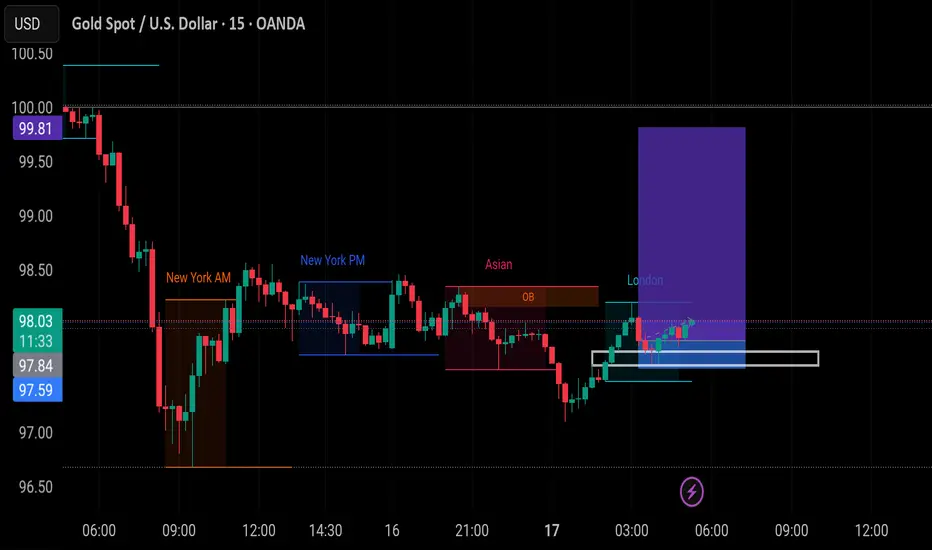
Gold 30-Min Chart: Sellers Active Near Resistance!Gold is once again testing its falling resistance trendline, which has already rejected the price several times in recent sessions. Each time the price touches this trendline, selling pressure increases, showing how strong this resistance zone is.
Currently, the price is near $4070–$4080, where short-term traders should stay alert. If the price fails to break above this resistance, a pullback toward the $4000–$3980 support zone looks likely. This area has previously acted as a strong demand zone, where buyers may re-enter.
However, if Gold breaks and sustains above this trendline resistance, we could see a fresh upside momentum building up toward $4115–$4135 levels. For now, the structure looks weak near resistance, and traders should wait for a clear breakout or rejection confirmation before taking any position.
Disclaimer: This analysis is for educational purposes only and should not be taken as financial advice. Please do your own research or consult your financial advisor before investing.
Analysis By @TraderRahulPal | More analysis & educational content on my profile.
If you found this helpful, don’t forget to like and follow for regular updates.

Gold XAUUSD – Fresh Resistance Tested Twice, Bears Eye 4057 PullGold gave us a clean reaction today, rejecting the 4107–4110 supply zone not once, but twice. That double tap reinforced a fresh resistance band at 4087–4095, where sellers stepped back in with intention.
As long as 4012 holds on the upside, this resistance zone remains my short-term line in the sand. Any push back into 4087–4095 may attract renewed selling pressure, keeping the door open for a move toward 4057, with momentum potentially extending lower if sellers stay in control.
I’ll be watching how price behaves on each revisit—structure remains king.
Your feedback drives our content and keeps everyone trading smarter. Let’s make those pips together! 🚀
Happy Trading,
– The InvestPro Team

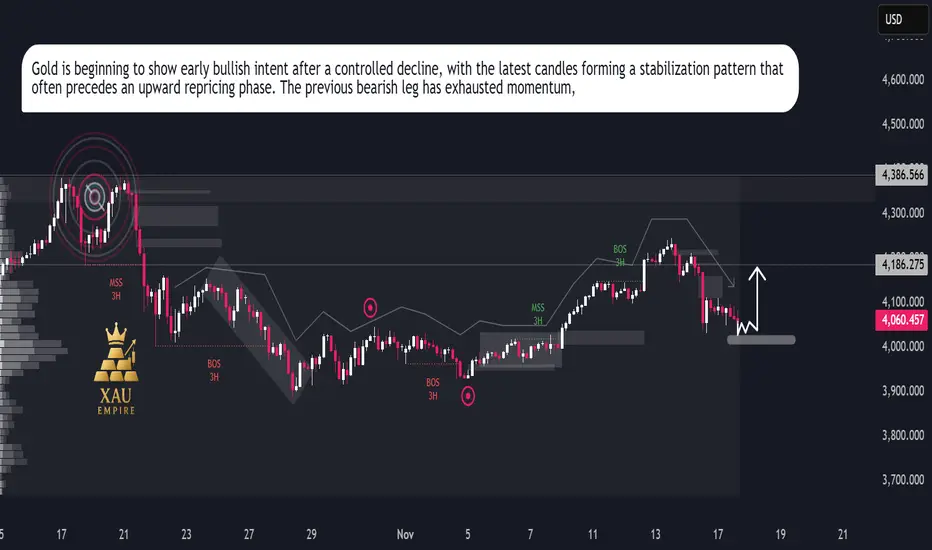
XAUUSD Repricing MoveXAUUSD Repricing Move
Gold continues to trade inside a broader corrective cycle, with price action showing a clear transition from prior strength into a short-term distribution phase. The chart highlights repeated breaks in market structure and shifts in order flow, signalling a controlled decline built on institutional rebalancing.
After the recent downside sweep, price is now hovering around a key reaction zone where liquidity has already been absorbed. Sellers dominated the previous swing, but the latest candles show a slowdown in bearish momentum, indicating that the market may be preparing for a corrective repricing attempt.
The volume footprint on the left side of the chart reflects previous heavy activity from major participants, and the current area sits beneath an inefficiency pocket that remains unmitigated. This opens the door for a short-term bullish rotation if buyers defend this accumulation region. The marked arrow in your chart aligns with a potential internal shift where gold could attempt a short retracement toward the mid-range of the prior move.
Momentum indicators embedded in the structure show reduced volatility, meaning the market may be positioning itself for a liquidity-driven bounce rather than continuing straight lower. The next sessions will reveal whether this zone becomes a launch point for a recovery leg or if the broader trend resumes its downward trajectory.
Gold Trading Strategy for Next Week✅ From the daily chart, gold closed with a large bearish candle, showing a clear decline. Short-term rebound pressure is heavy and market sentiment has turned bearish. The 4000 psychological level is the key support: if it holds, gold may continue to fluctuate within the upper range; if it breaks, the price may further fall toward 3930 or even the 3886 area for support. OANDA:XAUUSD
✅ From the 4-hour chart, gold is still in a corrective phase, and the overall structure remains weak. If the price can climb back above the key moving averages, bulls still have a chance to repair the structure; if not, bears will continue to dominate, and the probability of further downside increases.
✅ From the 1-hour chart, the short-term structure has already formed a Head and Shoulders top, and the rebound strength is limited. If gold cannot break above 4150 next week, the current rebound will form the right shoulder, creating continued downward pressure. After Friday’s sharp drop, gold is expected to see a technical rebound early next week, and the next move will depend on the strength of that rebound.
🔴 Resistance Levels: 4110–4120 / 4140–4150
🟢 Support Levels: 4030–4050 / 4000–3970
✅ Trading Strategy Reference:
🔰 If gold rebounds to 4110–4120 and meets resistance, consider light short positions. The target can be set at 4050–4030. If the decline continues, further targets are 4000 and 3930–3887.
🔰 If gold rebounds to 4140–4150 and faces rejection, high-position shorts can be taken, targeting 4100–4080.
🔰 If gold pulls back to 4035–4040 and stabilizes, consider low-position longs, targeting 4060–4080.
✅ Overall, next week’s short-term gold trading should focus on selling the rebounds, with buying on dips as a secondary approach. If gold fails to break above 4150, the Head and Shoulders top pattern will be confirmed, and the bearish trend is expected to continue.
GOLD / XAUUSD - Classic Example of Liquidity GRAB
TF: 30 Minutes
CMP: 4075
GOLD and Silver seem to have completed the corrective rise and ready to tumble down.
In case of GOLD, price got rejected from the 50% fib level of the A leg and now resuming the C leg down.
The channel, possible price action etc, all are marked in the chart published herein.
In addition, the classic example of Liquidity GRAB concept is explained in the charts below.
The alternate case is that, in this 4th wave (larger degree TF), GOLD could be forming a Triangle (3 subwaves within the abcde triangle wave) and then move higher.
Either case, price should be testing the recent swing lows soon.
It purely depends on how the buyers would react when the price reaches 3900 levels..
My Bias is on the Simple ZIG/ZAG ABC correction to move below 3700 USD
Lets review the moves at each of the levels to come.
Disclaimer: I am not a SEBI registered Analyst and this is not a trading advise. Views are personal and for educational purpose only. Please consult your Financial Advisor for any investment decisions. Please consider my views only to get a different perspective (FOR or AGAINST your views). Please don't trade FNO based on my views. If you like my analysis and learnt something from it, please give a BOOST. Feel free to express your thoughts and questions in the comments section.

Order Blocks Simplified — How Institutions Control Price🔥 Order Blocks Simplified — How Institutions Control Price
Order Blocks are one of the most important concepts in modern trading — because they show where institutions place REAL positions, not where retail traders guess. 🏦📊
When you understand Order Blocks, you stop chasing random candles and start reading the footprints of smart money. Let’s simplify it. 👇✨
📌 What Is an Order Block? 🧱💰
An Order Block (OB) is a price zone where big institutions (banks, hedge funds, market makers) place massive orders.
These zones often appear before strong market moves — because that’s where smart money builds positions.
Think of an Order Block as:
🔹 The origin of a powerful move
🔹 A zone where price reacts repeatedly
🔹 A region that creates imbalance and momentum
🔹 A point where institutional orders remain unfilled
Once price returns to that zone, institutions fill the rest of their orders, causing another strong reaction. ⚡📈📉
📌 Why Do Order Blocks Matter? 🧠🔥
Because institutions control 80%+ of market volume — not retail.
So when they accumulate or distribute positions:
📈 Trends are born
📉 Reversals appear
🌊 Momentum shifts
💥 Big candles print
Order Blocks give you insight into:
✔️ Where big players enter
✔️ Where real support/resistance exists
✔️ Why price reverses at specific zones
✔️ Where high-probability trades form
It’s the closest thing to tracking the “big money blueprint.”
📌 How Order Blocks Form 🛠️📊
Order Blocks are created during periods of:
🔸 Accumulation (smart money buys quietly)
🔸 Distribution (smart money sells quietly)
Then price explodes away from that zone, showing that a major order cluster was executed.
This explosive move creates:
🔥 Imbalance (FVG)
🔥 Break of structure (BOS)
🔥 A directional trend
These are all signs of institutional activity.
📌 Types of Order Blocks 🟥🟩
🟥 Bearish Order Block (B-OB)
The last bullish candle before a strong bearish move.
It marks institutional selling.
🟩 Bullish Order Block (B-OB)
The last bearish candle before a strong bullish move.
It marks institutional buying.
Both act as high-probability reaction zones.
📌 How Institutions Use Order Blocks 🎯🏦
Institutions don’t enter all at once — their orders are too large.
So they:
1️⃣ Place part of their order
2️⃣ Push price away
3️⃣ Wait for retracement
4️⃣ Fill the rest at the same zone
That zone = the Order Block.
Price returning to an OB is not random — it’s smart money completing their business. 💼✨
📌 How You Trade Order Blocks 🧘♂️📈
✔️ Identify the strong move
Big displacement = institutional interest. 🚀
✔️ Mark the Order Block candle
The last opposite candle before the move. 🔍
✔️ Wait for price to return
Smart money loves to rebalance orders. 🔁
✔️ Enter with confirmation
Candles + structure + reaction = high probability. 🎯
Order Blocks are not predictions — they are reaction zones with a smart-money edge.
📌 Why Order Blocks Work So Well 🌟
Because they are built on:
💧 Liquidity
🧠 Smart Money Behavior
📊 Market Structure
⚡ Supply & Demand
🔥 Institutional Order Flow
This is why OBs outperform classic support/resistance.
They show institutional reality, not retail imagination.
✨ Final Thoughts: The Power of Order Blocks 🚀
Once you learn Order Blocks, everything becomes clearer:
✔️ You know where big money enters
✔️ You know where to wait for price
✔️ You stop chasing bad trades
✔️ You trade WITH smart money
✔️ You catch cleaner, stronger moves
Order Blocks are the foundation of modern price action — simple, powerful, and deeply effective. 🔥📈
Automated AI Trading1. What is Automated AI Trading?
Automated AI trading is a system that uses machine-learning models to identify market patterns, predict price movements, and execute trades without human intervention. It operates on:
Data (price, volume, order flow, macro news, sentiment)
Logic (rules, model predictions, risk parameters)
Execution engines (API connectivity with brokers/exchanges)
Feedback loops (continuous learning and improvement)
Unlike traditional algo trading, which follows fixed mathematical rules (e.g., moving average crossover), AI-driven trading systems learn from data, recognize non-linear relationships, adapt to different market regimes, and evolve over time.
How AI differs from simple algos:
Traditional Algo Trading AI-Driven Trading
Follows fixed rules Learns from millions of data points
Struggles in changing markets Adapts to new volatility and structure
Limited to indicators Understands patterns, order flow, sentiment
No self-improvement Continuously improves via ML models
This shift is why the world’s biggest hedge funds—Citadel, Renaissance, Two Sigma—rely heavily on AI-powered trading.
2. Core Components of Automated AI Trading
**1. Data Collection Systems
AI learns from large amounts of data such as:
Historical price data (candles, ticks)
Volume profile and order-book data
News articles, macro releases
Social media sentiment
Company fundamentals
Global market correlations (Forex, commodities, indices)
The more accurate the data, the more powerful the AI.
2. Machine-Learning Models
AI trading uses models like:
Supervised learning → Predicting future prices from historical patterns
Unsupervised learning → Detecting hidden clusters and regimes
Reinforcement learning → Teaching models how to “reward” profitable actions
Deep learning → Working on complex and high-dimensional inputs (order flow, charts)
For example, a reinforcement learning model may learn to buy dips in a rising market and fade breakouts in a choppy market because it has “experienced” millions of simulated trades.
3. Strategy Engine
This links model predictions to market actions. It includes:
Entry signals
Exit signals
Stop-loss and target placement
Position sizing
Hedging decisions
Time-based rules
Even if the AI predicts a bullish move, the strategy engine decides:
how much capital to deploy,
how many trades to execute,
whether to trail SL or take partials,
whether to hedge via options.
4. Order Execution Engine
This is the part that actually executes trades through APIs. It handles:
Slippage control
Spread detection
Smart order routing
Latency optimization
High-frequency micro-decisions
Professional systems place orders in milliseconds to take advantage of liquidity pockets.
5. Feedback & Reinforcement System
AI trading bots track every action:
Did the model react correctly?
Was there unnecessary drawdown?
Did volatility shift?
Did correlations break?
These results feed back into the learning cycle, making the system smarter.
3. How Automated AI Trading Works Step-by-Step
Here’s a simplified version of how an AI system might trade Nifty or Bank Nifty:
Data Input:
The AI collects candlesticks, volume profile, India VIX, global cues (SGX/GIFT Nifty), news sentiment, and order-flow metrics.
Prediction:
The model predicts probabilities such as:
Market trending or ranging
Expected volatility
Direction bias (up/down/neutral)
Strength of buyers vs sellers
Signal Generation:
If the AI believes there is a 70% chance of an upside breakout based on VWAP deviation, delta imbalance, and global sentiment, it triggers a buy signal.
Risk Management:
The AI sets SL based on ATR or structure, adjusts position sizing based on volatility, and may hedge using options if needed.
Execution:
Orders are placed instantly at the best liquidity point, often slicing orders to reduce slippage.
Monitoring & Adaptation:
If volatility spikes due to news, the AI tightens stops or exits early.
Feedback Learning:
After the trade, the outcome is fed back into the model to refine future decisions.
This continuous loop is what makes AI trading so powerful.
4. Types of AI Trading Strategies
AI systems can run multiple strategy categories simultaneously:
1. Trend-Following AI Strategies
They identify trending markets using ML-based pattern recognition.
Useful for:
Indices
FX
Commodities
2. Mean Reversion AI Strategies
The AI detects overextensions or liquidity vacuum areas.
Excellent for:
Low-volatility equities
Options premium selling
3. High-Frequency Trading (HFT)
AI reads order-book microstructure and executes trades in milliseconds.
4. Arbitrage & Statistical Arbitrage
The system scans correlated assets (e.g., Nifty–BankNifty, Gold–USDINR) and identifies mispricing.
5. Option Trading AI Models
They use Greeks, IV crush patterns, gamma exposure, and flow data to:
Sell premium during low volatility
Buy options during breakout volatility expansions
Hedge positions dynamically
5. Advantages of Automated AI Trading
1. Eliminates Emotional Trading
Fear, greed, revenge trading, and FOMO are removed completely.
2. Faster Decision Making
AI can scan hundreds of markets in milliseconds.
3. High Accuracy in Pattern Recognition
It sees relationships invisible to human eyes.
4. Consistency
AI follows rules perfectly 24/7 with no fatigue.
5. Ability to Adapt
Markets shift from trending to ranging, from low to high volatility—AI systems detect these shifts early.
6. Better Risk Management
AI adjusts SL, TS, exposure, and hedging dynamically.
6. Limitations of Automated AI Trading
Despite its power, AI trading has practical challenges:
1. Overfitting Risk
Models may memorize old data and fail in live markets.
2. Regime Changes
AI trained on low-volatility years might struggle during black-swan events.
3. Technology Costs
High-quality data, GPUs, and low-latency infra are expensive.
4. Black-Box Nature
Many AI decisions lack transparency—difficult to interpret.
5. Dependency
Traders relying too much on bots may lose market intuition.
7. The Future of Automated AI Trading
The next era will combine:
AI + Market Structure
Using volume profile, liquidity zones, order-flow imbalance.
AI + Global Macro Intelligence
Models that read FOMC statements, inflation prints, and currency flows.
AI + Voice/Chat Interfaces
Traders will speak: “AI, manage my Nifty long, hedge with a put spread,” and the system will execute.
AI-Driven Portfolio Automation
Fully autonomous wealth-management engines.
We are entering a world where AI will not assist traders—it will act as a complete trading partner.
Conclusion
Automated AI trading is transforming financial markets by combining vast data processing, machine learning, and rule-based automation. It removes human emotion, enhances precision, adapts to market shifts, and executes strategies with high speed. While it comes with limitations like overfitting and model opacity, the benefits far outweigh the challenges. Whether you trade indices, equities, commodities, or options, AI will play a central role in future trading success.

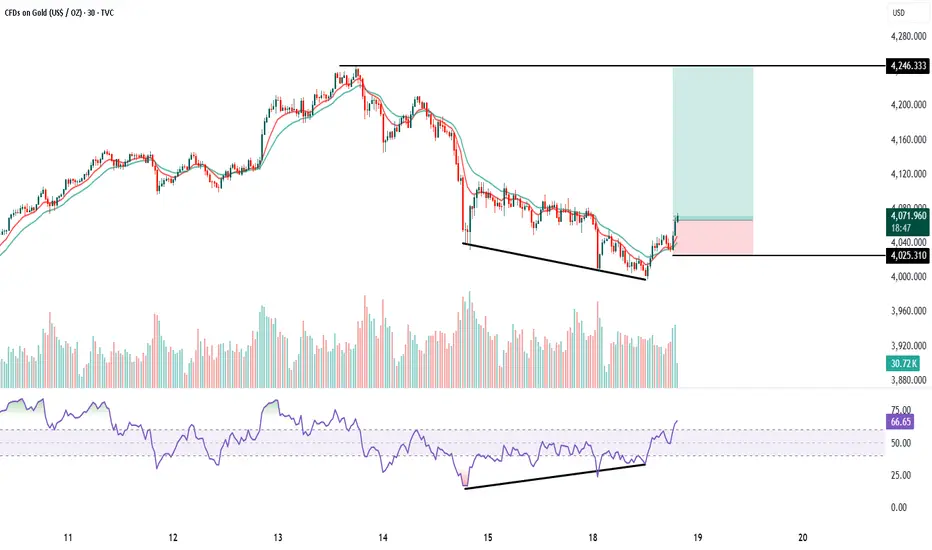
GOLD 30 Min chart analysis1. Trend : Price was in a downtrend with continuous lower highs and lower lows. Now the chart is showing a falling wedge pattern, which is a bullish reversal pattern. Breakout candle is visible with strength, indicating trend reversal from bearish to bullish on the 30-minute timeframe.
2. Volumes: Volumes remained average during the fall.
At the breakout zone, you can see volume expansion, which confirms buyers are stepping in.
This supports a valid bullish breakout.
3. Momentum (Price Action + EMAs): Price is crossing above the 10 EMA and 20 EMA, and both EMAs are starting to turn upward. This shows momentum shift from sellers to buyers. Momentum candles at breakout confirm the start of an upward move.
4. RSI Divergence: Price made lower lows, but RSI made higher lows.
This is a classic bullish divergence, indicating selling pressure is weakening. RSI has now moved above 60, confirming momentum is picking up strongly.
Buy above 4075 after the breakout candle closes above falling wedge.
This ensures confirmation and avoids a false breakout.
Keep SL just below wedge support: SL = 4025
Target : The major horizontal resistance shown on the chart is:
Target = 4246 This is also the measured move of the wedge, matching the resistance zone.
Risk–Reward: RR is approximately 1:3 to 1:3.5, which is ideal for breakout trades. This is a high-probability trend-reversal breakout setup with a clear target and safe stop loss.
XAUUSD MULTI TIMEFRAME ANALYSIS Hello traders , here is the full multi time frame analysis for this pair, let me know in the comment section below if you have any questions , the entry will be taken only if all rules of the strategies will be satisfied. wait for more price action to develop before taking any position. I suggest you keep this pair on your watchlist and see if the rules of your strategy are satisfied.

PCR Trading Strategies How Option Contracts Work
Options have three crucial components:
1. Strike Price
The price at which the buyer can buy or sell the asset.
2. Expiry Date
The date when the option contract becomes invalid (weekly/monthly expiry in India).
3. Premium
The cost of buying the option.
Buyers pay the premium.
Sellers (writers) receive the premium.
Premium fluctuates based on demand, volatility, and time remaining.

XAUUSD MULTI TIMEFRAME ANALYSIS Hello traders , here is the full multi time frame analysis for this pair, let me know in the comment section below if you have any questions , the entry will be taken only if all rules of the strategies will be satisfied. wait for more price action to develop before taking any position. I suggest you keep this pair on your watchlist and see if the rules of your strategy are satisfied.

Part 3 Learn Institutional Trading Option Buyers
Pay premium.
Have limited risk (premium loss).
Have unlimited profit potential (in theory).
Bet on directional moves.
Option Sellers (Writers)
Receive premium upfront.
Have limited reward (premium earned).
Can face significant or unlimited risk.
Bet on time decay, sideways markets, or low volatility.

Part 12 Trading Master Class With Experts Types of Options
There are two primary types:
1. Call Option (CE)
A call option gives the buyer the right to buy the asset at a predetermined price (strike price).
Buyers profit when the underlying price goes up.
Sellers profit when the price stays below the strike.
2. Put Option (PE)
A put option gives the buyer the right to sell the asset at the strike price.
Buyers profit when the underlying price goes down.
Sellers profit when price stays above the strike.

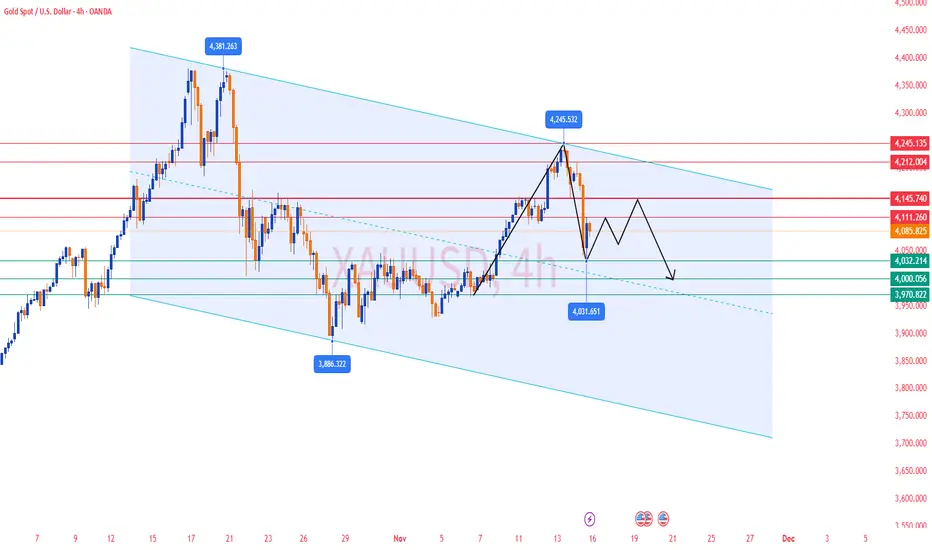
Gold Analysis & Trading Strategy | November 17-18✅ From the 4-hour chart, after gold topped at 4245, the price continued to break downward and is still trading below all short-term moving averages (MA5 / MA10 / MA20). This indicates that the larger-cycle bearish trend remains intact.
MA5 < MA10 < MA20 — the bearish alignment is clear, and every rebound has been suppressed near MA10 (4110).
💹 Bollinger Bands:
The lower band continues to extend downward, the middle band (around 4146) is sloping lower, and the lower band has moved down to 4035.
Gold is currently oscillating weakly near the lower band, suggesting that the market is still releasing downside momentum and the lower support has not stabilized.
✅ From the 1-hour chart, gold has been unable to hold above MA20 (around 4084).
MA5 and MA10 are pressing downward, while MA20 and MA60 act as strong resistance. Each rebound candle shows an upper wick, indicating heavy selling pressure.
The 1-hour timeframe is a weak consolidation and there is no valid sign of bottoming or reversal.
💹 Bollinger Bands:
The bands are narrowing at the lows, with the middle band (around 4084) moving sideways.
The market is consolidating at low levels and may choose a direction soon — with a higher probability of continuing downward in line with the main trend.
🔴 Resistance Levels: 4110–4120 / 4140–4150
🟢 Support Levels: 4060–4050 / 4032–4035
✅ Trading Strategy Reference:
🔰 If gold rebounds to 4110–4120 and meets resistance, consider light short positions. The target can be set at 4050–4030. If the decline continues, further targets are 4000 and 3930–3887.
🔰 If gold rebounds to 4140–4150 and faces rejection, high-position shorts can be taken, targeting 4100–4080.
🔰 If gold pulls back to 4035–4040 and stabilizes, consider low-position longs, targeting 4060–4080.
🔥Trading Reminder: Trading strategies are time-sensitive, and market conditions can change rapidly. Please adjust your trading plan based on real-time market conditions.

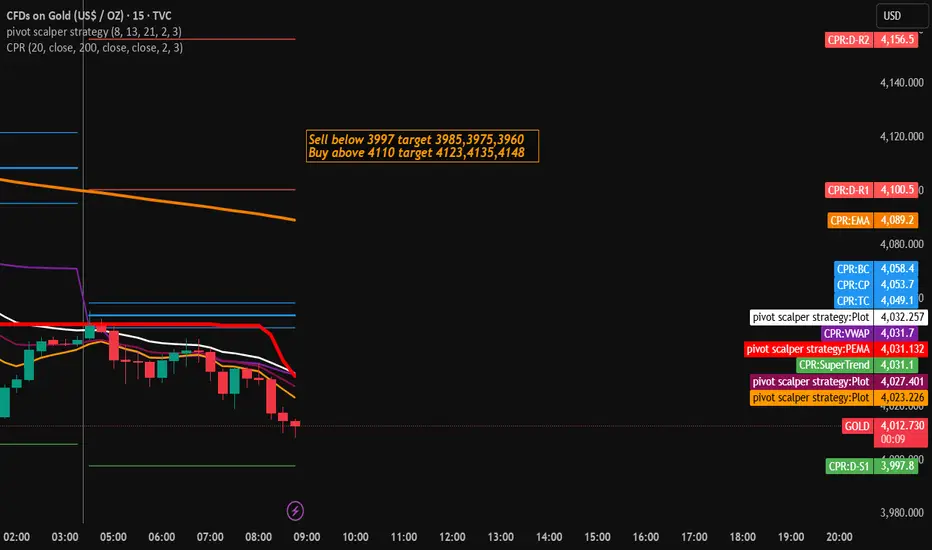
Gold Trading Strategy for 18th November 2025✨ XAUUSD (Gold) Intraday Trade Setup ✨
(Price levels based on your strategy plan)
🔻 SELL Setup (Below 5-min Candle Low)
📉 Sell Below: $3,997 (only if a 5-minute candle closes below this level)
🎯 Targets:
TP1: $3,985
TP2: $3,975
TP3: $3,960
🛡️ Suggested Stop-Loss: Above the breakdown candle high or above $4,005 (safety buffer).
📌 Trade Logic:
A 5-minute candle closing below $3,997 confirms bearish momentum and opens the path toward intraday support levels. Targets are placed at logical liquidity zones.
🔺 BUY Setup (Above 15-min Candle High)
📈 Buy Above: $4,070 (only if a 15-minute candle closes above this level)
🎯 Targets:
TP1: $4,083
TP2: $4,095
TP3: $4,110
🛡️ Suggested Stop-Loss: Below the breakout candle low or below $4,055 (safety buffer).
📌 Trade Logic:
A 15-minute candle closing above $4,070 signals bullish strength. The upside levels represent potential liquidity and resistance zones.
⚠️ Disclaimer
📜 This analysis is for educational and informational purposes only.
💼 This is not financial advice and should not be considered a buy or sell recommendation.
📊 Trading involves significant risk. Always do your own analysis and use proper risk management.
Gold NY Session Strategy 11/19: Will up to 4162Gold Daily Plan – SMC Outlook (Nov 20)
Framework: CHoCH – BOS – FVG – POI – Premium/Discount Model
1. Market Context
Gold continues to recover after the sharp drop earlier this week. Price is now approaching the Premium zone of the current bullish swing and tapping into H1 supply. The market shows:
Buyers still in short-term control
Momentum weakening as price reaches resistance
A corrective pullback into Discount is likely before any further expansion
2. Structural Overview (SMC Logic)
🔻 Overall Market Structure
A key BOS formed around 4090–4100 → confirms short-term bullish structure
Follow-up CHoCH signals continuation of the intraday uptrend
Price is moving toward the upper FVG + Supply Zone (4160–4162)
🔸 Orderflow Notes
Strong reaction at the 4140 area → clear presence of passive Sell Limit absorption
Demand POI at 4091–4089 held exceptionally well → main bullish mitigation zone
3. Trading Zones (POI)
✅ BUY Zone (Discount Area)
4091 – 4089
Demand + previous CHoCH + fib 1.272 confluence
Ideal low-risk long setup within Discount
Suggested SL: 4087
BUY Scenario:
Price retraces to POI → shows bullish reaction → long toward Premium.
❗️ SELL Zones (Premium Area)
Aggressive Sell Zone:
4143 – 4145
SL: 4147
Optimal Sell Zone:
4160 – 4162
Major supply + imbalance + fib 2.618 extension
Highest probability for reversal
SL: 4165
4. Trade Scenarios
📌 Primary Scenario (High Probability)
Price retraces into 4091–4089 Demand
Look for CHoCH/BOS confirmation on lower timeframe
Enter BUY → target 4143 → 4160
→ Classic SMC model: Buy from Discount → Sell from Premium.
📌 Alternative Scenario
If price rallies straight into 4143–4162 without retracement:
ONLY enter SELL when a clear bearish CHoCH or strong rejection forms
Target: 4100 → 4090
5. Intraday Bias
→ Bullish in Discount zones – Bearish in Premium zones.
Trade based on orderflow → Do not chase price in the middle range.
6. Summary
BUY: 4091–4089 (SL 4087) → TP: 4140 – 4160
SELL:
• 4143–4145 (SL 4147)
• 4160–4162 (SL 4165)
Wait for confirmation at each POI; avoid mid-range entries.

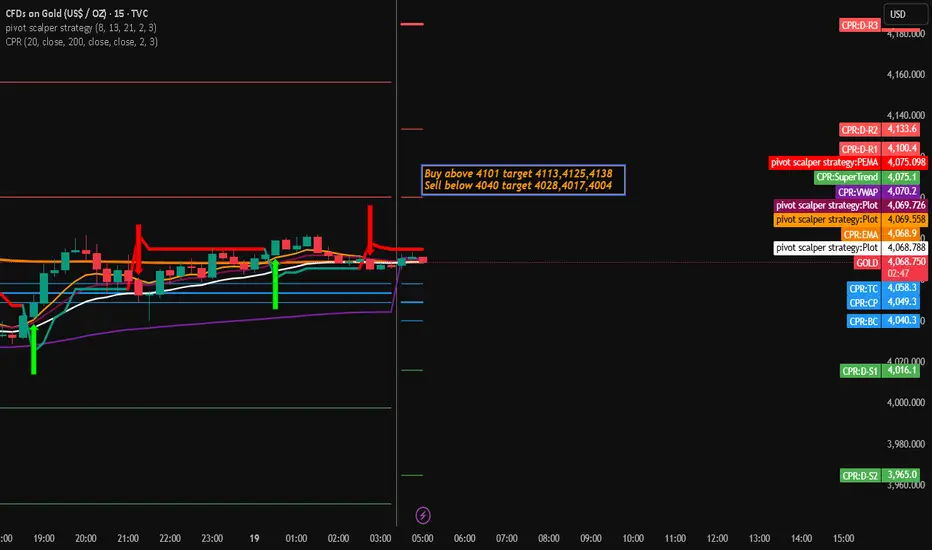
Gold Trading Stategy for 19th November 2025📈 Gold Trading Setup 💰
Buy Setup 🟢
Condition: Enter Buy if Gold (XAU/USD) closes above the high of the 15-minute candle.
Entry Level: Above 4101
Targets:
Target 1: 4113
Target 2: 4125
Target 3: 4138
Sell Setup 🔴
Condition: Enter Sell if Gold (XAU/USD) closes below the low of the 1-hour candle.
Entry Level: Below 4040
Targets:
Target 1: 4028
Target 2: 4017
Target 3: 4004
🛑 Important Disclaimer 📉
This is not financial advice. Trading involves substantial risk and may not be suitable for all investors. Only trade with capital you can afford to lose.
Do your own research (DYOR) before making any trading decisions.
Past performance is not indicative of future results.
Market conditions can change rapidly, and no strategy is foolproof.
Always use appropriate risk management, including stop-loss orders.
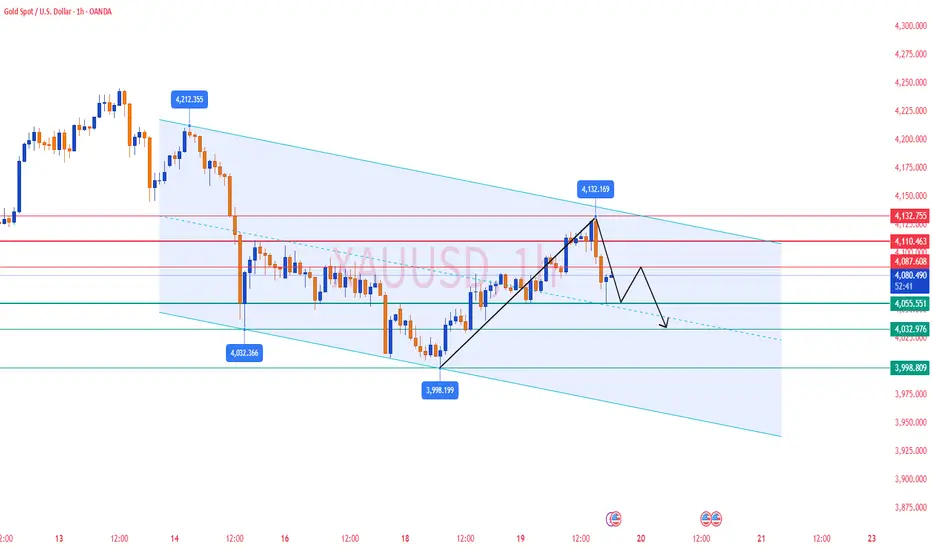
Gold Analysis & Trading Strategy | November 19-20✅ From the 4-hour chart, gold experienced a strong rebound yesterday, releasing some short-term bullish momentum. However, the price encountered significant resistance near 4132 (previous high + upper Bollinger Band).
The latest candle shows a large bearish candle with a long upper wick, which is a classic signal of bulls failing to break higher and profit-taking pressure intensifying.
MA5 and MA10 have started to turn downward, indicating weakening short-term momentum.
MA20 (around 4089) still provides partial support, but it has already been broken through quickly.
The upper Bollinger Band (around 4130) remains a strong resistance level, with price quickly falling below the mid-band after the spike.
The lower wick touched 4055, suggesting that short-term buying interest exists in this area.
The short-term rebound structure has been damaged, and the 4-hour timeframe has entered a corrective phase turning weaker again.
If gold breaks below 4058–4050, bearish momentum will strengthen further.
✅ On the 1-hour chart, gold formed a short-term high at 4132, followed by a sharp sell-off.
Two consecutive large bearish candles broke below MA5 / MA10 / MA20 / MA60, forming a classic one-sided reversal signal.
The bullish structure is completely broken, and moving averages have shifted back into a bearish alignment.
Key support lies at 4050–4049, a strong confluence support zone. Breaking below this area will open further downside potential.
The current small rebound is weak and only a technical correction, showing that bears still dominate the short-term price action.
The rebound only reached below MA20 (around 4085), showing that selling pressure above remains strong.
Short-term structure is bearish, and any weak rebound is unlikely to break above 4085–4090. After the rebound, price is still likely to retest the 4050 area.
🔴 Resistance Levels:4085–4090 / 4100–4110 / 4125–4132
🟢 Support Levels:4058–4050 / 4030 / 3998
✅ Trading Strategy Reference
🔰 Strategy 1: Short at 4085–4090 (Main Idea)
If gold rebounds to 4085–4090 and shows resistance:
Light short positions
Stop-loss: 4098
Targets: 4060 / 4050
👉 Current trend is bearish; selling rebounds is the main logic.
🔰 Strategy 2: Short again at strong resistance (Aggressive Short)
If gold rebounds to 4100–4110:
Medium-sized short positions
Stop-loss: 4118
Targets: 4065 / 4050
👉 This area is strong resistance; short-term breakout probability is low.
🔰 Strategy 3: Breakout shorts below 4050 (Trend-following)
If price breaks 4050:
Bearish momentum will accelerate
Targets: 4030 / 4000
👉 4050 is the key level determining whether bears will continue the downward move.
📌 Summary
4H rebound was rejected; structure turning weaker
1H shows a sharp breakdown; bears dominate short-term price action
4085–4090 is the main zone for selling rebounds
4050 is the most important support today—breaking it will open deeper downside