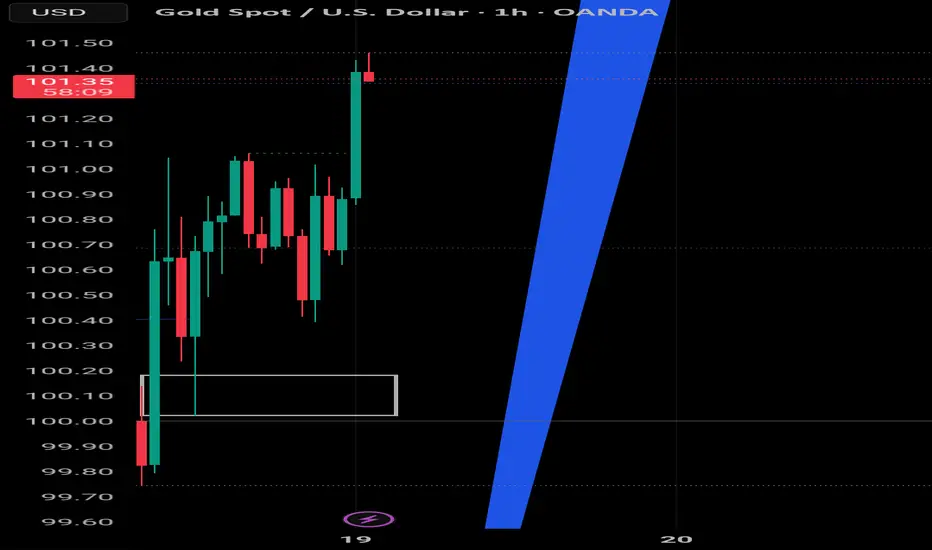
WEEKLY PROFILE ON GOLDGold opened and made a weekly low on Monday and later stop hunt it on Tuesday before it broke structure to make a market structure shift (MSS) now we expect to see a distribution phase FOR THE REST OF THE WEEK to the upside to the level 105.00.
Trade ideas

XAUUSD Weekend Analysis Nov 19,2025
Looking at the chart, the market is still moving inside a broad descending channel, and the price is currently sitting just below a major trendline that has been acting as resistance for some time. Every attempt to break above it has been rejected, which tells us that sellers are still defending that level strongly.
Support
4025–4030: Very strong support. If the market breaks below this zone, momentum could quickly shift to the downside.
4000: Psychological support.
Resistance
4150–4180: Immediate resistance area where price may struggle.
4250–4300: The next major hurdle if the upside continues.
Trendline resistance from the descending channel.
📈 What to Expect Next
Bullish Case
If the price continues to hold above 4025, the market has room to push higher. A clean breakout above the trendline would open the way towards 4170, and eventually 4250–4300. This becomes more likely as long as buyers protect the demand zone.
Bearish Case
If the market closes below 4025, the structure weakens. In that scenario, we could see a deeper correction toward 3950, and possibly even 3850 if selling pressure increases.
🎯 Final Thoughts
The market is currently in a tight consolidation phase, building pressure between support and resistance. The 4025–4030 zone is the line in the sand — hold it, and the market remains bullish; lose it, and sellers take control. The upcoming breakout from the trendline will likely decide the next major move.

Weekly profile on GoldSo gold opened the week and made a monday low that was later stop hunt yesterday on Tuesday during London session to make a weekly low so we expect to see a distribution phase throughout the week in the upperside to price level 105.00
XAUUSD – Head & Shoulders Pattern Forming on H4 💛 XAUUSD – Head & Shoulders Pattern Forming on H4 🎯
🌤 Overview
Hello everyone, Lana here again 💬
After a strong drop, Gold is forming a clear Head & Shoulders structure on the H4 timeframe, aligned with the long-term ascending trendline. This pattern suggests the possibility of a bullish move back toward previous highs — but price may still dip lower to complete the structure first.
💹 Technical Analysis (ICT Perspective)
The Left Shoulder – Head – Right Shoulder is gradually shaping around the trendline + supporting FVG.
The upper 50% Fibonacci area is a reasonable zone for the right shoulder to form. If price breaks above the neckline, it may head toward the major liquidity zone around 4200.
In the short term, the 4118–4120 zone serves as resistance + neckline, making it suitable for a technical Sell setup.
The 4040–4042 area aligns with the trendline + Order Block, forming a strong support zone for potential Buy entries if price makes a deeper correction.
🎯 Trading Plan (For Reference Only)
💢 SELL Scenario (scalping at resistance)
Sell: 4118–4120
Stop Loss: 4125
Take Profit: 4105 → 4086 → 4060 → 4040
💖 BUY Scenario (preferred with the main pattern)
Buy: 4042–4040
Stop Loss: 4034
Take Profit: 4075 → 4090 → 4100 → 4140 → 4200
⚠️ Important Notes
Trading based on patterns is always expectation-driven, so combine it with candlestick confirmation on smaller timeframes (M15–M30) before entering.
Upcoming FOMC Meeting and NFP report, especially after the long U.S. government shutdown period, may cause unpredictable volatility.
Reduce position size and avoid holding large trades during major news events.
🌷 Final Thoughts from LanaM2
The H4 Head & Shoulders pattern on Gold is offering attractive opportunities for both short-term Sells and trend-aligned Buys 💛
Stay patient, wait for price to reach the marked zones, follow your stop-loss rules, and avoid FOMO during high-impact news.
If you found this helpful, please 💛 Like – 💬 Comment – 🔔 Follow LanaM2 for daily Gold insights!

Spot goldDetails provided in the chart, gold is forming like triangle flag pattern support 4000 to 4060
Gold is stronger in longer terms short term it will move up and down
Bullish for longer term
Disclaimer:
Only for education purposes not recommendation

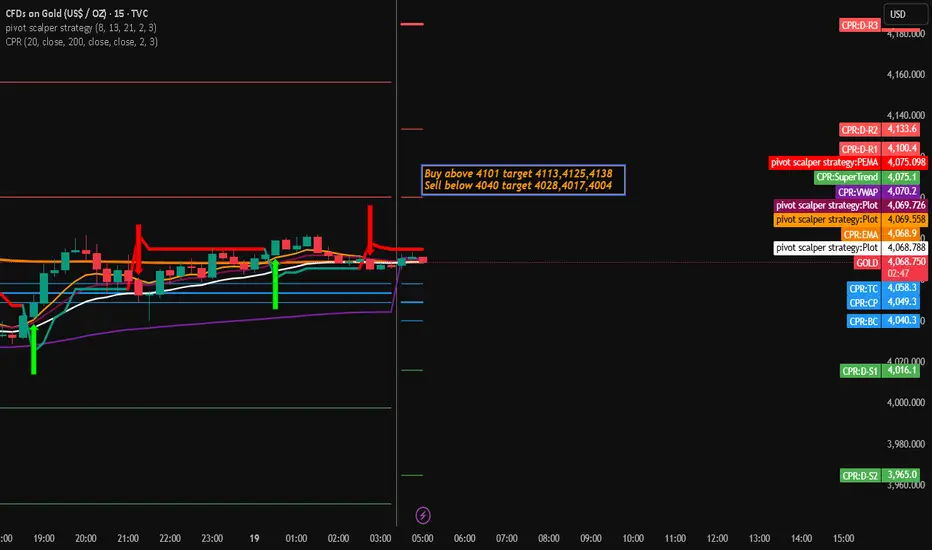
Gold Trading Stategy for 19th November 2025📈 Gold Trading Setup 💰
Buy Setup 🟢
Condition: Enter Buy if Gold (XAU/USD) closes above the high of the 15-minute candle.
Entry Level: Above 4101
Targets:
Target 1: 4113
Target 2: 4125
Target 3: 4138
Sell Setup 🔴
Condition: Enter Sell if Gold (XAU/USD) closes below the low of the 1-hour candle.
Entry Level: Below 4040
Targets:
Target 1: 4028
Target 2: 4017
Target 3: 4004
🛑 Important Disclaimer 📉
This is not financial advice. Trading involves substantial risk and may not be suitable for all investors. Only trade with capital you can afford to lose.
Do your own research (DYOR) before making any trading decisions.
Past performance is not indicative of future results.
Market conditions can change rapidly, and no strategy is foolproof.
Always use appropriate risk management, including stop-loss orders.
Gold Analysis & Trading Strategy | November 18-19✅ From the 4-hour chart, gold remains in an overall bearish correction structure.
MA5 and MA10 have formed a bearish crossover and continue to suppress the candlesticks, indicating that the short-term rebound is limited.
MA20 is located near 4097, acting as significant resistance. As long as the price fails to stabilize above this level, the bearish structure will not change.
The Bollinger Bands show a downward opening, reflecting a weak trend.
Price previously broke below the lower band (around 3980) and although it has since rebounded, it still remains below the middle band.
Gold has repeatedly tested the 3997–4000 support zone and formed brief rebounds, but the strength is weak — this is still technical correction rather than a trend reversal.
✅ On the 1-hour chart, gold shows a clear short-term rebound correction.
Price has broken above MA5 and MA10 and is holding above the short-term moving averages, indicating strengthening rebound momentum.
The upper resistance comes from the Bollinger upper band at 4075–4078, an area where gold has repeatedly been rejected.
MA20 (around 4036–4040) has shifted from resistance to short-term support.
As long as this level holds, the 1-hour structure still has room to extend the rebound.
Long lower wicks and concentrated trading around 4050–4060 suggest that buyers are trying to establish a short-term base.
However, the short-term rebound has not changed the bigger bearish structure.
If gold fails to break through 4075–4080, the rebound may end and the price could return to its bearish rhythm.
🔴 Resistance Levels: 4075–4080 / 4100–4108 / 4150
🟢 Support Levels: 4036–4040 / 4000–3997 / 3953
✅ Trading Strategy Reference
🔰 Strategy 1 — Look for short positions near resistance (trend-following):
If gold rebounds to 4075–4080 and shows rejection:
Consider taking light short positions
Stop Loss: above 4088
Targets: 4050 → 4035 → 4000
👉 This zone combines multiple moving-average resistance and the Bollinger upper band, making it a high-probability area for trend-following shorts.
🔰 Strategy 2 — Short-term long positions from support (countertrend, light positions):
If gold pulls back to 4035–4040 and stabilizes:
Consider a short-term long position
Stop Loss: below 4030
Targets: 4060 → 4075
👉 This is only a corrective rebound trade — not suitable for large positions.
🔰 Strategy 3 — If gold breaks below 4000, downside may accelerate:
A break below 3997–4000 could trigger a stronger sell-off, with targets toward:3953 → 3920
✅ Summary
Gold remains in a bearish, downward-dominated structure, and the current rebound is still a weak correction.
As long as the price remains suppressed below 4080–4100, the bearish trend remains intact.
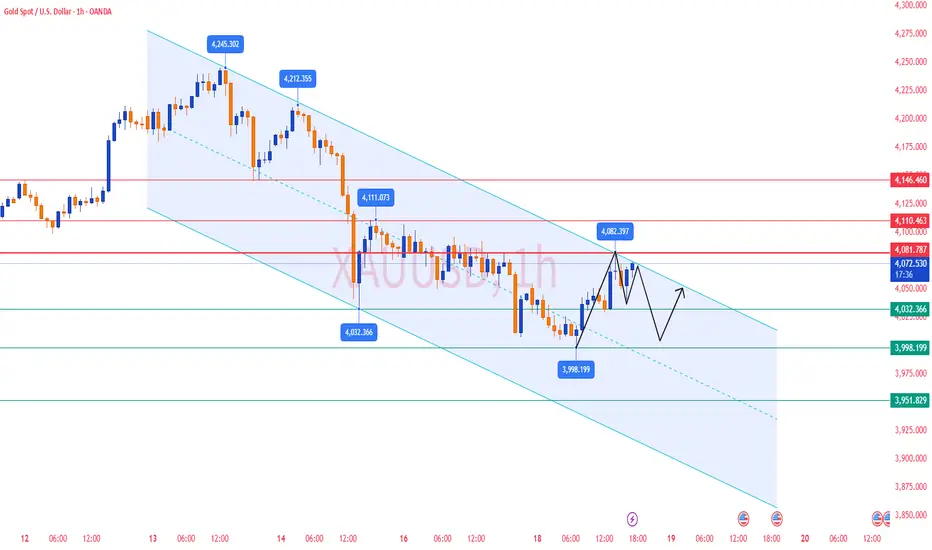
Current Market Structure & Key Observations Previous Trend: The Current Market Structure & Key Observations
Previous Trend: The chart shows a strong uptrend from late October, peaking around November 14th at approximately $4,400. This peak marked a significant reversal.
Correction/Reversal: Since the peak, the price has undergone a sharp downward correction or potential reversal.
Trendline Interaction: The price has recently fallen to and is currently interacting with a major long-term ascending trendline (the solid black line).
Current Price: The price is hovering right at the trendline, indicated by the dashed pink line at approximately $4,034.
Analysis of the Projected Path (Red Lines)
The red lines drawn on the chart suggest a specific bearish scenario:
Trendline Break and Retest: The price is shown to break below the ascending trendline. This is a critical technical signal, often indicating the end of the uptrend and the start of a downtrend.
Pullback/Retest: The price then executes a pullback back up to the broken trendline (now acting as a resistance level). The projected high for this pullback is around $4,060.
Bearish Continuation: After failing to break back above the trendline, the price is projected to continue its decline, heading towards the area of $3,900 and then possibly $3,850 in the following days.
Potential Scenarios (Alternative View)
While the red lines illustrate a clear bearish path, it's important to consider an alternative:
Scenario 1: Bearish Continuation (As Projected)
Action: If the price confirms a breakout below the trendline (closes below it on multiple candles), the trendline turns into resistance.
Target: The focus shifts to lower support levels, with initial targets around $3,900 - $3,850. This confirms the end of the recent uptrend.
Scenario 2: Trendline Hold/Bounce
Action: If the trendline acts as strong support and the price fails to close significantly below it, it could lead to a bounce.
Target: A bounce would target the previous swing high before the major drop, potentially aiming back toward $4,150. This would maintain the longer-term bullish structure.

GOLD H1 – Hawkish Fed Pressure Ahead of Key NFP Data🟡 XAUUSD – Intraday Smart Money Plan | by Ryan_TitanTrader (18/11)
📈 Market Context
Gold is trading inside a bearish corrective channel as markets react to hawkish Federal Reserve commentary and positioning ahead of this week’s U.S. NFP data.
• Fed officials signaled a stronger stance against premature rate cuts, keeping USD supported and limiting gold’s upside.
• Price continues to hover near $4,080, reflecting uncertainty as traders balance Fed tone with upcoming labour-market reports.
Institutional order flow shows controlled downside pressure, with engineered liquidity sweeps forming around both channel extremes.
🔎 Technical Analysis (1H / SMC Structure)
• Structure: Price remains inside a Bearish Correction Channel, creating consecutive BOS points, confirming distribution.
• Premium Sell Zone: 4107–4105 aligns with a previous mitigation block + internal liquidity.
• Discount Buy Zone: 3983–3985 sits at the lower boundary of the channel + liquidity sweep zone.
• Liquidity:
→ Buy-side liquidity above 4107 (clean equal-high pocket).
→ Sell-side liquidity resting around 3985–3976, where prior long positions were removed.
🔴 Sell Setup (Premium Reaction Zone)
• Entry: 4,107 – 4,105
• Stop-Loss: 4,117
• Take-Profit Targets:
→ 4,060 (minor imbalance fill)
→ 4,030 (BOS retest)
→ 3,985 (discount zone)
📌 Execute only after a liquidity sweep into the zone + bearish BOS on M5–M15.
🟢 Buy Setup (Discount Reaction Zone)
• Entry: 3,983 – 3,985
• Stop-Loss: 3,976
• Take-Profit Targets:
→ 4,030 (short-term structure high)
→ 4,060 (inefficiency midpoint)
→ 4,105 (premium retest)
📌 Valid if price taps channel low + shows bullish displacement.
⚠️ Risk Management Notes
• Expect volatility as markets digest hawkish Fed remarks before NFP.
• Avoid entering trades inside the 4020–4070 chop region without clear BOS.
• Reduce position size during news hours.
• Trail stops once price clears each liquidity pocket.
📝 Summary
Gold remains pressured by Fed rhetoric, but liquidity is building at both extremes.
• Sell Zone: 4107–4105 (premium mitigation area)
• Buy Zone: 3983–3985 (discount liquidity sweep)
Price is likely to form a manipulation → reaction → continuation pattern within the channel.
📍 Follow @Ryan_TitanTrader for more Smart Money updates ⚡
🎁 More insights & gifts on my TradingView profile.

Xauusd making pennantA big move expected in NY session wait for either side to break to catch the move
Expected is Selling

Gold direction today November 17📊 Support – Resistance – Fibonacci Analysis
1. Trend Overview
Price has broken below the ascending channel, signaling a shift into a corrective downtrend phase.
2. Key Resistance Zone
4,215 – 4,230
Confluence of Fibonacci retracement 0.5 – 0.618
Overlaps with a supply zone + EMA89
→ Strong resistance, high probability of selling pressure.
This is also the expected pullback/retest area before the next bearish leg.
3. Key Support Levels
Support 1 – 4,000
Fibonacci extension 0.5
Horizontal support
→ Likely to generate a short-term reaction.
Support 2 – 3,890
Major downside target if the structure fully breaks
→ Primary bearish target for a deeper continuation.
4. Price Scenario
Price may pull back toward 4,215 – 4,230.
BUY GOLD : 4000 - 3997
Stoploss : 3987
Take Profit : 100-300-500pips
SELL GOLD : 4212 - 4215
Stoploss : 4225
Take Profit : 100-300-500pips


BUY AGAIN BREAKOUT TREND LINE🕯SELL GOLD: 4018- 4015
⚠️ SL: 4015
✔️ TP: 4024→ 4030→3934( 60- 170 pips)
The 4018–4015 zone has just been broken, and with the temporary bearish structure on M15 also violated, there is a high probability that price will pull back and retest this zone.
If that happens, we’ll have a beautiful and technically clean BUY pullback opportunity aligned with the post-breakout structure.
📌 Notes:
This is a BUY pullback setup based on the M15 break of structure
Only BUY with clear candle confirmation
Small lot size + tight SL for safety
I’ll update again when price approaches the retest zone. 🔔🔥

GOLD (XAU/USD): THE BATTLE OF NFP AND FED!1️⃣ TECHNICAL VIEW (TA): Awaiting Sell Confirmation
Structure: The short-term uptrend has ended, prices are adjusting/reversing.
Main Supply Zone (Order Block - OB): Prices are retracing to the ideal sell zone (around $4,064 - $4,081).
Strategy: Prioritise seeking SELL signals at the OB zone.
Target: $3,976 and $3,931 if the OB zone holds.
2️⃣ FUNDAMENTAL VIEW (FA): Interest Rate Pressure
Selling pressure is increasing from:**
Fed Rate Cut Expectations Dwindle: The probability of a 25bps rate cut in December has fallen below 50%. The "Higher for Longer" signal reduces Gold's appeal.
Upcoming Risks: The market awaits NFP and FOMC Minutes. Strong data will bolster USD and sink Gold.
⚠️ Opposing risk: Uncertainty from the US Government shutdown and geopolitical tensions (Russia/Ukraine) may restrain the decline.
#XAUUSD #Gold #TradingSetup #SELLZone #Fed #NFP #PriceAction #SmartMoneyConcepts #Forex

XAUUSD – TWO MAIN SCENARIOS FOR THE DAY: MONITOR REACTION AT...💛 XAUUSD – TWO MAIN SCENARIOS FOR THE DAY: MONITOR REACTION AT TRENDLINE 🎯
🌤 1. Overview
Hello everyone 💬
Gold is currently waiting at the H4 trendline, indicating the market is lacking volume to decide the next direction.
Although the price is adjusting after the drop from the 4,400 USD zone, the larger trend is still supported by strong buying flows from central banks.
💹 Market Context
According to Goldman Sachs, the current decline is only temporary, as the demand for gold as a safe haven asset remains strong:
US bond yields are falling
USD is weakening
The US economy is under pressure from unemployment and inflation
In September alone, central banks purchased 64 tonnes of gold, and forecasts suggest that November may continue this strong accumulation trend.
💹 Technical Analysis
📉 If Gold breaks below the trendline → the market will trigger strong selling pressure, pulling back to the 395x zone, where there is low liquidity and important support.
📈 Conversely, if the price holds the trendline and volume pushes up, a short-term upward structure will form.
📌 The 4068 zone is a key level — if the price retests this area and falls back, Buy will only activate when it reaches 4034.
🎯 Reference Trading Scenarios
🔻 SELL – When breaking the trendline (priority if volume is strong)
Sell 4036–4038 │ SL: 4044
TP: 4010 → 3995 → 3970 → 3945
🔹 BUY – Strong support 395x
Buy 3952–3954 │ SL: 3957
TP: 3975 → 3995 → 4030
🔸 BUY maintaining trend (if price rebounds at 4068)
Buy at 4034 after confirmation signal
⚠️ Important Note
Volume is currently low, making the market prone to stop sweeps, so enter orders with small volume.
The larger trend is still supported by flows from central banks, but in the short term, Gold may fluctuate strongly around the trendline.
Prioritize trading based on price reactions at key zones rather than predicting direction in advance.
🌷Gold is in a sensitive phase at the H4 trendline 💛
If you find this useful, please 💛 Like – 💬 Comment – 🔔 Follow LanaM2 to receive daily gold analysis ✨

WILL GOLD CONTINUE TO DROP?1. Market Context Yesterday, gold was almost in accumulation throughout the Asian–European session and only broke out strongly in the latter half of the US session.
After breaking out of the accumulation zone, the price dropped sharply around 4006 – a crucial key level – and surged strongly from there.
However, statements from FED members remain hawkish, affirming the stance of keeping interest rates high for longer and not considering rate cuts yet.
This creates
-Downward pressure on gold
-Cash flow leaning towards USD
------>>Market sentiment prioritises SELL on price recovery
➡️ Conclusion: Today, the main scenario remains SELL following the trend, BUY is only a secondary strategy & short scalp when reaching strong support.
🎯2. Today's Trading Scenario
(SL: 10 points TP 10 points. RR ratio:1-2/1:3/1:5)
🔻 Main SELL (priority)
SELL Zones:
4050 – 4055
4075 – 4080
4105 – 4110
🟦 Secondary BUY
BUY Zones:
3996 – 3994
3965 – 3960
3935 – 3930
3895 – 3890

GOLD H1 – Will Retail Sales Trigger Gold’s Next Big Move?🟡 XAUUSD – Intraday Smart Money Plan | by Ryan_TitanTrader (17/11)
📈 Market Context
Gold is trading inside a corrective phase as markets anticipate today’s U.S. Retail Sales data and several Fed speeches — both crucial for assessing whether inflation momentum is slowing or rebounding.
• Weak retail numbers may hint at cooling consumer strength, supporting safe-haven bids in gold.
• Strong data could revive USD demand, prompting sell-side setups from premium zones.
Institutional flows show engineered pushes into inefficiency before a directional leg unfolds.
🔎 Technical Analysis (1H / SMC Structure)
• Structure: Gold is forming a short-term accumulation at the discount range after consecutive bearish candles and a deep liquidity sweep below 4030.
• FVG Sell Zone: 4140–4138 aligns with an unmitigated FVG + internal liquidity — ideal for sell-side reactions.
• Discount Zone: 4008–4010 is the last clean demand zone + sweep area, matching the chart’s projected bullish inducement.
• Liquidity:
→ Buy-side liquidity rests above 4140.
→ Sell-side liquidity remains exposed near 4000–3995.
🔴 Sell Setup (Premium Reaction Zone)
• Entry: 4,140 – 4,138
• Stop-Loss: 4,150
• Take-Profit Targets:
→ 4,095 (intra-day imbalance fill)
→ 4,060 (previous BOS block)
→ 4,010 (discount accumulation area)
📌 Trade only after a liquidity sweep into FVG + bearish BOS on M5–M15.
🟢 Buy Setup (Discount Reaction Zone)
• Entry: 4,010 – 4,008
• Stop-Loss: 4,000
• Take-Profit Targets:
→ 4,060 (short-term structure high)
→ 4,095 (mid-range inefficiency)
→ 4,138 (final premium reaction zone)
📌 Valid if price sweeps 4008 and shows bullish BOS + displacement.
⚠️ Risk Management Notes
• Expect volatility during the U.S. Retail Sales release.
• Avoid chasing price inside the 4060–4100 chop region.
• Lock profits at each liquidity level and trail stops.
• Keep total risk under 1–2% per setup.
📝 Summary
Gold remains in a engineered pullback phase with clear liquidity pockets at both extremes.
• Sell Zone: 4140–4138 (FVG / premium reaction zone)
• Buy Zone: 4008–4010 (discount accumulation zone)
A clean manipulation–reaction–continuation pattern is likely before the next intraday move.
📍 Follow @Ryan_TitanTrader for more Smart Money updates ⚡
Check out my TradingView profile for special gifts 🎁

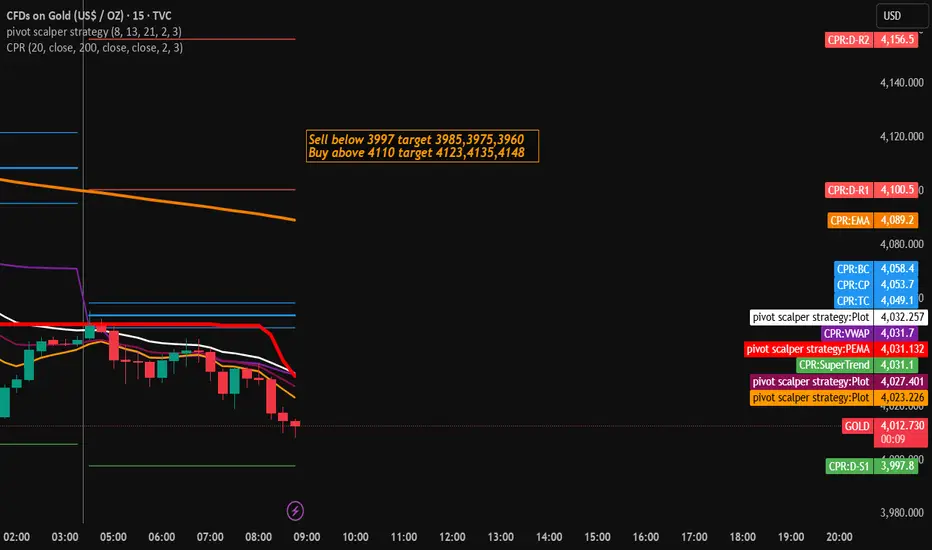
Gold Trading Strategy for 18th November 2025✨ XAUUSD (Gold) Intraday Trade Setup ✨
(Price levels based on your strategy plan)
🔻 SELL Setup (Below 5-min Candle Low)
📉 Sell Below: $3,997 (only if a 5-minute candle closes below this level)
🎯 Targets:
TP1: $3,985
TP2: $3,975
TP3: $3,960
🛡️ Suggested Stop-Loss: Above the breakdown candle high or above $4,005 (safety buffer).
📌 Trade Logic:
A 5-minute candle closing below $3,997 confirms bearish momentum and opens the path toward intraday support levels. Targets are placed at logical liquidity zones.
🔺 BUY Setup (Above 15-min Candle High)
📈 Buy Above: $4,070 (only if a 15-minute candle closes above this level)
🎯 Targets:
TP1: $4,083
TP2: $4,095
TP3: $4,110
🛡️ Suggested Stop-Loss: Below the breakout candle low or below $4,055 (safety buffer).
📌 Trade Logic:
A 15-minute candle closing above $4,070 signals bullish strength. The upside levels represent potential liquidity and resistance zones.
⚠️ Disclaimer
📜 This analysis is for educational and informational purposes only.
💼 This is not financial advice and should not be considered a buy or sell recommendation.
📊 Trading involves significant risk. Always do your own analysis and use proper risk management.
GOLD DAILY TRADING 17/11: BUY TODAY🦁 THE GOLDEN ARENA – 17 NOV, 2025
“Rebound or Trap? Let the Orderflow Decide.”
A visually striking TradingView plan – part narrative, part tactical map. This is not just a bias, it’s a battlefield strategy.
🧭 MARKET CONTEXT SNAPSHOT
Price currently consolidating around 4076 – 4084, after clean breaks of structure (BOS) and a deep retracement.
Significant supply zones confirmed at 4157 – 4180, where POC clusters, FVG imbalances, and volume absorptions align.
Orderflow on M5–M30 shows fading buy pressure and aggressive sells into lower highs.
🎯 CORE STRATEGIES FOR TODAY
🔺 Scenario 1: Breakout Trap SELL (High Conviction)
Target Zone 4178 – 4180 (Main Supply)
Stop Loss (SL) 4185
Take Profit 1 (TP1) 4155 (Low volume node)
Take Profit 2 (TP2) 4100 (Local support)
Take Profit 3 (TP3) 4040 (Structural SSL level)
🔍 Why this setup?
Clear liquidity pool above 4178 being targeted.
Volume tapering off into the move → classic reversal signal.
Footprint shows absorption candles at key supply.
🪙 Scenario 2: FVG Scalping SELL (Secondary)
Entry Zone 4157 – 4158
SL 4163
TP 4100 – 4105
✅ Perfect for short-term scalpers looking to ride the intraday rejection from the imbalance zone.
🟢 Bullish Reversal INVALIDATION (Failsafe Plan)
Trigger Break and hold above 4185
Entry Breakout Buy above 4190
SL 4175
TP 4220
Only flip bullish if aggressive buyers step in + strong delta + profile breakout.
🧱 KEY PRICE ZONES TO MONITOR
Level Description
4185 Stopline – invalidates Sell
4178 – 4180 Main SELL Zone (POC + FVG)
4157 – 4158 Minor FVG Scalping Area
4100 Micro support + Bull trap
4040 SSL – liquidity target
📊 VOLUME & ORDERFLOW INSIGHT
M5–M30 Footprints:
Massive seller imbalances from 4175+
Footprint at 4084 shows buyer exhaustion
Volume Profile:
High-volume node at 4178 acting as strong resistance
Low-volume gap below 4155 → fast price travel zone
Delta:
Negative delta buildup confirming sell bias
💡 EXECUTION CHECKLIST
✅ Wait for entry trigger at marked zones – don’t pre-empt.
🚫 Avoid FOMO buy into supply unless 4185 is cleanly broken.
🔔 Set alerts at 4157 and 4180 for rejection signs.
🧠 TRADING MANTRA OF THE DAY
"The chart speaks in structure,
The volume whispers the truth,
But the orderflow shouts the conviction."
📌 Bias: SELL on retracements toward supply → hold for 4100–4040
📌 Watchlist: Footprint aggression, absorption blocks, spoof traps

XAUUSD Double Bull Flag — Danger AheadHello my dear traders, Laura here.
This week, the market has been extremely tense, and the price action reflects it well.
As I mentioned before, we are currently seeing the formation of a large bull flag. Just above it, a smaller flag is developing, and this smaller structure is the key trigger for any potential continuation. The bullish outlook remains valid only if this smaller flag breaks cleanly.
The recent pullback dipped deeper than expected, which signals hesitation from buyers. When confidence fades, even a promising breakout can turn into a sweet trap that lifts briefly before falling sharply.
Because of this, patience becomes essential. Before entering, we need a clear and decisive breakout that confirms strength. Specifically, we should look for a candle that breaks through resistance with firmness and clarity. If such a confirmation appears, the path toward the 4,300 level becomes structurally supported.
On the other hand, if the price falls below the lower trendline, the bullish scenario is invalidated immediately. At that point, the setup no longer holds and should not be traded.
For now, the principle is straightforward.
No breakout means no entry. Stay disciplined and avoid letting the market pull you into unnecessary risk.

XAUUSDFinally the wait is over. From morning I was on sell side for gold and everyone was waiting for the breakout finally it happened booked good profit after so many fakeouts.

Gold Analysis & Trading Strategy | November 17-18✅ From the 4-hour chart, after gold topped at 4245, the price continued to break downward and is still trading below all short-term moving averages (MA5 / MA10 / MA20). This indicates that the larger-cycle bearish trend remains intact.
MA5 < MA10 < MA20 — the bearish alignment is clear, and every rebound has been suppressed near MA10 (4110).
💹 Bollinger Bands:
The lower band continues to extend downward, the middle band (around 4146) is sloping lower, and the lower band has moved down to 4035.
Gold is currently oscillating weakly near the lower band, suggesting that the market is still releasing downside momentum and the lower support has not stabilized.
✅ From the 1-hour chart, gold has been unable to hold above MA20 (around 4084).
MA5 and MA10 are pressing downward, while MA20 and MA60 act as strong resistance. Each rebound candle shows an upper wick, indicating heavy selling pressure.
The 1-hour timeframe is a weak consolidation and there is no valid sign of bottoming or reversal.
💹 Bollinger Bands:
The bands are narrowing at the lows, with the middle band (around 4084) moving sideways.
The market is consolidating at low levels and may choose a direction soon — with a higher probability of continuing downward in line with the main trend.
🔴 Resistance Levels: 4110–4120 / 4140–4150
🟢 Support Levels: 4060–4050 / 4032–4035
✅ Trading Strategy Reference:
🔰 If gold rebounds to 4110–4120 and meets resistance, consider light short positions. The target can be set at 4050–4030. If the decline continues, further targets are 4000 and 3930–3887.
🔰 If gold rebounds to 4140–4150 and faces rejection, high-position shorts can be taken, targeting 4100–4080.
🔰 If gold pulls back to 4035–4040 and stabilizes, consider low-position longs, targeting 4060–4080.
🔥Trading Reminder: Trading strategies are time-sensitive, and market conditions can change rapidly. Please adjust your trading plan based on real-time market conditions.

XAUUSDTrading is easy, but trading with convection is only possible after you have 5-6 years of experience trading in every market.
It is this experience that can tell you how high the market can go, if you are tracking the stock correctly, and only then can you estimate how much profit booking can happen.
This is possible only with experience. Its the time to book profit in gold. gold ready for create a new lower high formation.
