XAUUSD / GOLD Analysis – Buy Opportunity Ahead!Gold has formed a strong double-bottom support zone at 4095 – 4090, signaling potential bullish momentum. As long as Gold remains above 4080, the bias stays bullish for short-term buyers.
🧭 Trading Plan:
Buy Zone: 4095 – 4090
Stop Loss: Below 4080 (close basis)
Targets: 🎯 4010, 4030, 4040
💡 Technical Reasoning:
Double-bottom pattern confirmation on 1H/4H timeframe
RSI bouncing from oversold area
Price rejecting key support zone multiple times
Potential bullish divergence forming
⚠️ Risk Management:
Always use proper risk-to-reward management and position sizing. Gold can move fast during high volatility sessions — keep your stops tight and targets realistic.
🔔 Conclusion:
If Gold holds above 4080, buyers could dominate the next leg. Watch price action closely near 4095 – 4090 for entry confirmation.
Trade ideas

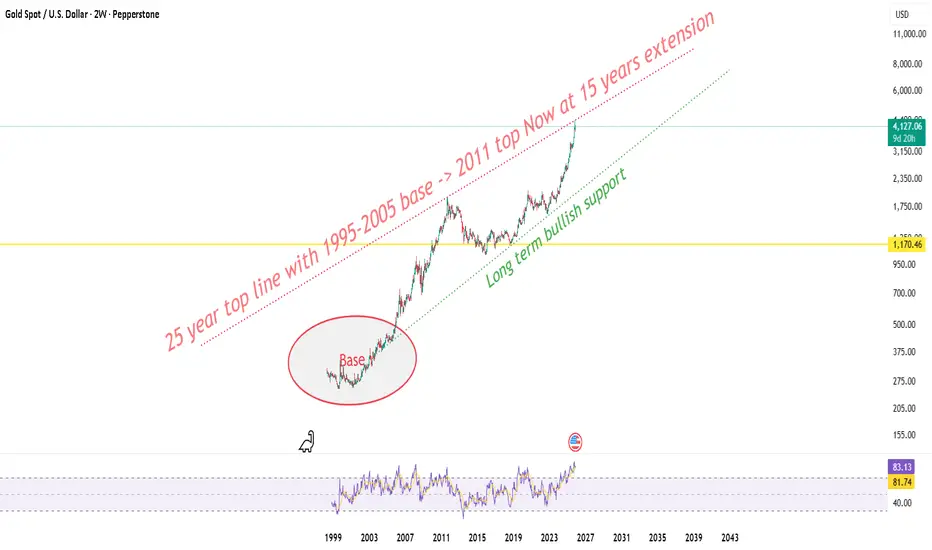
Gold at 25 year top line ! Macro view !Zooming out to the 2 week frame gold’s now touching the same top line that was drawn from the 1995-2005 base to the 2011 cycle high. This upper rail has acted like a generational ceiling and after nearly 15 years, price has stretched back into that very band again, this time near 4150–4350.
This zone isn’t just any resistance it’s the outer wall of gold’s entire super-cycle structure. Historically, whenever price came here with RSI above 80 on the 2-week frame, it marked exhaustion or at least a multi-month digestion phase before the next leg higher. And right now, RSI is sitting around 83 a clear signal of overheated momentum.
Macro context still favors gold in the long term global rate-cut expectations, slower real yields, and consistent central-bank accumulation keep the long-term green base trendline (drawn from 2005 lows) fully intact. As long as that line holds, the long-term structure stays bullish-biased.
But here’s the catch the higher we climb without a structural reset, the more fragile the rise becomes.
So 4365 stands as a major decision point.
Reject from here: we could see a healthy pullback toward 3750-3800 — still within the bullish channel.
Break and close above: that opens the door for a true macro breakout, with next expansion targets sitting around 4800–5200 over the coming years.
For now, this run feels more like a macro stretch ice sitting on sand. Looks shiny, but needs solid ground before it can hold.
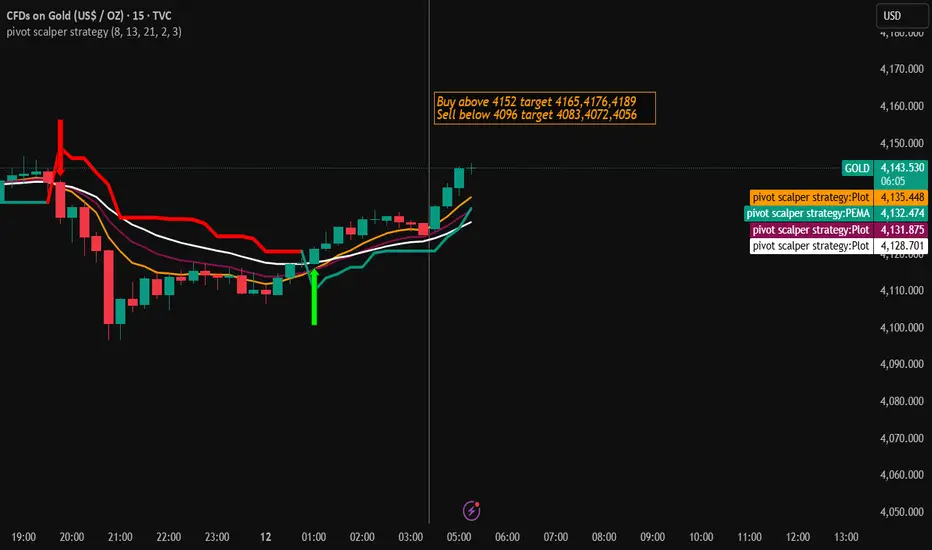
Gold Trading Strategy for 12th November 2025🪙 GOLD Trading Setup (Intraday Strategy)
📈 Buy Setup (Bullish Scenario)
👉 Condition to Enter Buy:
Wait for the 1-hour candle to close above $4152.
This confirms bullish momentum (buyers are taking control).
🎯 Targets after Buy Entry:
Target 1: $4165
Target 2: $4176
Target 3: $4189
🛑 Stop Loss (SL):
You can place your SL just below the breakout candle’s low or around $4140 (for risk control).
💡 Explanation for Beginners:
When the 1-hour candle closes above $4152, it means price has broken an important resistance level. This often attracts more buyers, pushing the price higher toward the target levels.
📉 Sell Setup (Bearish Scenario)
👉 Condition to Enter Sell:
Wait for the 30-minute candle to close below $4096.
This confirms bearish pressure (sellers are taking control).
🎯 Targets after Sell Entry:
Target 1: $4083
Target 2: $4072
Target 3: $4056
🛑 Stop Loss (SL):
Place SL slightly above the breakout candle’s high or near $4110 for protection.
💡 Explanation :
When the 30-min candle closes below $4096, it means the market is showing weakness. This setup allows you to follow the selling momentum as price moves toward lower levels.
⚠️ Risk Management Tips
Never trade without a stop loss.
Risk only 1–2% of your capital per trade.
Avoid entering trades before candle closes — always wait for confirmation.
Stick to your plan; don’t chase trades emotionally.
🧾 Disclaimer
⚠️ This analysis is for educational purposes only and not financial advice. Trading in gold or any financial market involves risk. Always do your own research or consult a financial advisor before making trading decisions.

Gold likely to come downAs obvious from my previous chart.
the correction is major 4 th wave correction.
After 5 wave up move forming 3 rd wave major
gold had undergone correction to form A wave
and this pull back is B wave and C wave correction
has started.it should violate low of wave A and come down more.
please go through the chart and my previous posts to understand
clearly.
like this post if it helps you..follow me to get updates

Gold Analysis and Trading Strategy | November 11-12✅From the 4H chart, gold experienced a strong bullish rally after breaking above the 4077 pivot level and reached a recent high of 4148.99.
However, after consecutive bullish candles, the price faced resistance near the upper Bollinger Band (4154.85) and has since pulled back slightly.
Currently, the price is hovering near 4110–4115, just above the MA10 (4104.83) and MA20 (4051.26) — this area serves as a short-term support zone.
The Bollinger Bands remain in an expanding state, indicating that overall volatility is still active.
If the price stabilizes above 4105–4110, the bullish structure remains intact; a break below this zone could trigger further pullback toward 4077–4050.
✅On the 1H timeframe, gold shows a short-term correction after peaking at 4148.
MA5 and MA10 have formed a bearish crossover, and the price is currently below them, signaling short-term bearish pressure.
Bollinger Bands are starting to narrow, reflecting decreasing volatility and a possible sideways consolidation phase.
The MACD has formed a dead cross, and the momentum indicator shows continued downside pressure, but near-term support appears around 4107–4090.
🔴 Resistance levels: 4148 / 4155 / 4175
🟢 Support levels: 4105 / 4077 / 4050
✅ Trading Strategy Reference
🔰 If gold rebounds to 4145–4148 and faces resistance, consider light short positions, targeting 4105–4077, with a stop loss above 4155.
🔰 If gold drops to 4100–4110 and stabilizes, consider short-term long positions, targeting 4130–4150, with a stop loss below 4065.
📈The overall structure remains bullish on higher timeframes, but short-term correction pressure is visible.
In the near term, focus on the 4100–4145 trading range — sell high, buy low within the band, and wait for a clear breakout to determine the next major direction.
XAU/USD – Gold Technical Adjustment Before Continuing Uptrend⏰ Timeframe: 30m
📅 Updated: 11/11/2025
🔍 Market Context
After a strong rally from the start of the Asian session, gold paused around 4,130–4,140 USD, indicating a temporary cooling off after a series of consecutive Break of Structure (BOS).
The current price is situated between a short-term resistance zone and a technical support (Order Block) – clearly reflecting a rebalancing behavior after a rapid expansion.
📊 Technical Structure
Resistance Zone (4,145 USD): a short-term reaction area, coinciding with a Weak High. If the price surpasses this, the uptrend structure will continue towards the Liquidity Zone around 4,198 USD.
Order Block (4,111 USD): a confluence area between 0.382–0.5 Fibonacci, likely to attract buying interest when the price adjusts.
OB Deep (4,081 USD): a deep support area, coinciding with the 0.618 Fibonacci level — where buyers might defend the main trend.
Liquidity Zone (4,198 USD): a potential expansion target if the uptrend structure is reconfirmed.
🎯 Market Outlook
High probability scenario:
1️⃣ Price technically adjusts to OB 4,111 or OB Deep 4,081, creating a reaction at the Discount area.
2️⃣ As buying momentum returns, the price may retest the Resistance Zone 4,145, then expand towards the Liquidity Zone 4,198 USD.
3️⃣ Breaking below 4,081 USD will weaken the short-term structure, shifting to a deeper rebalancing state.
🧠 Analyst’s View
This is a natural “cooldown” phase after a strong rally — the market is seeking liquidity before establishing the next upward move.
As long as the price holds above the 4,081 USD area, the main trend remains bullish.
Observing reactions at the OB will help determine if the upward momentum will continue to dominate in the US session.
🛡️ Risk Note
The market is adjusting within a larger trend — avoid emotional actions when the price has not completed the retracement phase.

Gold Reaches Supply Zone: Prepare for a Pullback to FVG📊 Market Structure
Gold continues to maintain its bullish structure after breaking the structure high (BoS) at the 4,000 USD zone and forming a steep bullish channel over the past 3 sessions.
Currently, the price is precisely hitting the Order Block 4,140 – 4,150 USD — a critical supply zone formed from the previous distribution.
The H1 candle is showing slight technical reaction signs , implying the potential for a short pullback to re-accumulate liquidity.
If a pullback occurs, the Premium Zone 4,080 – 4,085 USD and FVG 4,025 – 4,035 USD will be ideal areas to look for buy signals.
The bullish structure is only invalidated if the H1 candle closes below the Support 4,006 USD zone.
💎 Key Technical Zones
• Order Block: 4,140 – 4,150 USD → main supply zone, where profit-taking pressure appears
• Premium Zone: 4,080 – 4,085 USD → medium-term rebalancing zone
• FVG Zone: 4,025 – 4,035 USD → potential discounted price zone for BUY orders
• Support Zone: 4,000 – 4,006 USD → critical defense zone
🎯 Trading Plan
1️⃣ SELL Scalp – Reaction at OB 4,145 USD
If the price continues to react downwards at the 4,140 – 4,150 USD supply zone:
• Entry: 4,143 – 4,147
• SL: 4,155
• TP1: 4,085
• TP2: 4,035
→ Short-term setup, targeting the rebalancing zone before buying back in line with the trend.
2️⃣ BUY Setup – Continuation from FVG Zone
When the price pulls back to the FVG / Premium Zone and creates a confirmed bullish signal:
• Entry: 4,030 – 4,035
• SL: 4,006
• TP1: 4,090
• TP2: 4,145
• TP3: 4,170
→ Trend-following setup, preferred when the price re-accumulates and a clear rejection appears.
🧠 Vincent’s View
Buyers still control the market, but the current OB touch may trigger a short pullback before the bullish wave continues.
The ideal scenario is “tap OB → pullback FVG → continuation,” maintaining a stable bullish structure towards the 4,170 USD target.
“Buy the dip where fear replaces greed — that’s where the next impulse begins.” ⚜️
⏰ Timeframe: 1H
📅 Updated: 11/11/2025
✍️ Analysis by: Captain Vincent

Elliott Wave Analysis – XAUUSD | November 11, 2025🔹 Momentum
• D1 timeframe:
Daily momentum has closed, showing that bullish strength is fading. We’ll wait for today’s daily candle to confirm whether a reversal is forming.
• H4 timeframe:
The two momentum lines are sticking together — this indicates that while upward pressure remains, it is weakening, suggesting a possible formation of wave X top.
• H1 timeframe:
H1 momentum is turning down from the overbought zone. With all three timeframes (D1, H4, H1) aligned, the current price area is likely marking a wave top.
________________________________________
🔹 Wave Structure
• D1 timeframe:
The corrective wave (4) is still developing. Once D1 momentum fully reverses and moves into the oversold zone, it may mark the final stage of the correction phase.
• H4 timeframe:
Price has reached the wave X target area around 4145.
With both D1 and H4 momentum in the overbought zone and starting to turn down, this level is likely the completion of wave X.
After that, price may begin a decline to complete wave Y.
The duration of wave Y is expected to correspond to the time it takes for D1 momentum to move from overbought to oversold.
• H1 timeframe:
The red 5-wave structure has completed, with price currently in wave (5).
The target area for wave (5) lies between 4145 and 4050, overlapping with the wave X target zone.
Therefore, the sell entry from yesterday around 4145 remains valid.
________________________________________
🔹 Trading Plan
• Sell Zone: 4145 – 4147
• Stop Loss: 4165
• Take Profit 1: 4075
• Take Profit 2: 4046
• Take Profit 3: 3932
⚠️ Note: If price closes below 4046, it will confirm that purple wave Y is in progress.
In that case, the target of wave Y could extend below 3855.

XAU Short 11/11/25 Newyork session I am seeing SMT between Gold and Silver on London Highs and Asian Highs both, combined with a Change in State of Delivery. This is totally a time based setup not using PD Arrays.
Do your own research

WILL GOLD CONTINUE TO RISE?I. BASIC CONTEXT
On November 10, 2025, gold prices surged after the market reacted positively to news of the U.S. government reopening.
The current market sentiment expects the FED to cut interest rates soon as recent economic data indicates a weakening U.S. economy.
Lower interest rates mean cheaper money, a weaker USD, thereby driving funds into safe-haven assets like gold.
The current rally is seen as a news-based pullback, potentially extending to key resistance areas before the market establishes a medium-term trend.
II. TECHNICAL ANALYSIS
Main timeframe: H2
Market structure:
Gold prices have broken out of the accumulation triangle pattern.
Formation of an Inverse Head and Shoulders pattern → signaling the correction phase has ended.
III. TRADING SCENARIOS
✅ Main scenario: WATCH TO BUY THE TREND (BUY THE DIP)
Trend expectation: Prices continue to extend the pullback to resistance areas 4180–4220.
Buy zones (BUY ZONES):
Zone 4105–4103 (near old H2 resistance → becoming new support).
Zone 4115–4116 (confirmation area post-breakout).
Deeper zone: 407x – 405x (Fib 0.618, trendline confluence area).
If prices retest the H2 structure: 4040 – 4035.
Buy stop:
When prices break through the 416x area with strong candle force → a buy stop can be placed to follow the breakout momentum.
Note to check the timing and candle force on H2/M30 to confirm momentum.
⚠️ Alternative scenario: WATCH TO SELL REACTION
If clear signs of weakness appear at resistance, consider a short SELL reaction at:
4180–4185
4205–4220
These are potential profit-taking areas for the current pullback wave.
IV. RISK MANAGEMENT
Stop Loss (SL): 10 points
Take Profit (TP): 10–12–13 points depending on setup
RR ratio: 1:1 – 1:1.3
Prioritize capital management according to the principle R ≤ 1% account/order.
Additionally, monitor news on Mr. Trump's actions during this period.
The U.S. government has reopened this week, so expect a fair amount of news, stay alert.
Trade effectively

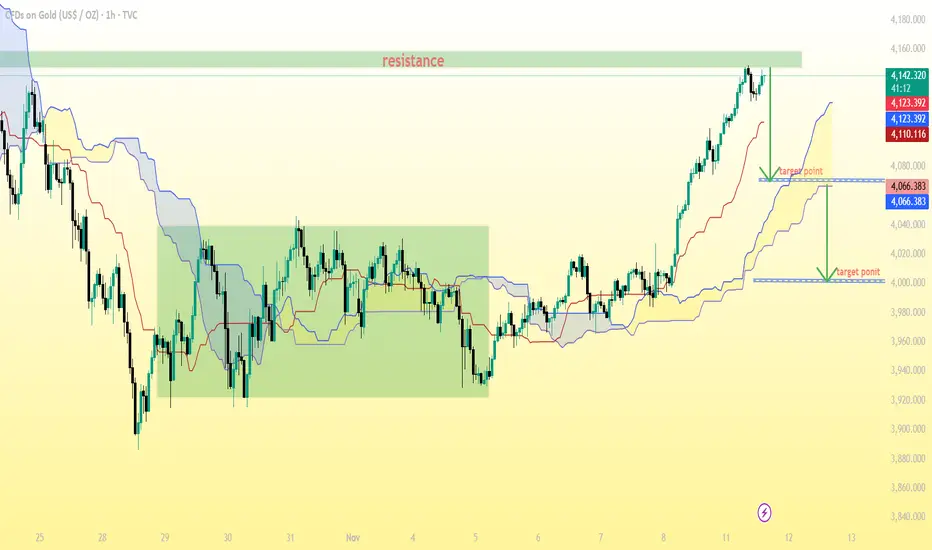
GOLD (XAU/USD) 1-hour chart Pattern..GOLD (XAU/USD) 1-hour chart with Ichimoku Cloud, and my marked resistance and two target points.
Here’s the analysis based on what’s visible:
Current price: Around $4,141 (based on my chart labels).
Resistance zone: Around $4,140 – $4,150, which is where price is currently testing.
Upper target point (minor correction target): Around $4,123 – $4,125.
Lower target point (major correction target): Around $4,066 – $4,070.
📊 Interpretation:
If price fails to break resistance (4,150) and forms rejection candles, it could retrace toward:
Target 1: $4,123 (short-term support)
Target 2: $4,066 (cloud base and major support zone)
If price breaks and holds above 4,150, then the bullish trend can extend further upward, possibly toward $4,180–$4,200.
SONA (XAU/USD): BREAKOUT DONE! FED CUT KA FAYDA. KAB KHARIDEIN?📰 Fundamental Analysis: Bada Game Changer (MUST READ)
Bhaiyon aur Behnon, fundamental factors are very strong for Gold (Sona)!
Rate Cut Ki Umeed (Expectation): Market is expecting more than 60% probability for another Fed Rate Cut in December.
Kam rates means Dollar (DXY) will be weak, aur Gold (non-yielding asset) becomes dhamakedaar (explosive/exciting)!
Economy Thodi Slow Hai: US Consumer Sentiment slid to 50.3 (lowest since June 2022). Yeh data supports a 'Dovish' Fed, jisse Sona ko aur support milta hai (which gives more support to Gold).
💡 Is Hafta Ka Main Focus: Watch out for FOMC member speeches on Wednesday. Poora market unki taraf dekh raha hai (The entire market is looking towards them) for the next direction!
📊 Technical Analysis: Setup Ekdum Solid Hai!
Gold ne ek powerful Breakout diya hai from the consolidation range (4,044 - 4,060). Matlab, trend ab pakka Bullish ho gaya hai! (Meaning, the trend is now definitely Bullish!)
Entry Ka Wait Karo (Patience is key): DON'T JUMP IN NOW! Wait patiently for a pullback to the Demand Zone/CP (4,081 - 4,114). This is the best place to initiate a Long position.
Targets (TP): If the CP zone holds, the targets are 4,155, 4,185, and the big level at 4,236.
Stop-Loss (SL): Keep it safe below 4,044.
🎯 Strategy Summary: Fatafat Dekho!
Strategy: Wait and Buy (Long) in the 4,081 - 4,114 area.
Risk: Dhyaan rakhna (Be careful) if price closes below 4,044.
#XAUUSD #Gold #Sona #FedRateCut #Breakout #TechnicalAnalysis #FOMC #IndianTraders

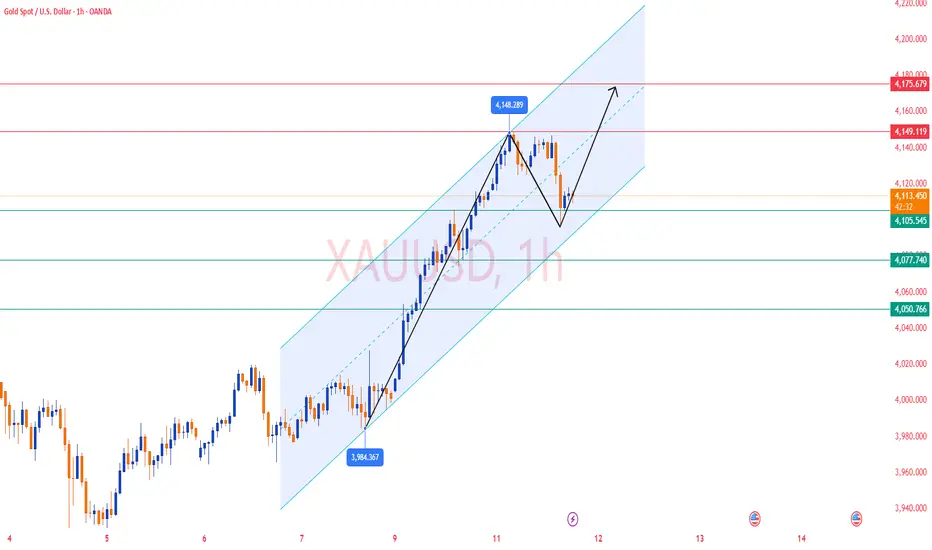
Gold – Bullish Trendline Retest Points Toward Move to 4,120 USDAnalysis (English):
Gold (XAU/USD) is maintaining a clear bullish uptrend, supported by a strong ascending trendline. After a sharp push upward, the price is now pulling back, moving toward a key demand zone aligned with the trendline.
The chart projection indicates a likely scenario:
✅ Bullish Scenario (Most Probable)
Price corrects down into the demand zone and touches the trendline.
Buyers step in and defend the level.
A bullish continuation move develops, pushing price toward the upper resistance zones at:
4,100 USD
4,115 – 4,120 USD
As long as the price remains above the trendline, the bullish structure stays intact.
⚠️ Bearish Risk
If the price breaks below the trendline (around 4,050 USD), momentum could slow and shift into a deeper correction.

Gold H1 – End of Wave 5: Is a Corrective ABC Coming?⚡ XAUUSD – Elliott Wave Intraday Outlook | 11/11
📈 Elliott Wave Context
Gold has completed a clean 5-wave impulsive structure on the H1 timeframe, with Wave 5 pushing into the premium zone above 4130.
Price now shows early exhaustion at the highs, suggesting the market is preparing to transition into a corrective ABC phase.
A confirmed reversal signal will be:
✅ H1 close below the Wave 2–4 trendline → confirming the start of Wave A.
🔎 Technical Breakdown (Wave Structure)
• Wave 1: Initial rally from 3964
• Wave 2: Shallow pullback near 3985
• Wave 3: Strong impulsive breakout toward 4070+
• Wave 4: Mid-cycle correction holding structure
• Wave 5: Final push topping around 4130–4140 (current swing high)
The 5-wave impulse is now completed → market likely moves into A–B–C correction.
📉 Expected Elliott Wave Path (ABC)
Wave A
• First levels: 4105 (Fibo 0.236)
• Main target zone: 4078 (Fibo 0.382)
Wave B
• Corrective rebound toward
o 4105, or
o 4115–4120
Wave C
• Strongest leg of correction
• Ideal target zones:
o 4035 (Fibo 0.618 retracement of the full 1–5 impulse)
o 4004 (Fibo 0.786 retracement)
• Wave C often ≈ Wave A → aligns with 4035–4004
📌 Intraday Trade Plan (Elliott-Based)
✅ Scenario 1 – SELL the upcoming correction (Preferred)
Entry:
• After H1 candle closes below the 2–4 trendline,
or wait for a Wave B retest into 4105–4120.
Stop Loss:
• Above the Swing High → 4145
Take Profit:
• TP1: 4078
• TP2: 4035
• TP3: 4004
✅ Scenario 2 – BUY only if wave invalidation occurs
If gold breaks and holds above 4145, Wave 5 may be extending.
Entry: above 4145
SL: 4120
TP: 4170–4200
✅ Summary
Gold has finished a textbook 5-wave impulse and is now likely entering a corrective ABC structure.
The highest-probability opportunity today is to sell the Wave B retracement and target deeper corrective zones at 4035–4004.

Trade Journal XAUUSD LONG 11/11/2025Price has tapped H1 FVG on XAUUSD
SMT between Silver and Gold
Turtle soup of lows
Target 1 to 2 Risk to Reward

XAUUSD/GOLD 1H SELL PROJECTION 11.11.25XAUUSD/GOLD 1H Sell Projection (11.11.25) chart.
Here’s a quick technical breakdown of what this chart represents:
🟣 Setup Overview
Pair: XAUUSD (Gold)
Timeframe: 1 Hour (H1)
Bias: Bearish (Sell Setup)
🧩 Key Levels
Resistance / High: 4148.82
Stoploss: ~4141.63
Entry Zone: ~4129.45–4128.32
Target 1 (TP1): Around 4110 (S1 + FVG zone)
Target 2 (TP2): Around 4081 (S2 zone)
📉 Projection Logic
Price rejected from major resistance at 4148.
A short-term pullback / retracement is expected into the entry zone.
After possible retest, price is expected to drop towards TP1 and TP2.
The setup suggests a Risk-Reward Ratio (RRR) of roughly 1:2.5 to 1:3, favoring the sell side.
⚙️ Trading Idea Summary
Parameter Value
Bias Sell
Entry Range 4128–4130
Stop Loss 4141
Take Profit 1 (TP1) 4110
Take Profit 2 (TP2) 4081
R:R Ratio ≈ 1:3
Confirmation Bearish engulfing or rejection from resistance zone

LiamTrading – XAUUSD H2 | A corrective phase might occur todayLiamTrading – XAUUSD H2 | A corrective phase might occur today
Follow Liquidity 4090, FVG 4053–4069 & VAH ~4025
Quick glance: Gold remains in an uptrend but shows signs of stalling at the upper boundary of the rising channel. With the USD potentially volatile as the US nears “reopening”, a technical correction towards liquidity zones is a scenario to prepare for.
Technical Analysis
Trendline/Price Channel: Price is moving within an ascending channel; the channel top around 4130–4140 is prone to profit-taking/stalling.
Liquidity: 4085–4092 – a price pull/volume attraction point before choosing the next direction.
FVG #1: 4053–4069 – a price gap likely to fill and rebound.
VAH (Volume Profile): 4023–4028 – volume value peak; strong confluence support during deep corrections.
POC: ~3985–3990 – a magnetic level if the market weakens more than expected.
Resistance: 4135–4140 (near channel top + short-term offer), further 4166 (Fibo/channel top extension).
Fibonacci: The latest upward wave shows the expansion area around 4135–4166 as a “liquidity pocket” – suitable for scalp sell upon clear rejection; retracement levels 0.382–0.5 converge around 406x–402x, matching FVG & VAH → priority buy point if price corrects.
Trading Scenarios
Buy shallow pullback (trend-following)
Entry: 4083–4085
SL: 4077
TP: 4098 → 4112 → 4140 → 4166
Note: Require rejection/wick at Liquidity 4090; move SL to breakeven at +1R.
Buy deep at VAH/Volume Profile
Entry: 4025–4028
SL: 4020
TP: 4040 → 4065 → 4100 → 4112
Note: Prioritize when FVG 4053–4069 fills and rebounds; exercise caution with volume.
Sell scalp at channel resistance (counter-trend)
Entry: 4135–4140
SL: 4148
TP: 4122 → 4105 → 4090
Note: Only a scalp trade; abandon if H1/H2 closes strongly above 4140.
H1/H2 closes below 4077 → risk of testing 4053–4069; breaking further 4020 might drag to POC ~3990.
Each trade risks 0.5–1%, do not average against the trend; adhere to Dow (enter only when support/resistance is confirmed broken on entry timeframe).
Which level are you watching for gold today? Comment below & hit Follow on LiamTrading channel for the fastest updates.

Gold Holds Firm Above $4,140, Aiming for a $4,200 Breakout🔍 Market Context
Gold continues its strong upward momentum, trading around a 3-week high at $4,146 as buyers maintain full control of the trend.
Despite a slight recovery in the USD due to cautious sentiment in the Asian market, gold's upward drive remains intact — supported by expectations that the Fed might cut interest rates in December.
Weak U.S. economic data and a sharp drop in consumer sentiment have further reinforced this expectation, reducing real yields and increasing safe-haven demand for gold.
📊 Technical Analysis (H1–H4 timeframe)
The market structure remains clearly bullish, with the ascending channel pattern being maintained.
The price has broken through the previous resistance area at $4,086 and is currently consolidating around $4,140, indicating potential preparation for the next upward move.
Important Levels:
• Support: $4,086 – $4,039 → potential retest area for buyers
• Short-term Resistance: $4,146
• Breakout Target: $4,203
• Extended Target: $4,382 (all-time high – ATH)
As long as the price holds above $4,080, the bullish trend is favored.
Only a clear close below this area might trigger a short-term correction before continuing higher.
⚜️ MMFLOW Insight:
“Momentum always follows liquidity. When the price reclaims the main structure, Smart Money stops observing – they start building the next upward wave.”

XAUUSD – PRIORITISE BUYING ON TUESDAY💛 XAUUSD – PRIORITISE BUYING ON TUESDAY 🎯
🌤 Overview
Hello everyone 💬
Gold continues its upward momentum in the first two days of the week, supported by the cash distribution policy for low-income individuals and the reopening moves by the US government under President Trump.
These factors are putting downward pressure on the USD, helping gold prices maintain a short-term upward trend.
💹 Technical Analysis
🟣 Currently, the price is touching the VAH area according to the Volume Profile and showing a slight reaction – however, the support trendline around 4110–4113 remains an ideal buying zone to continue following the trend.
🔹 The 4200–4203 area (Fibonacci Extension 2.618) coincides with the strong resistance of H4, likely to see a short adjustment reaction before continuing to extend to the 43xx area.
🎯 Trading Plan Reference
💖 BUY Scenario (priority trend-following)
Entry: 4110–4113 | SL: 4106
TP: 4132 – 4150 – 4175 – 4200 – 4250
💢 SELL Scenario (short-term reaction)
Entry: 4200–4203 | SL: 4207
TP: 4188 – 4165 – 4148
⚠️ Important Notes
Prioritise buying according to the main upward trend, especially when the price reacts at the H4 trendline.
Sell orders are only for short-term reactions, and profits should be secured early when the first TP is reached.
USD volatility remains a key factor to closely monitor this week.
🌷 Conclusion
The upward trend of gold is still maintained 💛
Be patient and wait for the price to react at the 4110–4113 area to buy according to the trend, and take advantage of pullbacks at resistance to manage orders effectively.
If you find this useful, don't forget to 💛 like – 💬 comment – 🔔 follow LanaM2 for daily gold insights ✨

XAUUSD Tape readingwaiting for a correction and a sign of continuation on htf , then i will start looking for longs

XAUUSD Scalp Tape readingThese were my last two scalps on XAUUSD from the previous session (mid-NY). This is how I was reading the tape at that time.

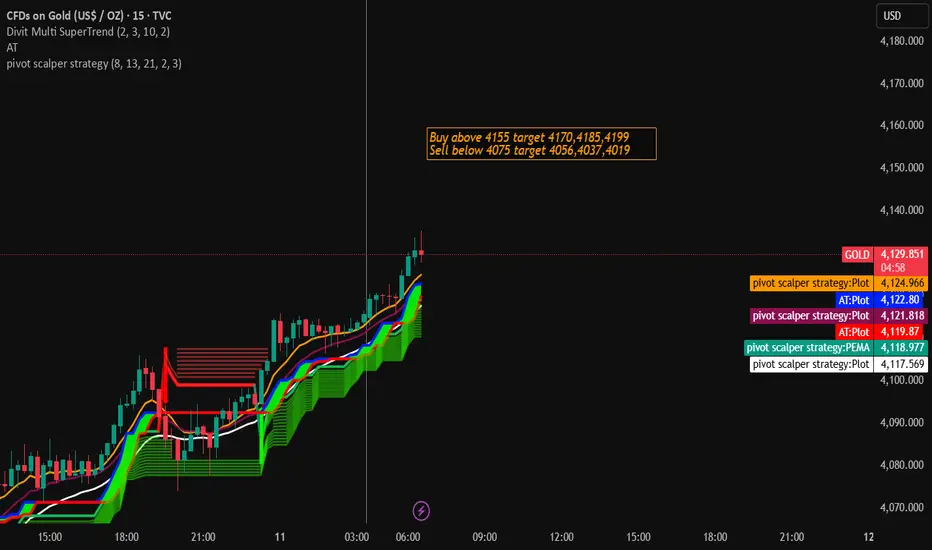
Gold Trading Strategy for 11th November 2025🟡 GOLD INTRADAY TRADING PLAN 💰
📈 BUY SETUP – BULLISH SCENARIO
If Gold shows strong momentum on the 1-hour chart and closes above $4155, it signals potential continuation of the uptrend.
Traders can look for buying opportunities once a candle closes and confirms above the high of that hour.
📋 Buy Entry Conditions:
✅ Wait for a 1-hour candle to close above $4155
✅ Confirm with good volume or strong bullish candle formation
✅ Enter above the candle’s high after confirmation
🎯 Upside Targets:
1️⃣ $4170 – Initial intraday resistance; partial profit zone
2️⃣ $4185 – Secondary resistance; hold with trailing stop
3️⃣ $4199 – Final target for the session
🛡️ Suggested Stop Loss:
Place a protective stop below $4140 or below the candle’s low (depending on your risk tolerance).
📊 Commentary:
A close above $4155 may attract fresh buying interest from intraday and short-term traders. Sustained trading above $4170 could strengthen bullish momentum toward higher targets.
📉 SELL SETUP – BEARISH SCENARIO
If Gold weakens and the 1-hour candle closes below $4075, it could indicate that sellers are gaining control.
A close below this level suggests a possible shift in short-term trend direction.
📋 Sell Entry Conditions:
✅ Wait for a 1-hour candle to close below $4075
✅ Enter below the candle’s low once price confirms breakdown
✅ Ensure downside momentum with volume confirmation
🎯 Downside Targets:
1️⃣ $4056 – First target; book partial profits
2️⃣ $4037 – Second target; hold position with trailing stop
3️⃣ $4019 – Final intraday target zone
🛡️ Suggested Stop Loss:
Place a stop loss above $4090 or above the breakout candle’s high.
📊 Commentary:
A confirmed close below $4075 can trigger a short-term bearish wave. Further weakness toward $4050–$4020 may be expected if sellers maintain control.
⚠️ Disclaimer
📜 This information is for educational and informational purposes only.
It is not financial advice or a recommendation to buy or sell any asset.
Trading in commodities like Gold involves risk of capital loss. Always do your own analysis and use strict risk management before entering any trade.