Sell Projection for XAUUSD (Gold/USD) dated 28.10.25Market Structure
Price Action: The chart shows a sideways channel breakout followed by a strong bearish engulfing candle.
This indicates a shift from consolidation to bearish momentum.
📈 Entry Setup
Entry Zone: Around the retest area near 3,984 (highlighted in blue).
Price is expected to pull back to this zone before continuing downward.
The “ENTRY FOR SELLERS & RETEST ZONE” is marked clearly in the chart.
🛑 Stop Loss
Stop Loss Level: ~ 4,008.551
Positioned above day resistance, giving enough buffer to avoid fake breakouts.
🟢 Target
Target Price: ~ 3,950.397
This level aligns with monthly support, giving a clean RR (Risk-to-Reward) structure.
⚡ Additional Notes
Day Resistance: 3,984.320
Monthly Support: 3,950.397
Breaked the sideways channel: This is the key trigger zone that shows bearish pressure building.
If price rejects the retest zone strongly, it can accelerate toward the target quickly.
📊 Summary of the Trade Idea
Setup Element Details
Pair XAUUSD / Gold
Direction Sell
Entry Zone 3984
Stop Loss 4008.551
Target 3950.397
Structure Sideways Breakout → Retest → Sell
Confirmation Candle Bearish Engulfing
✅ Trading Tip: Wait for clear rejection or bearish confirmation at the entry zone (e.g., wick rejection or engulfing candle) before executing the sell.
Trade ideas

Elliott Wave Analysis – XAUUSD (October 28, 2025)
🔹 Momentum
D1 Timeframe:
The momentum lines on D1 remain intertwined. When this happens, the trend often continues with candle counts that follow Fibonacci numbers (3, 5, 8…).
Currently, there are around 3 candles, indicating a high probability of a reversal forming soon, possibly today.
H4 Timeframe:
Momentum is rising, suggesting a potential short-term upward or sideways move to push momentum into the overbought zone.
If the market consolidates at this level, once momentum reaches the overbought region, another bearish leg on H4 could still occur.
H1 Timeframe:
Momentum is currently decreasing. Price is closing lower around the liquidity zone at 3994, showing signs of a liquidity sweep.
We expect price to continue moving lower toward the next liquidity zone, in alignment with the short-term bearish structure on H1.
________________________________________
🔹 Wave Structure
D1 Timeframe:
The overall wave structure remains largely unchanged. Yesterday’s strong bearish candle fits within our prior analysis, confirming that the corrective wave is still in progress.
However, since the D1 momentum lines have already stuck together for about three candles, a potential bullish reversal candle today could mark the completion of this correction.
H4 Timeframe:
The structure has broken the previous low, suggesting that this could be the final leg of wave Y (blue).
Observing the completed 5-wave structure (1–2–3–4–5 in blue), this corrective leg has now returned to the base of the previous wave 4, achieving both price and time symmetry.
→ A short-term bullish reversal is expected from the current area.
H1 Timeframe:
The prior correction formed a triangle pattern (abcde in red), which has now broken to the downside, developing into a 5-wave sequence (black).
Wave 4 (black) appears completed, and price is likely within the final wave 5 down.
🎯 Target zones for completion of wave 5 (black):
• Target 1️⃣: 3953
• Target 2️⃣: 3927
________________________________________
🔹 Trading Plan
Scenario 1:
• Buy Zone: 3955 – 3952
• Stop Loss: 3932
• TP1: 4050
Scenario 2:
• Buy Zone: 3939 – 3927
• Stop Loss: 3907
• TP1: 3994

Gold Under Pressure: Critical Support Lost, 4040 Reclaim Needed Yesterday's session provided clear confirmation of the bearish pressure building in gold as price faced strong resistance around the CPR area between 4094-4108. The early Asian session rejection was particularly telling, as buyers simply couldn't get enough strength to push through this zone. What followed was a decisive breakdown below the psychologically important 4000 level, which had been acting as major support throughout the recent price action.
For today's session, CPR zone positioned at 4001-4040. This is now our critical battleground. Bulls need to reclaim at least 4040 (CPR TC) to suggest any meaningful recovery is underway. Without a clean breakout above this level, the path of least resistance remains to the downside, and bears are firmly in control of the near-term direction. The current price structure suggests sellers are gaining confidence, especially after yesterday's breakdown.
On the downside, the first intraday support level for today is to watch at 3933. This could provide a temporary bounce zone if we see continued selling pressure. However, given the momentum shift and the loss of 4000 support, we need to approach any long positions cautiously here. The market is clearly favoring the bears at this point, and it would take a significant shift in sentiment to change that dynamic in the immediate term.
My Position : I am still managing my buy entries and currently in floating loss ,max extension that I am expecting in lower side is at around 3800-50 area and that is manageable as per my current lot sizing.

Gold Trading Strategy for 28th October 2025🌟 💰 GOLD TRADING SETUP 💰 🌟
📊 Instrument: 🟡 GOLD (XAU/USD)
🟢 BUY SETUP
➡️ Entry: Buy above the high of the 1-hour candle — once price closes above 💲4021
🎯 Targets:
🎯 T1: 💲4033
🎯 T2: 💲4045
🎯 T3: 💲4070
🛡️ Stop Loss: Below 💲4010 (or as per your risk tolerance)
🔴 SELL SETUP
➡️ Entry: Sell below the low of the 15-min candle — once price closes below 💲3944
🎯 Targets:
🎯 T1: 💲3932
🎯 T2: 💲3919
🎯 T3: 💲3903
🛡️ Stop Loss: Above 💲3955 (or as per your risk tolerance)
⚠️ Disclaimer:
📢 This is not financial advice. These are purely educational and technical analysis-based trading ideas.
💼 Always do your own research and use proper risk management before taking any trades.
📉 The market is volatile — trade at your own discretion and never risk more than you can afford to lose.

Gold Trading Strategy | October 27-28
✅ As we anticipated, gold successfully broke below the key psychological support at $4000, confirming our previous analysis.
The short positions we advised our members to place in advance have also gained over 400 PIPS in this round of the downtrend
✅ Recently, there has been a clear rotation of funds between U.S. Treasury bonds and the spot gold market.
The U.S. 10-year Treasury yield has climbed back above the 4% level, reflecting subtle market adjustments to the Fed’s rate-cut expectations this week.
This shift led to a temporary outflow of safe-haven capital, causing gold to remain under pressure.
Meanwhile, the U.S. dollar index edged down about 0.14% during the day, yet gold failed to benefit, indicating a lack of bullish confidence in the short term.
✅ On the 4-hour chart, gold continues to display a bearish structure.
After breaking below the $4000 psychological level, its downside momentum has not yet been fully exhausted.
The resistance level is seen around 4010, and if this level fails to break, gold is likely to continue weak consolidation.
The support level lies near 3945, which is a key pivot zone; if it holds, gold will likely oscillate within the 3945–4010 range in the short term.
✅ On the 1-hour chart, gold previously formed a double-top pattern, and the neckline has been clearly broken.
Price action remains below the neckline, confirming bearish dominance.
The moving averages are expanding downward, showing that bearish momentum continues.
In the short term, the 4004 level has turned from support into resistance.
As long as gold remains below this area during the U.S. session, any rebound should be viewed as a selling opportunity.
🔴 Resistance Levels: 4004 / 4010
🟢 Support Levels: 3970 / 3945
✅ Trading Strategy Reference:
🔰 If gold rebounds to the 4004–4010 zone and faces resistance, consider light short positions, with a stop loss above 4015, targeting 3970–3950.
🔰 If gold pulls back to around 3945 and holds steady, consider short-term long positions, targeting 3990–4000.
✅ Overall, gold’s short-term outlook remains bearish, with the technical structure still favoring sellers.
If the price fails to regain a foothold above 4010 tonight, it is likely to retest the 3945 support area.
Traders should remain cautious and continue to follow the trend, focusing on selling near resistance zones as the main strategy.

Gold as said on Friday until 4160 not break sell on rise Gold sell on rise recommended until 4160 not break ,
Still no buy signals sell on rise will continue
How My Harmonic pattern projection Indicator work is explained below :
Recent High or Low :
D-0% is our recent low or high
Profit booking zone ( Early / Risky entry) : D 13.2% -D 16.1 % is
range if break them profit booking start on uptrend or downtrend but only profit booking, trend not changed
SL reversal zone (Safe entry ) : SL 23.1% and SL 25.5% is reversal zone if break then trend reverse and we can take reverse trade
Target : T1, T2, T3, T4 and .
Are our Target zone
Any Upside or downside level will activate only if break 1st level then 2nd will be active if break 2nd then 3rd will be active.
Total we have 7 important level which are support and resistance area
Until , 16% not break uptrend will continue if break then profit booking will start.
If break 25% then fresh downtrend will start then T1, T2,T3 will activate
1,3,5,10,15,20 minutes are short term levels.
30 minutes 60 minutes , 2 hours,3 hours, ... 1 day and 1 week chart positional and long term levels

GOLD - ENTERS COREECTION PHASESymbol - XAUUSD
Gold is currently undergoing a corrective phase following approximately six weeks of aggressive upward movement. Price action is forming a consolidation range while continuing to pressure the support zone.
The recent record breaking rally became overheated, prompting profit-taking and long liquidation. Additionally, a gradual shift in market sentiment and macroeconomic backdrop is contributing to capital outflows. However, ongoing US–China trade negotiations, the US government shutdown, and heightened geopolitical uncertainty, including the cancellation of Trump’s meeting with President Putin, continue to pose economic risks that could provide underlying support for the precious metal.
Overall, the current pullback appears to be a healthy corrective pause within the broader structure. The 4000 level remains a critical support area. A sustained recovery above 4110 would indicate that buyers are interested, though further momentum largely depends on developments surrounding global trade policies.
Resistance levels: 4100, 4110, 4163
Support levels: 4058, 4000
A decisive breakdown of the lower boundary of the trading range could trigger a deeper corrective wave. The 4000 level is the primary focus, as strong volatility may occur around this zone. Given the current market conditions - with declines matching the previous intensity of the rally, patience is warranted until momentum stabilizes, enabling more informed technical decisions.

XAUUSD - NOV-DEC 2025 TARGET / STRATEGY analysis While BRICS is already dealing to settle payment for Trades in their Local Currency ditching US dollar, Dollar seems to Weaken Further.
US Dollar Drops 50% Against Gold Since 2021 | The Jerusalem Post
The US dollar has long seemed untouchable, but its fortress is cracking | Fair Observer
with coming Christmas Gold can see a little sell off before Gearing UP.
TARGET already marked for LONG & short both
Note: Keep Trailing once in Profit
also ALSWAY look for EMI 20,50 & 100 it works as a good Support/Resistance
Folow on X

#xauusd gold dumping is going to 3600 this is my gold analysis#xauusd gold dumping is going to 3600 this is my gold analysis #xauusd gold dumping is going to 3600 this is my gold analysis
v
#xauusd gold dumping is going to 3600 this is my gold analysis#xauusd gold dumping is going to 3600 this is my gold analysis#xauusd gold dumping is going to 3600 this is my gold analysis#xauusd gold dumping is going to 3600 this is my gold analysis
#xauusd gold dumping is going to 3600 this is my gold analysis
why the reason you can sea on my previous public post of #gold
#xauusd

Risk-On Rally Threatens Gold: Eyes on Critical $4,000 LevelGold is sliding toward the $4,000 support level as improving US-China trade deal sentiment reduces demand for safe havens.
What’s Driving the Drop:
Risk-On Shift after upbeat trade comments from Washington.
Bearish Setup as price fails to reclaim broken support.
Key Levels:
Support: $4,000. A breakdown could send prices toward $3,945.
Resistance: $4,150–$4,185 for bulls to regain control.
Bottom line: Gold is under pressure, and a move below $4,000 may trigger steeper losses.

XAUUSD – Institutional Demand Zone Setup🎯 XAUUSD – Institutional Demand Zone Setup
💡 Structure Insight:
Market formed Rally → Base → Drop → Base → Drop, completing a bearish leg.
Now, price approaching a fresh Drop–Base–Rally demand zone (green area).
🧠 Smart Money Logic:
Institutions already built liquidity with previous lower highs.
Current drop is sweeping liquidity to fill orders at the demand base.
After rejection from this zone → expect new rally formation.
📍 Plan:
✅ Wait for rejection inside the green zone.
✅ Confirm with bullish candle close or structure break.
✅ Enter long after confirmation.
🎯 Target: Blue projection area (imbalance fill zone).
🛑 Stop Loss: Below the demand base.

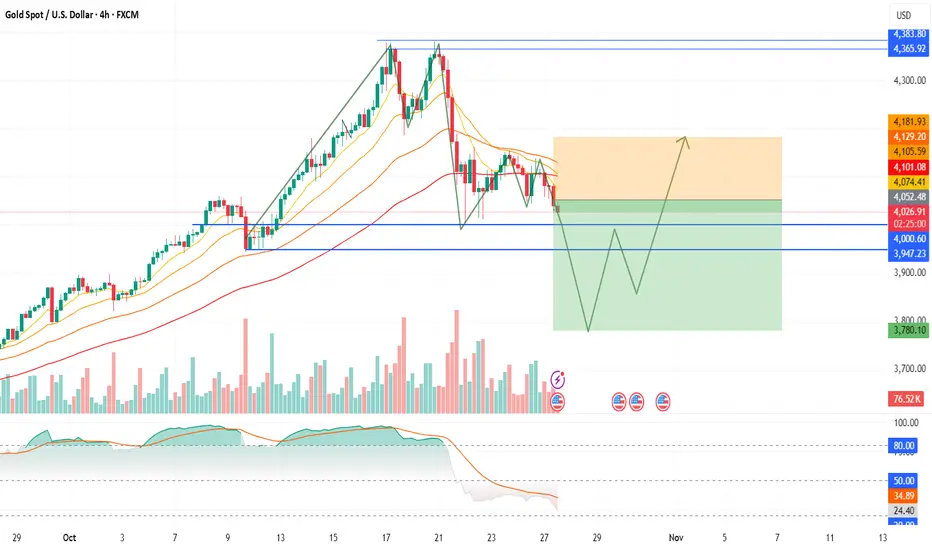
Dual-phase trading — shorting the drop, then switching to long Gold is currently trading near $4,040, and my short-term outlook is bearish, followed by a strong bullish reversal in the coming sessions.
I expect prices to decline first toward the $3,800–$3,750 zone, which aligns with key support and previous demand levels. This correction phase would complete a healthy market reset before a potential major rally begins.
Once price stabilizes around $3,800, I anticipate a sharp reversal and breakout move toward $4,200+, possibly extending higher if momentum builds.
📊 My Plan:
Bias: Bearish first → then Bullish
Short-Term Target: $3,800–$3,750
Reversal Zone: Accumulate longs near $3,800
Upside Target: $4,200+
Invalidation: Below $3,740 (on 4H closing)
This setup favors patience and dual-phase trading — shorting the drop, then switching to long for the rebound.
gold spot update at early momentum gold spot trading very high volatile and now facing strong hurdle 4065--85$ if mkt hold blw than soon 4008$---3965$ in near terms yes last low 4003$ looks some barrier.where can mkt reversal for buyer trap .
trading idea---- gold spot can selll on rise with small sl 4065 or let see tgt 4008--3965$++

Elliott Wave Analysis – XAUUSD (October 27, 2025)
🔹 Momentum
• D1 Timeframe:
D1 momentum remains clustered, suggesting that a bullish reversal could occur at any time. However, since momentum has not yet separated clearly, short-term downside pressure still exists.
• H4 Timeframe:
H4 momentum is currently declining, meaning that the downtrend could continue. We need to wait for H4 momentum to reach the oversold area and observe the market’s reaction there to determine whether the current drop is complete.
• H1 Timeframe:
H1 momentum is rising slightly, indicating the potential for a short-term rebound. However, since H4 is still in a down phase, any upward movement could face resistance near the 4098 level.
________________________________________
🔹 Wave Structure
• D1 Timeframe:
Price is currently moving sideways while D1 momentum remains stuck together, signaling a possible upcoming 5-day rally once D1 momentum turns upward into the overbought zone.
o If price fails to break above wave (3) yellow, this move is likely a wave (4) yellow correction.
o Conversely, if price breaks above wave (3) yellow, the current correction may only be a minor wave within wave (3) yellow.
________________________________________
🔹 Two Main Scenarios
1️⃣ Bullish Scenario (WXY blue completed):
If the WXY blue corrective structure has finished, the market may start a new wave (5) purple uptrend.
In this case:
• As H4 momentum moves into the oversold area, price should not fall deeply toward 4004.
• A sharp and decisive rebound from that zone would confirm this bullish scenario.
2️⃣ Bearish Scenario (Correction still in progress):
If the correction is not yet complete, the H4 decline could continue:
• Price might break below 4004, or at least retest it.
• If that happens, the downtrend could extend toward 3953 or 3927.
________________________________________
🔹 H1 Structure – Triangle Formation
On the H1 chart, price is consolidating within a contracting triangle, suggesting sideways accumulation with two possible interpretations:
• Scenario 1:
The triangle represents wave X of the WXY black structure.
When H4 momentum reaches the oversold zone and price holds above 4004, we may see an impulsive breakout toward the previous high at 4381, completing a flat correction of wave (4) yellow (D1).
• Scenario 2:
The triangle is wave (4) of wave Y blue, meaning that once completed, price could decline further toward 3953 or 3927 to finish wave Y. After that, a more stable upward wave is expected.
________________________________________
🔹 Trading Plan
Currently, price remains inside the triangle pattern:
• For experienced traders:
Wait for a breakout of either side of the triangle for direct entry.
• For more conservative traders:
Wait for Buy opportunities near strong support below.
🎯 Buy Zone: 3930 – 3927
🛑 Stop Loss: 3917
🎯 TP1: 4004
👉 If price breaks above 4149, we can look for Buy entries upon breakout, expecting an extended upward move toward 4268 or higher.

XAU/USD (Gold) chart on the 3-hour timeframe...XAU/USD (Gold) chart on the 3-hour timeframe, I can see my using the Ichimoku Cloud and have marked a range with a potential breakdown area and a target point already indicated on the chart.
Here’s what the chart suggests:
Current price: around 4031 USD
Range low (support): around 4030 USD (which is currently being tested)
Range high (resistance): around 4190–4200 USD
Breakdown target (measured move): around 3940–3950 USD
📉 Analysis:
Price has broken below the range box, indicating a bearish breakout.
The Ichimoku Cloud ahead is bearish and thick, showing potential resistance.
A measured move from the height of the range (≈ 150–170 points) projects downward to around 3940–3950 USD.
My chart already marks 3944.299 as the target point, which aligns well with this projection.
✅ Target Summary
Type Level (USD) Comment
Short-term target 3,944 Measured move target after range breakdown
Extended target 3,900–3,880 Possible continuation if bearish momentum sustains
Invalidated above 4,090–4,100 If price re-enters the range and closes above the cloud

XAUUSD Analysis - Levels and Pridiction#Gold (XAU/USD) Technical Analysis - October 27, 2025
Current Market Status: Retracement on Higher Time Frame,
Lower Timeframe Bearish Breakdown⚠️
Gold is trading at 4,033.67, having broken down from the previous #consolidation zone. The market has violated key support levels and is now showing clear bearish momentum with multiple technical confirmations.
Critical Technical Developments:
1️⃣ Triangle Pattern Breakdown (1H Chart)
The 1-hour chart reveals a confirmed triangle #pattern breakout to the downside. After breaking below the triangle support, price attempted a retest of the breakdown level around 4,093-4,144 but was rejected, confirming the pattern's validity. This is a classic bearish continuation signal.
2️⃣ Demand Zone Invalidation
A crucial demand level that previously held multiple tests has now been completely invalidated. The chart explicitly notes: "Demand Level to be invalidated to move the Price Further Down" - this condition has been met, opening the path for deeper downside movement.
3️⃣ Minor Trend Shift Level Breach
Price has broken below the **Minor Trend Shift Level** at approximately 4,093, confirming a shift from bullish to bearish short-term structure. This level now acts as resistance.
Target Zones (High Probability):
🎯 Immediate Targets:
- 3,945 - Next support cluster (current proximity)
- 3,845 - 0.5 Fibonacci retracement level (PRIMARY TARGET)
- 3,719 - 0.618 Fibonacci retracement level (EXTENDED TARGET)
The Fibonacci levels in green boxes, are the key magnetic zones for price action.
📉 Bearish Continuation (70% Probability)
Price continues lower toward 3,845, potentially extending to 3,719 if selling pressure intensifies. This move would represent a healthy correction within the broader uptrend from the yearly lows.
📈 Bullish Reversal (30% Probability)
Requires reclaiming 4,144 with strong momentum AND holding above it on daily timeframe. Only then would the bearish structure be invalidated.
Conclusion:
Gold remains in a confirmed downtrend on lower timeframes with clear downside targets visible. The invalidation of demand zones and triangle breakdown provide strong bearish confirmation. Traders should focus on the 3,845-3,719 zone as the primary area of interest for potential reversal setups. Until price reclaims 4,150+, the path of least resistance remains **DOWN**.
Risk Management: Use proper position sizing as volatility remains elevated. The 3,845 level will be crucial - watch for buyer reaction there.

GOLD (XAU/USD): THE FED AND THE FINAL DIP – GET READY TO SHORT1. MACRO SCENARIO: KYA HO RAHA HAI?
Pull Factor (For Sellers): The US-China deal framework is good news, reducing those 100% tariff fears. This is putting some halki halki (slight) pressure on Gold.
Push Factor (For Buyers): CPI figures are weak (3% inflation), which pakka (surely) means the Fed will cut rates soon. Plus, the Russia-Ukraine jhamela (trouble) is a serious safe-haven booster.
The Main Event: The FOMC decision this Wednesday is the baap (father/boss) of all events. This will decide the long-term rasta (path) for Gold.
2. TECHNICAL ANALYSIS: STRUCTURE KA RAAZ (Secret of the Structure)
Current Scene: Gold had a solid run, but now it's in a big sydeway correction. The main price trend has been broken, confirming that the immediate sentiment is bearish. Zyada (More) selling pressure is expected.
Expected Plan: Gold has likely finished its upward natak (drama) and is ready for the final, sharp dip to complete this correction phase.
The Target (Magnet): The critical Value Gap on the Daily chart (around $3,880 – $3,920) is the strongest magnet. Pakka (Definitely), the price is heading here before taking a u-turn.
ENTRY WAITING: We might see a small comeback (retest) towards the broken structure area before the big fall starts. Pura dhyan udhar hi rakhna (Keep full attention there only).
3. 💡 TRADING STRATEGY (SHORT SIDE)
We are focusing on a SHORT trade for this final correctional wave:
Best Entry Zone: $4,080 – $4,100 (Retest of the broken zone).
Booking Profit (TP1): $3,970 (Nearest Demand Zone).
Booking Profit (TP2): $3,880 (The final target at the major Daily Value Gap).
Stop Loss (SL): $4,135 (Above the main Supply Zone, for safety).
A Serious Note: Please keep your Stop Loss tight before the FOMC on Wednesday. Mazaak nahi (No joke)! This short could be the last dance before a long-term rally!
Where do you think Gold will find asra (shelter/support)? Drop your comments below!
#Gold #XAUUSD #FOMC #Trading #TradePlan

GOLD RETRACEMENT BEFORE NEXT LEG DOWN GOLD RETRACEMENT BEFORE NEXT LEG DOWN
Body: 🧭 DAILY TRADING PLAN – GOLD (XAU/USD)
Date: Oct 27, 2025
Main timeframe: M30 – H1
Strategy: SMC + Fibo Zone Reaction + OB/Trendline Confluence
1️⃣ MARKET CONTEXT
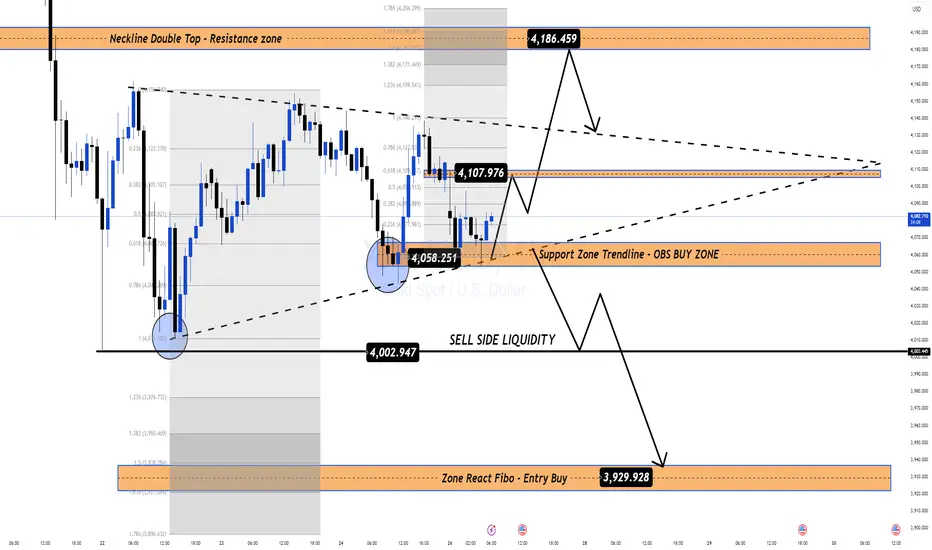
Price is consolidating after a sharp drop from 4186 → 4058.
Currently, price is trading inside a support trendline + OB BUY ZONE (4058 - 4061), showing signs of demand reaction.
Above, multiple supply zones are stacked (4093 - 4095 / 4114 - 4116 / 4135 - 4137), creating strong short-term resistance layers.
Structure remains bearish, but a corrective leg toward premium zones is likely before any continuation down.
2️⃣ BIAS
Short-term bullish retracement, then sell continuation from premium supply zones.
3️⃣ SCENARIO 1 — BUY SETUP (Short-term retracement)
Entry: 4061 – 4059
SL: 4055
TP1: 4093
TP2: 4114
RR: ≈ 1:4
Note: Only buy if price forms bullish BOS / engulf on M15 from this OB zone (confluence with Fibo 0.786).
4️⃣ SCENARIO 2 — SELL SETUP (Main setup)
Option 1:
Entry: 4093 – 4095
SL: 4100
TP1: 4061
TP2: 4002
RR: ≈ 1:5
Option 2:
Entry: 4114 – 4116
SL: 4120
TP1: 4061
TP2: 4002
RR: ≈ 1:5
If price reaches 4135 – 4137, this is an extreme premium zone (reactive Fibo + previous double top). Expect strong reaction and liquidity sweep before a larger sell-off.
5️⃣ KEY LEVELS
OB BUY ZONE: 4058 – 4061
SELL ZONE 1: 4093 – 4095
SELL ZONE 2: 4114 – 4116
SELL ZONE 3: 4135 – 4137
Liquidity Target: 4002 – 3930
6️⃣ SUMMARY
Wait for reaction at 4058 zone for short-term buy retracement.
Main idea: Sell from premium → Target liquidity below 4000.

XAU/USD – 15-Minute Timeframe Analysis (Short Bias)Market Overview
Following the latest round of China–U.S. trade negotiations, market sentiment has shifted toward a more risk-on environment, reducing demand for safe-haven assets such as gold. As optimism surrounding the talks strengthens the U.S. dollar, gold prices have continued to decline during the Asian and early European sessions.
Technical Outlook
On the 15-minute timeframe, XAU/USD maintains a clear short-term bearish structure, characterized by consecutive lower highs and lower lows. The pair is currently trading below key moving averages, reinforcing the prevailing downward momentum.
A potential retracement toward intraday resistance could present a favorable opportunity for short positions, provided that bearish price action confirms rejection at that level.
Key Resistance: 2360 – 2365 zone (previous support turned resistance)
Immediate Support: 2348 – 2350 zone
Extended Support Target: 2338 – 2340
GOLD DIVE—Sniping the $405x Dip Before FOMC!Welcome Traders! Gold (XAU/USD) is correcting sharply, dropping 1.10% towards $4,065. This weakness is driven by trade optimism, but the underlying Fed rate cut expectation keeps our BUY ON DIPS strategy highly profitable!
🧠 MARKET PSYCHOLOGY (MIND)
Bears' Power: Trade optimism is pushing safe-haven assets down. Sellers are targeting the recent uptrend structure.
Bulls' Anchor: Weak US inflation data means a Fed rate cut is almost certain (25 bps expected). This long-term USD weakness acts as a floor for Gold.
Action Bias: BUY THE DIP at critical Fibo supports, anticipating the Fed decision to fuel the next rally.
📊 KEY LEVELS & ACTION ZONES (H1)
We are using the Fibo retracement from the recent high to define our optimal entry points.
🎯 SELL TARGET / CEILING: $4,164.938 (Zone 416x). This is the immediate resistance and the ultimate target for the Long trade.
🔥 HIGH-CONVICTION BUY ZONE: $4,048.493 (Fibo 0.5 Zone 405x). The optimal entry to maximize risk/reward.
Strategy: Wait for a clean tag and H1/M30 reversal signal here.
⚡️ SCALP BUY REACT ZONE: $4,077.605 (Zone 407x). A quick bounce area for aggressive buyers.
❌ INVALIDATION: SL must be placed safely below the 0.618 Fibo level of the 405x zone.
📈 TRADING PLAN SUMMARY (DIP BUY)
Entry Focus: Prioritize the $4,048.493 (405x) Fibo Zone for a high-quality Long entry.
SL Placement: Strict SL below the 0.618 Fibo of the 405x zone.
TP Target: Aim for the recent high at $4,164.938 (416x).
💬 TRADER'S QUESTION
The drop is here! Are you buying the aggressive 407x level or patiently waiting for the optimal 405x Fibo zone before the expected Fed cut rally?

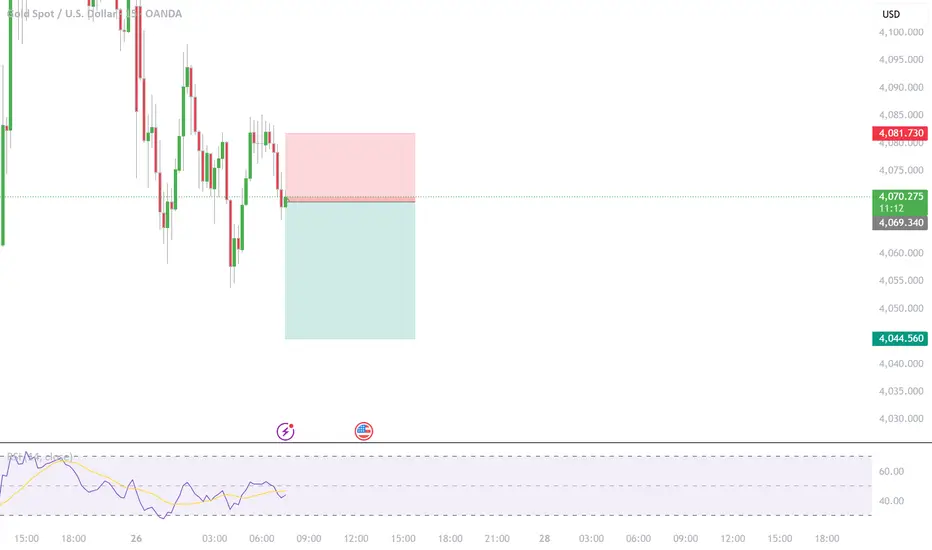
Breakout Setup on Gold (XAUUSD) — Upside Move ExpectedPrice action is consolidating within a descending channel on the 30-minute timeframe. A breakout above the descending trendline has formed, suggesting potential bullish momentum. The current support zone is around the 4070 level, aligning with the lower trendline of the structure.
Technical View:
Pattern: Descending channel breakout
Entry zone: 4070–4080 (post retest)
Target zone: 4120 resistance area (previous structure high and supply zone)
Stop loss: Below 4040 trendline. support
This setup favors a long position with a favorable risk-reward ratio. A clean break and hold above 4080 increases the probability of a push toward 4120. A failure to hold the retest would invalidate the setup.

[XAUUSD] New Week Scenario: Accumulation Awaiting Drop New Week Scenario: Accumulation Awaiting Drop - Watch for Selling at Liquidity Zone $4195
Hello traders community,
The new week begins with XAUUSD (Gold) being "restrained" in a sideways structure. However, don't let this calm deceive you. Technically, this is an accumulation pattern with a clear bearish bias.
The market is in "wait" mode, and patience will be the key to catching the next big wave.
📰 MACRO ANALYSIS: TUG OF WAR AHEAD OF FOMC
The market is caught between two opposing streams of information:
Bearish Pressure: Positive signs of a US-China trade deal are reducing the demand for safe-haven assets, putting pressure on Gold prices.
Bullish Support: The weakening USD due to expectations that the Fed will continue to cut interest rates, inadvertently provides some short-term support for the precious metal.
Decisive Factor: Traders are "lying low" waiting for this week's two-day monetary policy meeting (FOMC). This will be the main event, determining the medium-term trend of USD and Gold.
📊 TECHNICAL ANALYSIS: CONTINUATION OF BEARISH STRUCTURE
The H1 chart shows a very clear "Sell" scenario:
Price Structure: After a strong drop from the peak, the price is moving sideways in an accumulation pattern of a bearish pennant. This is a continuation structure, indicating that the Sellers are "resting" before pushing the price further down.
Ideal Sell Zone: The $4195 zone is an extremely strong resistance confluence, marked as "Liquidity strong" on the chart.
This is the 0.5 Fibonacci level, the "golden" retracement point of the entire previous decline.
This is the old support zone now turned into new resistance.
Optimal Scenario: We will wait for the price to pull back to test the $4195 liquidity zone. This is an opportunity for Sellers to enter the market with low risk and high profit potential.
🎯 TRADING PLAN (SELL SETUP)
Absolute priority is to Watch for Selling (Sell) in line with the main trend.
ENTRY (Sell): $4195
STOP LOSS: $4205
TAKE PROFIT: TP1: $4168-TP2: $4145-TP3: $4122-TP4: $4102
SUMMARY
In the context of the market awaiting FOMC news, Gold is likely to make a final "pullback" to the $4195 zone before continuing its downtrend. Be patient and wait for signals at this ideal sell zone.
Wishing traders a successful and disciplined new trading week!

Gold Awaits FOMC Breakout While Holding Key Liquidity BaseMarket Overview:
Gold remains trapped in a tight range as traders weigh optimism from US–China trade progress against cautious expectations for the upcoming FOMC meeting.
The macro picture feels balanced: risk sentiment improves, yet the weaker USD and lingering Fed cut expectations quietly support the metal.
In essence, gold isn’t trending — it’s coiling.
Liquidity is being built, not lost.
Every test of 4,050–4,060 shows strong absorption, while short-term sellers are still defending the 4,186–4,260 region.
The market is waiting for a trigger,
and the FOMC might be the one that decides which side breaks first.
Technical Structure (H1)
Price continues to respect the ascending support trendline from 4,003 and the neckline resistance near 4,107.
This structure has the DNA of a compression model — narrowing volatility, thinning liquidity, preparing for expansion.
If the support at 4,050 holds, a retest of 4,107 → 4,186 remains likely before the next decision point.
Conversely, a liquidity sweep under 4,002 could form the last dip before a bigger rally unfolds.
Key Structural Levels:
Support / Accumulation Zone: 4,058 – 4,050
Mid-Level Pivot / Neckline: 4,107
Upper Supply Zone: 4,186 – 4,260
Deep Liquidity Pool: 4,002 – 3,930
MMFLOW Perspective:
For now, gold is accumulating energy — this is not a breakout market, it’s a build-up market.
Price action above 4,050 still favours the bulls, but conviction will only return once we see a clean break beyond 4,186.
Ahead of FOMC, patience is strategy.
The next wave won’t come from guessing policy —
it’ll come from reading the flow once volatility hits.
Summary:
Gold’s structure remains stable — liquidity is concentrated below 4,050, and compression continues within the 4,060–4,186 band.
Bias stays neutral-to-bullish as long as the liquidity base holds.
📊 What’s your take?
Will the FOMC spark the breakout, or is gold just reloading for the next wave?
👉 Follow MMFLOW TRADING for institutional flow analysis and smart money structure updates.