Gold 1H – Slight Correction or Bullish Reaccumulation Ahead?XAUUSD – Intraday Trading Plan | by Khang_Trader
📈 Market Context
Gold is currently trading around $4,110/oz as traders digest a mix of macroeconomic signals and shifting expectations surrounding the Federal Reserve’s next moves.
The market focus today centers on U.S. housing-starts and jobless-claims data.
Strong data → could trigger short-term selling pressure on gold.
Weak data → may fuel safe-haven demand, extending the current rally.
Treasury yields remain steady, while dovish rate-cut bets for early 2026 are gaining traction.
Expect liquidity sweeps around session highs/lows before a clear directional move, as institutional traders fine-tune their positioning within the week’s range.
🔎 Technical Analysis (1H / SMC Perspective)
The overall market structure remains bullish, with recent BOS confirming continuation after a prior accumulation phase.
A minor Change of Character (ChoCH) has appeared, signaling a short-term correction — likely a liquidity grab before the next bullish leg.
Liquidity below $4,090-$4,100 has been swept, bringing price into the discount zone near $4,050-$4,080.
A potential re-accumulation zone is forming around that area — buyers should wait for M15/M30 BOS or ChoCH confirmation before entering.
Upside liquidity targets align with the $4,350-$4,380 region — a premium supply zone where sellers may re-enter.
🔴 Sell Setup
Entry: 4378 – 4376
Stop-Loss: 4386
Take-Profit Targets:
1️⃣ 4325
2️⃣ 4260
📌 Only consider this setup if price reaches the supply zone and shows bearish confirmation (BOS/ChoCH on lower timeframe).
🟢 Buy Setup
Entry: 4050 – 4080
Stop-Loss: 4045
Take-Profit Targets:
1️⃣ 4150
2️⃣ 4300
3️⃣ 4350 +
📌 Look for BOS or ChoCH confirmation on M15 before execution. Avoid entering right before U.S. data releases.
⚠️ Risk Management Tips
Avoid trading during high-impact news — spreads can widen and cause slippage.
Scale in/out gradually; take partial profits at liquidity zones.
Once structure confirms continuation, trail stop-loss to lock profits.
A clean break below $4,000 would invalidate the bullish continuation scenario — re-evaluate bias if that happens.
Maintain a clear Risk : Reward ratio (ideally 1 : 3 or better).
✅ Summary
Bias: Bullish as long as price holds above $4,000.
Buy zone: 4050-4080 (watch for confirmation).
Sell zone: 4376-4378 (look for reaction and BOS down).
Key invalidation: Below 4000.
Watch U.S. data this session — it will likely dictate short-term volatility and direction.
FOLLOW RYAN FOR MORE USEFUL TRADING IDEAS!!!
Trade ideas

XAUUSD Intraday Trade Plan | Buy @ 4060Gold (XAUUSD) is attempting to hold above the 4060 support zone — a key level that acted as a strong base in previous sessions.
If this level continues to hold, we could see a potential bullish rebound in the intraday session.
📊 Trade Setup:
Buy Zone: 4060 – 4062
Stop Loss: 4052
Target 1: 4075
Target 2: 4090
💡 Analysis:
Price action is showing signs of demand re-entering near the 4060 level, suggesting buyers are defending this zone.
A clean break and hold above 4070 could trigger momentum toward 4090.
However, a breakdown below 4052 would invalidate the setup.
🧭 Bias: Intraday Bullish (above 4060)
⚠️ Risk Disclaimer: This is not financial advice. Manage your risk accordingly.

Plan |Gold Gradually Accumulating, Ready for a Rebound Wave?🔍 Market Context
After reaching the historical peak ATH GOLD 4,371 USD , gold underwent a deep correction, breaking the short-term bullish structure (BoS) and retesting the OB Bearish zone above .
However, since the price returned to the 4,040 – 4,060 USD area, the market has clearly shown signs of liquidity absorption ($$$) and maintained an internal uptrend line, indicating that buying momentum is returning.
The current structure suggests gold is in a re-accumulation phase before forming a medium-term rebound wave towards the 4,185 → 4,243 USD zone.
The buyers hold the advantage as long as the price does not break the main support trendline.
💎 Key Technical Structure
Support Zone: 4,040 – 4,060 USD → a strong support zone confluencing with the trendline, where institutional buying forces have appeared.
Support Trendline: connecting the series of higher lows from 15/10 → the short-term trend remains bullish.
Liquidity Zone $$$: 4,060 – 4,080 → supply absorption zone, confirming its role as a “price base”.
Resistance Zone: 4,149 – 4,185 → the first resistance zone to break to confirm the recovery momentum.
Target FVG / Supply Zone: 4,243 – 4,250 → potential profit-taking zone or point to consider reversal.
Current structure:
→ Short-term: bullish corrective move.
→ Medium-term: potential for forming an extended recovery wave if it holds above 4,040 USD.
📈 Trading Scenarios
1️⃣ BUY Setup – Retest Trendline / Liquidity Zone 4,060 USD
Entry: 4,060 – 4,070
SL: 4,035
TP1: 4,149
TP2: 4,185
TP3: 4,243
✅ Condition:
Price touches the trendline or liquidity zone 4,060 and shows a bullish reversal signal (rejection / bullish engulfing).
➡️ This is a high-probability setup, confluencing the trendline structure + liquidity support zone, often where large buyers re-enter the market.
2️⃣ BUY Setup – Break & Retest resistance zone 4,149 USD
Entry: 4,149 – 4,155
SL: 4,130
TP1: 4,185
TP2: 4,243
✅ Condition:
Wait for the price to break the resistance zone 4,149 with strong volume, then lightly retest without closing the candle below 4,130.
➡️ Trend-following setup – confirms the return of buying momentum and extends the target to the FVG zone 4,243 USD.
3️⃣ SELL Setup (Scalp Reaction) – FVG 4,243 USD
Entry: 4,240 – 4,245
SL: 4,255
TP: 4,185 → 4,150
✅ Condition:
Only execute if there is a strong reaction at FVG 4,243 without a continuation break signal.
➡️ Short-term technical sell – exploiting the supply zone reaction, do not hold the position long.
⚠️ Risk Management
Prioritise trading in the buy direction, avoid selling against the main trend.
If H2 closes the candle below 4,035 → bullish scenario invalid, wait for a new structure.
Do not FOMO buy in the middle range (4,090–4,130).
Keep moderate volume, move SL to breakeven when the price exceeds 4,149.
💬 Conclusion
Gold is in an ascending re-accumulation phase after a strong decline.
As long as the price holds the trendline and support zone 4,040 – 4,060 USD, there is a high chance gold will rebound following the liquidity + breakout retest model, with the main target being 4,185 → 4,243 USD .
If it breaks through 4,243 USD, the market may trigger a stronger recovery momentum towards 4,300 – 4,340 USD .
👉 Reasonable Strategy:
Buy 4,060–4,070 → TP 4,185 / 4,243 USD
Add Buy when breaking 4,149 USD with volume confirmation.
Technical Sell 4,243 USD if there is no signal to break higher.
🔥 “As long as 4,040 holds, gold remains in accumulation — patience will pay.”
⏰ Timeframe: 2H
📅 Update: 27/10/2025
✍️ Analysis by: Captain Vincent

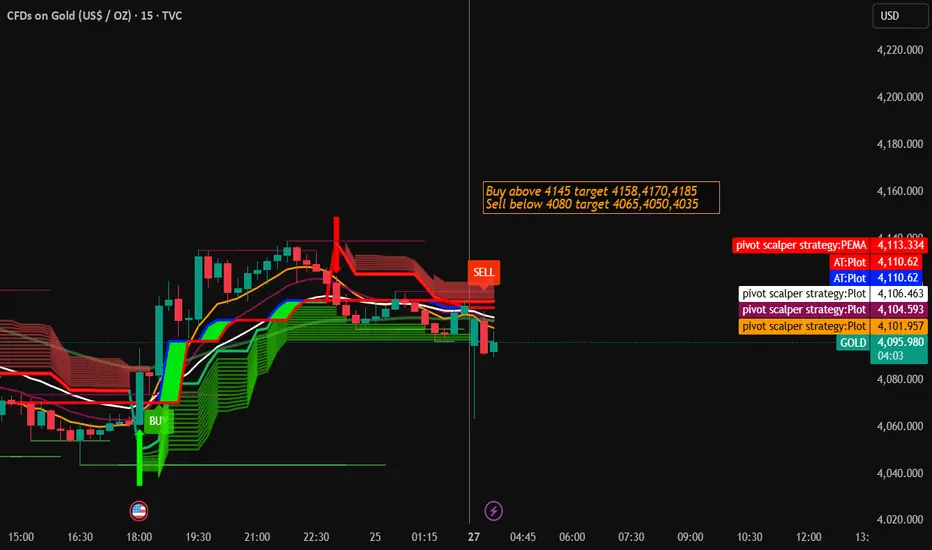
Gold Trading Strategy for 27th October 2025🪙 GOLD ($XAU/USD) Trading Plan
📈 Buy Setup
Entry: Buy above the high of the 30-minute candle, only if price closes above $4145
Targets:
🎯 1st Target: $4158
🎯 2nd Target: $4170
🎯 3rd Target: $4185
Stop Loss: Below the breakout candle’s low
Notes:
A strong close above $4145 could indicate bullish momentum continuation. Watch for volume confirmation before entry.
📉 Sell Setup
Entry: Sell below the low of the 1-hour candle, only if price closes below $4080
Targets:
🎯 1st Target: $4065
🎯 2nd Target: $4050
🎯 3rd Target: $4035
Stop Loss: Above the breakdown candle’s high
Notes:
A decisive close below $4080 may trigger a downside move — confirm with bearish momentum before taking a short position.
⚠️ Disclaimer
📜 This analysis is for educational and informational purposes only and does not constitute financial advice. Trading involves substantial risk, and you should consult your financial advisor before making any investment decisions. The author is not responsible for any losses incurred while following this analysis.
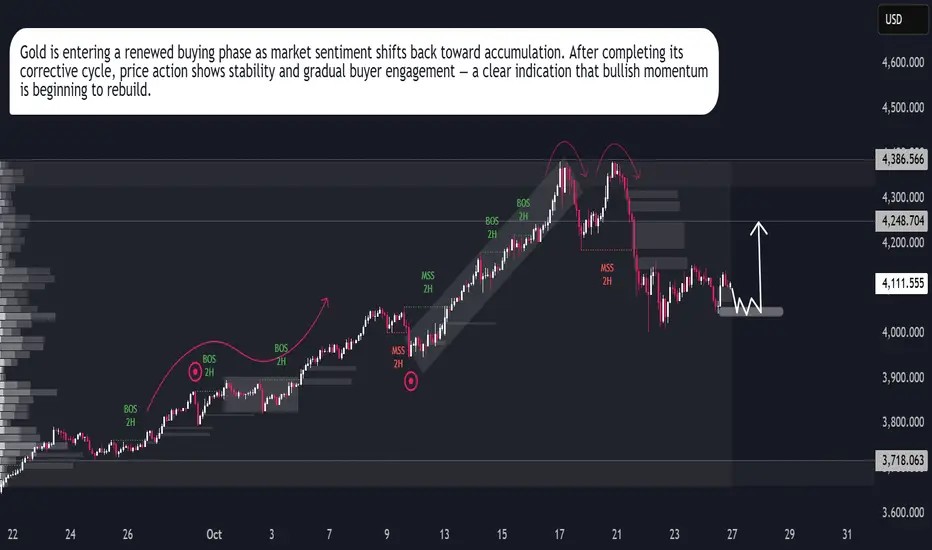
Gold Forecast — Market Turning BullishGold (XAU/USD) maintains a strong long-term bullish trend, supported by rising investor demand and global macroeconomic stability. After completing a healthy correction phase, the market is showing renewed strength, indicating a potential continuation of the broader uptrend.
Current price action reflects accumulation behavior among institutional traders, signaling confidence in gold’s long-term value growth. The consistent pattern of higher lows and steady momentum suggests that buyers are firmly in control, preparing for another upward expansion cycle.
From a fundamental perspective, global inflation concerns, a weaker U.S. dollar, and geopolitical tensions continue to support gold prices. Investors are increasingly seeking protection in safe-haven assets, which further strengthens gold’s long-term position in the market.
Technical structure and sentiment both align with a buy-side outlook, highlighting the potential for gold to extend gains as liquidity continues to build in the current price zones.
In summary, gold remains in a strong buying phase, with market data, investor sentiment, and macroeconomic indicators all favoring sustained upward momentum.
Keywords: Gold forecast, XAU/USD analysis, gold long-term trend, gold price outlook, bullish gold market, gold accumulation phase, forex gold trading, gold price prediction 2025.
XAUUSD: Structure Broken! Can the Fed Rate Cut Save Gold?Gold has just completed its first losing week in 10, after a historic rally. Following the record peak of $4,381.21, Gold experienced a sharp correction driven by profit-taking and easing US-China trade tensions. However, weaker-than-expected US CPI data has strongly reinforced expectations for an upcoming Fed rate cut, creating a significant market conflict.
I. MARKET CONTEXT ANALYSIS (H4)
Structure: The prior bullish structure has been broken, shifting the bias to bearish in the short term.
Liquidity: Market forces are now targeting key stop-loss zones to collect liquidity before the next major move.
Strategy: We look to Sell when price pulls back to the Supply Zone (Premium) and Buy when price sweeps liquidity into the strong Demand Zone.
II. DETAILED TRADING PLAN
1. SELL Scenario 📉 (At Supply Zones)
Trade 1:
Entry: $4,202 - $4,204
SL: $4,212
TP: $4,194 / $4,184 / $4,174 / $4,164
Trade 2:
Entry: $4,252 - $4,256
SL: $4,272
TP: $4,236 / $4,216 / $4,196 / $4,176
2. BUY Scenario 📈 (At Demand Zones)
Trade 1:
Entry: $4,158 - $4,161
SL: $4,151
TP: $4,168 / $4,178 / $4,188 / $4,198
Trade 2 (Critical):
Entry: $3,966 - $3,969 (Strong Demand Zone, post-liquidity sweep)
SL: $3,949
TP: $3,989 / $4,009 / $4,029 / $4,049
III. RISK MANAGEMENT NOTE
Capital: Always limit risk to ≤ 1% of capital per trade.
Confirmation: Prioritize waiting for reversal confirmation on lower timeframes (M15/M5) to optimize Risk/Reward ratio.
This is the decisive moment! Trade safe and good luck!
#XAUUSD #Gold #GoldAnalysis #Forex #Trading #Fed #Inflation

gold to the 5kcan correct till 3800 range with 50% Fibonacci retracement and after that move to 4800-5000 range with ABCD harmonics pattern.

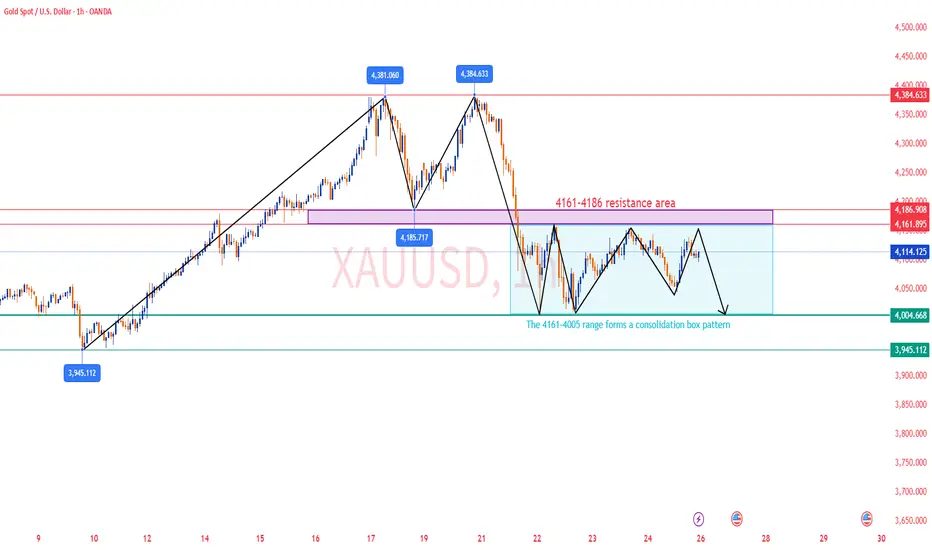
Gold Analysis and Trading Strategy for next week✅ This week, gold closed with a long upper shadow candle, indicating strong selling pressure at higher levels. Since rising from 3311 on August 20, the weekly chart has recorded nine consecutive bullish candles, and this week marks the first bearish close, suggesting that the long-term uptrend is losing momentum and market sentiment is turning cautious. Structurally, the medium-term bullish strength is weakening, and if gold fails to stabilize, it may gradually enter a corrective phase.
✅ The Federal Reserve’s interest rate decision will be announced next Wednesday. If the outcome and statement do not trigger significant changes in policy expectations, market volatility is likely to remain limited, and gold will probably continue oscillating within the $4000–$4200 range. It’s worth noting that rate-cut expectations have already been largely priced in; if the statement leans hawkish, gold may face short-term pressure, while a dovish tone or any geopolitical risk events could trigger a temporary rally.
✅ On Friday, the daily candle formed a long lower shadow of about $70, indicating solid buying interest at the bottom. A short-term technical rebound is possible; however, if the rebound fails to break above previous highs, gold could easily form a “spike and drop” pattern.
✅ On the 1-hour chart, the structure currently shows a “double-top + consolidation” pattern, with key resistance near 4160–4161.
If gold breaks and holds above 4161, it could form a “triple-bottom” structure on the 1-hour chart, opening room for a further rise toward 4200.
However, if the rebound fails below 4160, short-term momentum will likely remain weak and range-bound.
Key support is seen near 4010–4005, and a breakdown below this level could trigger a retest of 4000.
🔴 Resistance Levels: 4160–4185
🟢 Support Levels: 4010–4005
✅ Trading Strategy Reference:
🔰 If gold rebounds to 4160–4150 and faces resistance, consider light short positions, with a stop loss 8-10$ and targets at 4100–4050.
🔰 If gold pulls back to 4010–4005 and stabilizes, consider short-term long positions, with a stop loss below 3995 and targets at 4080–4100.
✅ After nine consecutive weeks of gains, gold’s first bearish weekly candle shows diminishing upward momentum. In the short term, the market remains in a sideways consolidation phase. Focus on the 4160 breakout zone and the 4000 support area. Before a clear breakout occurs, maintain a range-trading strategy, selling at highs and buying at lows, with strict risk management.
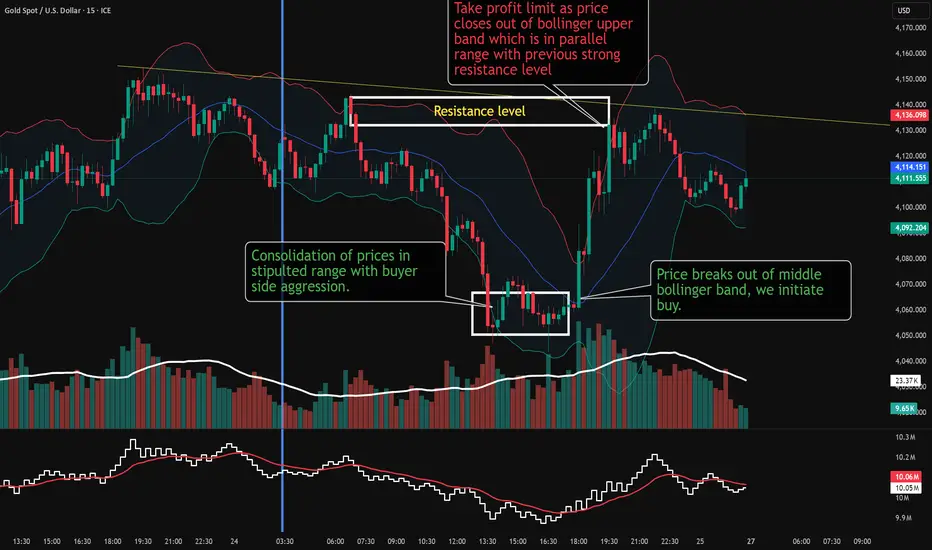
How to Initiate buy side with volume accumulation confirmation.This chart illustrates a structured educational trade analysis on the XAU/USD (Gold vs US Dollar) instrument, showing how a professional analyst guides students through a trade setup using volume, price action, and Bollinger Bands.
Market Context
The chart begins during a high-volatility news event from the USA. Post-news, a large bullish candle formed with significant **impulse buyer volume**, indicated by the sharp price rise and high-volume bars. These **impulse buyers** enter aggressively after news releases but tend to **book profits soon after**. Analysts refer to them as opportunity creators because their trading footprints (volume clusters) reveal strong demand zones, which can later serve as high-probability entry points.
Identifying Opportunity Zones
The analyst points out that volume added beyond previous clusters signifies **fresh bullish participation**, confirming that strong buyers entered the market. This leaves a "volume footprint" — a strong **support level** around the base of that bullish candle. The teaching point here is that whenever price later revisits such a volume zone, it becomes a **potential re-entry area** aligned with institutional activity.
Trade Execution
Later, the same volume levels were retested, as shown in the chart. When price revisited this zone with declining bearish pressure and stable volume, the analyst initiated a **buy trade**. This buy aligns with:
- Retest of volume-supported demand area
- Lower band support of Bollinger Bands
- Confirmation of slowing volatility
This setup is a classic “volume-backed retest entry.”
Profit Booking and Volatility Analysis
As price climbed higher, **profits were booked** near the upper Bollinger Band, signaling volatility slowdown. The analyst explains that this is where price expansion peaks, and short-term traders ideally reduce or close positions to lock in profits. The Bollinger Band compression afterward suggests reduced volatility and temporary consolidation.
Key Educational Insights
1. Impulse volume after major news creates future trade opportunities.
2. Volume footprints** reveal institutional trading zones; retests of these zones are high-probability entries.
3. Bollinger Bands help identify overextension (for exits) and contraction phases (preparing for next moves).
4. Combining **volume + structure + volatility** improves timing and conviction in trade entries and exits.
In summary, the analyst demonstrates how to transform raw post-news volatility into an educated, systematic trade using volume behavior and volatility tools to guide student traders in professional decision-making.
General difference between gold pricesGeneral difference between gold prices to show how etf vs actual gold perform

XAUUSD/GOLD WEEKLY SELL PROJECTION 26.10.25Here’s a clear explanation of the 4H SELL SETUP shown in your chart 📊👇
📌 Chart Breakdown (XAU/USD — Gold 4H)
Pattern: Rising wedge / structure breakdown
Trendline: “4H Uptrend Line – Broken” ✅
Candle signal: Bearish Engulfing at ATH (strong reversal confirmation)
🧭 Key Levels
🟥 Stop Loss: Around 4,225.640 (above structure high)
🟡 Entry Zone: ~4,192 (below trendline break)
🟢 Targets:
TP1: 4,125
TP2: 4,075
TP3: 4,031
🧠 Trading Logic
Market formed a Bearish Engulfing at the top.
The main trendline was broken, indicating possible trend reversal.
After a retest of the broken structure, price is expected to continue downward.
Multiple TPs (TP1, TP2, TP3) help scale out profits gradually.
SL is placed above the previous high to protect against a fake breakout.

Gold possible scenarioHello Traders, I am showing line chart where you cant see candle bcoz i want to show to you structure of market.
On my chart you can see 2 possible scenario, According to Daily Tf wave 5 is going on if 4380 area remain intact after possible fed rate cut decision then price will definitely come downside,
one more upside move expected but its early to say on monthly chart price is in still wave 3 of 3 so correction wave 4 will definitely come soon or later.( (may be begin)
correction wave 4 should come atleast bottom of wave 4 and maximum in wave 2.
Note: Its my analysis not trading advise so plan your trade very carefully. All the best for all.

Retail Investors and Algorithm AdvantagesIntroduction
In the modern financial ecosystem, retail investors—the individual investors who buy and sell securities for their personal accounts—are increasingly sharing the stage with institutional investors powered by sophisticated algorithms. The rise of algorithmic trading, machine learning, and data-driven investment strategies has created a paradigm shift in markets worldwide. For retail investors, this duality represents both opportunities and challenges: they have access to tools that were once exclusively the domain of professional traders, yet they also face markets increasingly influenced by speed, precision, and automation. Understanding the interplay between retail investment behavior and algorithmic advantages is critical to navigating contemporary financial markets.
Who Are Retail Investors?
Retail investors are non-professional market participants who invest their personal funds in stocks, bonds, mutual funds, ETFs, cryptocurrencies, and other financial instruments. Unlike institutional investors—such as hedge funds, pension funds, and mutual funds—which handle large sums and deploy complex trading strategies, retail investors typically operate with smaller capital and limited resources. Traditionally, retail investors relied heavily on brokers, financial advisors, and news media to make investment decisions.
Characteristics of Retail Investors
Limited Capital: Retail investors often trade in smaller volumes, which reduces their market influence but increases their susceptibility to volatility.
Behavioral Biases: Emotional decision-making, overconfidence, and herd behavior can influence retail trades, leading to inconsistent results.
Access to Technology: Recent advances in digital platforms have democratized access to market data, analysis tools, and even algorithmic trading software.
Long-term vs. Short-term Goals: Retail investors may pursue retirement savings, wealth creation, or speculative gains, unlike institutional investors focused on large-scale portfolio optimization.
Algorithmic Trading: An Overview
Algorithmic trading, or algo-trading, involves the use of computer programs to execute trades automatically based on predefined criteria. These algorithms can analyze vast amounts of data, identify patterns, and execute orders at speeds impossible for humans. Algorithmic trading can be broken down into several categories:
High-Frequency Trading (HFT): Executing thousands of trades per second to exploit small price discrepancies.
Statistical Arbitrage: Leveraging mathematical models to identify mispriced securities and market inefficiencies.
Trend Following Algorithms: Using historical price trends to predict future movements.
Machine Learning Algorithms: Learning from historical market data to adapt to new patterns over time.
Advantages of Algorithms for Retail Investors
Algorithmic trading is no longer confined to institutional investors. The democratization of technology has enabled retail investors to harness algorithmic advantages. Here are key benefits:
1. Speed and Efficiency
Algorithms can execute trades within milliseconds, far faster than human capabilities. For retail investors, speed is crucial in volatile markets where prices can change in seconds. Many trading platforms now provide retail traders access to execution algorithms that reduce latency, prevent slippage, and optimize order timing.
2. Emotion-Free Trading
Retail investors often succumb to fear, greed, and panic—buying during market peaks and selling during troughs. Algorithms operate purely on logic, removing emotional biases. By following a disciplined set of rules, retail investors can maintain consistency, minimize impulsive trading, and adhere to predefined risk-management strategies.
3. Backtesting and Strategy Optimization
Algorithms allow retail investors to test trading strategies against historical data before committing real capital. Backtesting provides insights into potential profitability, risk exposure, and drawdowns, enabling retail investors to refine strategies systematically rather than relying on guesswork.
4. Diversification and Portfolio Management
Algorithmic tools allow retail investors to manage multiple assets simultaneously. Automated portfolio rebalancing, risk assessment, and optimization can be achieved without manually tracking every position. This scalability enhances the efficiency of retail investment management.
5. Access to Complex Strategies
Before technological advancements, complex strategies such as options hedging, pair trading, or momentum-based trading were mostly inaccessible to retail investors due to computational or informational constraints. Algorithmic trading platforms now enable retail investors to implement sophisticated strategies with minimal manual intervention.
6. Reduced Transaction Costs
Many algorithms are designed to minimize transaction costs through optimal order execution, splitting orders to reduce market impact, and using predictive models to anticipate liquidity. For retail investors, these cost-saving advantages can significantly improve net returns over time.
Challenges and Risks for Retail Investors Using Algorithms
Despite the advantages, retail investors face unique challenges when using algorithms:
Over-Reliance on Technology: Blindly trusting algorithms without understanding underlying mechanics can be risky. A poorly designed algorithm can amplify losses.
Market Competition: Algorithms deployed by institutional investors often have access to superior data, faster execution speeds, and advanced infrastructure, putting retail traders at a relative disadvantage.
Data Limitations: Accurate algorithmic trading requires high-quality data. Retail investors may lack access to premium market data, potentially reducing algorithm effectiveness.
System Failures: Glitches, server downtime, or software errors can lead to unintended trades or significant losses.
Regulatory Risks: Automated trading is subject to market regulations to prevent manipulation and excessive volatility. Retail investors must ensure compliance with evolving rules.
How Retail Investors Leverage Algorithmic Advantages
Retail investors adopt algorithmic advantages through several approaches:
1. Algorithmic Trading Platforms
Platforms like Interactive Brokers, MetaTrader, Zerodha Streak, and Tradestation allow retail investors to design, test, and execute trading strategies automatically. These platforms offer user-friendly interfaces, reducing the need for deep programming expertise.
2. Copy Trading and Social Algorithms
Some platforms enable retail investors to copy trades from successful algorithmic traders or “quants.” This approach provides indirect access to sophisticated strategies without the need for technical coding skills.
3. Robo-Advisors
Robo-advisors leverage algorithms to manage investment portfolios, adjusting asset allocation based on risk tolerance, market conditions, and long-term goals. For retail investors, robo-advisors offer low-cost, automated, and disciplined portfolio management.
4. Data-Driven Decision Making
Retail investors can use algorithms to process market news, social media sentiment, and economic indicators to make informed investment decisions. For example, sentiment analysis algorithms can detect market trends early, providing a competitive edge.
Case Studies and Real-World Examples
Retail Algorithm Adoption in Equities: During recent market volatility, retail investors using algorithmic trading platforms were able to automate buy-and-hold strategies, reducing panic-selling behavior and capturing rebound opportunities.
Cryptocurrency Markets: Retail investors actively use algorithms for crypto trading, executing arbitrage and trend-following strategies in highly volatile environments. Algorithms provide a crucial speed advantage, given the 24/7 nature of crypto markets.
Options Trading: Retail traders increasingly rely on automated options strategies, such as straddles, strangles, and spreads, executed with precise timing and risk controls.
Strategic Implications
The fusion of retail investing and algorithmic trading has long-term implications for market dynamics:
Increased Market Efficiency: Algorithms help reduce pricing inefficiencies, benefiting both retail and institutional investors.
Changing Investor Behavior: Automation reduces the influence of human emotions on markets, potentially leading to more rational trading patterns.
Leveling the Playing Field: Access to algorithmic tools empowers retail investors to compete more effectively against larger institutional players.
Innovation in Financial Products: The rise of retail algorithmic trading encourages financial institutions to create new investment products, platforms, and educational tools catering to tech-savvy individuals.
Conclusion
The convergence of retail investors and algorithmic trading represents a transformative shift in modern financial markets. Retail investors, once limited by capital, information, and execution speed, now have access to tools that enhance speed, reduce emotional biases, enable complex strategies, and optimize portfolio management. However, this advantage comes with challenges: technological reliability, competition from institutional players, data limitations, and regulatory compliance.
Ultimately, the successful retail investor in today’s environment is one who leverages algorithms not as a replacement for judgment, but as an augmentation of research, strategy, and disciplined trading. By integrating human insight with algorithmic precision, retail investors can navigate markets more effectively, reduce risks, and capitalize on opportunities that were previously beyond reach. The future of investing is increasingly hybrid—where the speed of machines meets the strategic thinking of individuals.

Long gold We are in 5th wave
As per wave analysis still gold in larger 3 wave so we have patiencely sit on 3rd wave.
Let’s decode internal of 3rd wave
4th wave near end and soon start 5th wave rally
Do trade at your own risk

How Smart Money Moves Gold (XAUUSD)Every spike, every fake breakout, every sharp reversal… it’s all part of a bigger plan by smart money (institutions) to trap emotional traders and collect liquidity.
Let’s break it down 👇
⚡ 1️⃣ Liquidity Grab (The Trap Phase)
Before any real move, gold sweeps stop-losses above highs or below lows.
Retail traders think it’s a breakout — but it’s actually a liquidity hunt.
Smart money fills large positions here while emotions run high.
⚡ 2️⃣ Market Structure Shift (The Clue)
After collecting liquidity, watch for a BOS (Break of Structure) or CHoCH (Change of Character) — these reveal when the real move is starting.
⚡ 3️⃣ Smart Money Entry (The Real Move)
Once the trap is set, gold often makes a strong impulsive push.
This is where institutions enter — and where smart traders follow with confirmation, not emotion.
⚡ 4️⃣ Emotional Traders Lose, Logical Traders Win
The market doesn’t hate you — it simply feeds on emotional reactions.
Be patient, wait for liquidity sweep ➜ structure shift ➜ confirmation entry.
🧭 Pro Tip:
👉 Stop chasing candles.
👉 Study liquidity and market structure.
👉 Let the chart show who’s trapped — and then trade against them.
💬 Remember:
“The market rewards patience, not panic.”
💎 Gold (XAUUSD) moves on liquidity — not luck.
#TradeSmart #ThinkLikeInstitutions #XAUUSD


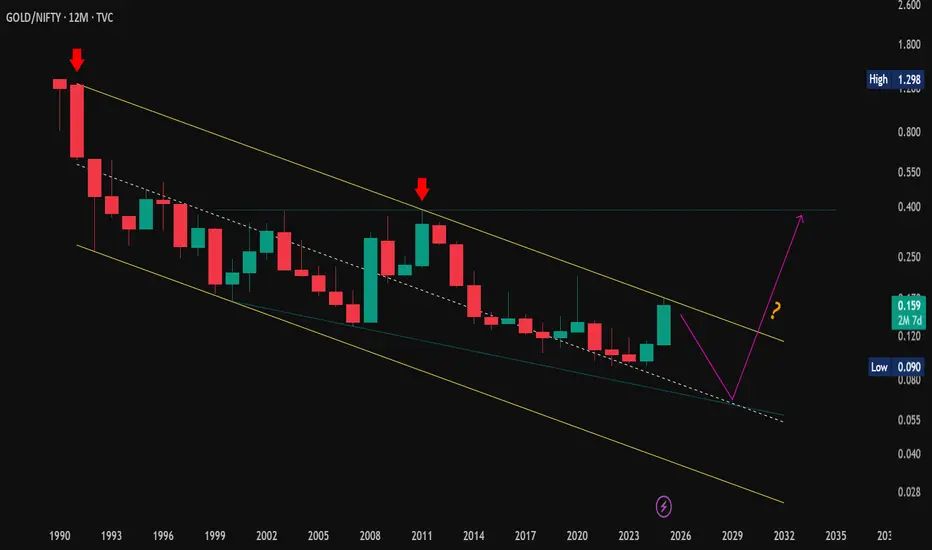
30-Year Downtrend Tested — Can Gold Break the Chain?🥇 #GOLD/#NIFTY Ratio (Yearly Chart)
📊 What Is the GOLD/NIFTY Ratio?
This ratio tracks how Gold performs vs. Indian equities (NIFTY) over time.
📈 Ratio ⬆️ → Gold outperforming NIFTY
📉 Ratio ⬇️ → NIFTY outperforming Gold
📍 Current Market Setup:
Trading inside a long-term falling channel (35 years) - consistent lower highs & lower lows
Recently made a strong rebound from the lower boundary, but the LH–LL structure remains valid
📈 Trend Insight:
✅ Primary Trend: Long-term downtrend (favoring equities)
⚠️ Short-Term: Momentum turning positive — possible medium-term Gold strength
💡 Still below major resistance , so reversal not yet confirmed
🧭 Possible Scenarios:
✅ Continued bounce → Gold may outperform for a while
❌ Rejection from channel top → NIFTY likely resumes dominance
⏳ Neutral for now → Watch for breakout or rejection from top of the falling channel
🏁 Macro Takeaway:
The GOLD/NIFTY ratio sits at a critical long-term zone .
A breakout could mark a major rotation from equities to Gold, while rejection keeps the equity uptrend intact .
Smart investors can use this ratio to balance equity vs. Gold exposure over long cycles. ⚖️
#GoldVsEquity | #NiftyVsGold | #AssetAllocation | #InvestSmart | #Nifty50 | #GoldInvestment | #TechnicalAnalysis | #MarketTrends | #WealthBuilding | #LongTermInvesting
XAUUSD Gold_Elliot Wave Analysis I'm anticipating a decline in XAUUSD after a minor retracement. A strict stop-loss should be placed at the swing high, as I expect a five-wave downward move.
Please conduct your own analysis before taking any trade.

PCR Trading StrategiesWhy Traders Use Options
Options are used for several strategic purposes:
Hedging: Protecting existing positions from price fluctuations.
Speculation: Earning profits from expected price movements with limited capital.
Income Generation: Selling options to collect premiums regularly.
Leverage: Controlling large positions with smaller amounts of money.

Gold Rebounds as CPI Cools and USD WeakensMarket Overview:
Gold has regained bullish traction after the latest US CPI report showed softer inflation data, leading to a weaker USD and renewed buying across metals.
CPI figures came in below market expectations (Core CPI 0.2% vs 0.3%, CPI m/m 0.3% vs 0.4%, CPI y/y 3.0% vs 3.1%), signalling lower inflation pressure and reinforcing bets that the Fed will stay dovish heading into November.
As a result, gold bounced strongly from the 4,050–4,058 support zone, reclaiming key structure levels and stabilising above 4,100 USD/oz.
Market sentiment remains risk-sensitive, but the short-term tone favours further upside correction, as long as gold holds above the trendline and liquidity support zones highlighted on the chart.
Technical Outlook (H2):
The market structure suggests gold has completed its correction phase and is attempting to form a new bullish leg.
Price action shows a clean rejection at the 4,050 liquidity base, and the next immediate objectives are the 4,211 neckline and 4,260–4,342 supply zones.
Key Technical Levels:
Support / Buy Zone: 4,058 – 4,002
Liquidity Sweep Zone: 3,930 – 3,940
Resistance / Neckline: 4,211
Sell Zone Reaction Fibo: 4,260 – 4,342
Trading Plan – MMFLOW View
🔹 BUY Zone #1 (Continuation Play)
Entry: 4,058 – 4,050
Stop Loss: 4,035
Take Profit: 4,155 → 4,211 → 4,260
🔹 BUY Zone #2 (Liquidity Sweep Scenario)
Entry: 4,002 – 3,930
Stop Loss: 3,915
Take Profit: 4,058 → 4,155 → 4,211
Ideal setup if price retests liquidity before CPI-induced recovery continues.
🔹 SELL Zone(Reaction Trade)
Entry: 4,260 – 4,342
Stop Loss: 4,355
Take Profit: 4,211 → 4,100 → 4,058
Weekly Bias & Summary:
With CPI cooling and the USD losing momentum, gold’s structure points to a recovery phase, possibly extending into Wave III of the medium-term cycle.
However, the 4,211 neckline remains the key pivot — a breakout above this zone could trigger momentum extension toward 4,260–4,340, while a rejection may result in another range-bound pullback.
🟡 MMFLOW Bias: Bullish while above 4,050 — dips remain opportunities to buy.
Macro tone favours risk-on rotation, supporting gold’s upside into next week.
📊 Do you think gold will break 4,211 for the next bullish leg, or is another correction incoming before the real move?
👉 Follow MMFLOW TRADING for daily institutional updates and Smart Money Flow structure.

XAUUSD/GOLD WEEKLY OVERVIEW PROJECTION 25.10.25“XAUUSD/GOLD WEEKLY OVERVIEW 25.10.25”:
🟡 Pair: XAUUSD (Gold vs USD)
📅 Timeframe: Weekly
📊 Chart Type: Price action with liquidity zone and retest entry plan
📌 Key Levels:
Resistance / Upper Target Zone: ~4,360 – 4,400
Entry Zone / Supply-Demand Range: ~4,057 – 4,145
Support / Lower Target Zone: ~3,868
🧭 Market Structure Analysis:
The price is currently consolidating inside a mid-range zone (4,057–4,145) after a strong previous down move.
Liquidity zones are marked both above and below, suggesting potential breakout and retest setups.
The market is showing accumulation or indecision before a big move.
🛒 Buy Scenario (Bullish Plan):
Price may retest the lower boundary of the entry zone (~4,057–4,145).
If a bullish retest/confirmation candle forms → Long Entry.
Target: ~4,360 area (major resistance).
Stop-loss likely placed slightly below 4,057.
🟢 This aligns with a potential reversal or continuation of higher timeframe bullish structure.
🐻 Sell Scenario (Bearish Plan):
Price may break below the entry zone, retest it from the bottom, and reject.
If a bearish retest/confirmation candle forms → Short Entry.
Target: ~3,868 support level.
Stop-loss likely placed slightly above 4,145.
🔴 This aligns with a continuation of the recent bearish momentum.
⚠️ Additional Notes:
Watch for fake breakouts near the entry zone.
Weekly candles can give strong direction but might take 1–2 weeks to fully play out.
High impact news related to gold or USD can accelerate the move.
✅ Summary Plan:
Buy entry: After bullish retest of 4,057–4,145 → TP 4,360
Sell entry: After bearish retest of 4,057–4,145 → TP 3,868
SL: Just outside the opposite edge of the entry zone.

Super Cycle OutlookIntroduction
The concept of a super cycle in economic and financial markets refers to an extended period, typically spanning decades, during which asset prices or commodity prices trend upward significantly, driven by fundamental structural shifts rather than short-term market fluctuations. Unlike typical market cycles, which may last 3–10 years, super cycles are driven by structural factors such as demographic shifts, technological revolutions, urbanization, industrialization, or major policy reforms. Understanding the super cycle outlook is crucial for investors, policymakers, and corporates as it can profoundly influence investment strategies, resource allocation, and global economic policy.
The super cycle outlook extends across multiple asset classes, including equities, commodities, bonds, real estate, and digital assets. Historically, commodities like oil, metals, and agricultural products have been primary indicators of super cycles. However, in recent years, financial markets, global supply chains, and geopolitical dynamics have increasingly influenced super cycle trends.
Historical Context of Super Cycles
Historically, the global economy has experienced multiple super cycles, each shaped by unique structural shifts:
Post-World War II Industrialization (1945–1970s)
After World War II, the world economy entered a super cycle driven by industrial expansion, reconstruction, and mass urbanization. Countries like the United States, Germany, and Japan experienced rapid economic growth. Commodities such as steel, copper, and oil saw strong demand due to infrastructure building, leading to a prolonged period of rising prices.
Globalization and Emerging Markets Boom (1980s–2000s)
The late 20th century witnessed globalization, liberalization of trade, and the rise of emerging markets, particularly China and India. This period marked a super cycle in industrial commodities as China’s rapid urbanization and manufacturing expansion drove demand for iron ore, copper, and crude oil. Financial markets also experienced sustained growth due to increased capital flows and technological advancements.
The Digital Era and Resource Efficiency (2000s–2020s)
The early 21st century introduced a super cycle centered around technology, energy transition, and environmental sustainability. While traditional commodities experienced volatility, digital infrastructure, rare earth metals, lithium, and energy-efficient technologies gained prominence. This super cycle is unique because it combines technological innovation with sustainability-driven investment trends.
Key Drivers of Current and Future Super Cycles
Several interlinked drivers are shaping the present super cycle outlook:
1. Demographic Shifts
Population growth and urbanization are fundamental long-term drivers of economic super cycles. Emerging markets, particularly in Asia and Africa, are experiencing rapid population growth and urban migration. Urbanization fuels demand for housing, energy, transportation, and infrastructure, which in turn drives commodity consumption and industrial production.
2. Technological Innovation
Technology plays a dual role in shaping super cycles:
Productivity Growth: Innovations in AI, robotics, and automation enhance productivity, reduce costs, and increase global competitiveness.
New Asset Classes: Advancements in renewable energy, electric vehicles, and battery storage create demand for specific commodities like lithium, cobalt, and copper, driving a technological commodities super cycle.
3. Energy Transition and Sustainability
The global shift toward green energy is a defining feature of the current super cycle. Countries and corporations are investing heavily in renewable energy, hydrogen, electric vehicles, and carbon-neutral technologies. This energy transition is expected to sustain demand for green infrastructure materials and energy commodities, creating a long-term upward trend in their prices.
4. Global Monetary and Fiscal Policies
Low-interest-rate environments and expansive fiscal policies in major economies have injected significant liquidity into financial markets. This monetary backdrop can extend asset price super cycles, as investors search for yield in equities, commodities, and alternative assets.
5. Geopolitical Dynamics
Geopolitical events, trade wars, sanctions, and supply chain disruptions are increasingly influencing super cycles. For instance, geopolitical tensions can create supply shortages in critical commodities, driving prices higher for prolonged periods. The Russia-Ukraine conflict highlighted how energy and food commodities can be dramatically affected by geopolitical shocks.
Super Cycle Outlook in Key Asset Classes
1. Equities
Equity markets are influenced by corporate earnings growth, technological innovation, and demographic shifts. Emerging markets equities, particularly in Asia, are poised for long-term growth due to rising middle-class consumption and urbanization. Sectors such as renewable energy, electric vehicles, AI, and healthcare are expected to outperform traditional sectors in this super cycle.
2. Commodities
Commodities remain the most visible markers of super cycles. The current outlook highlights:
Metals: Copper, nickel, lithium, and cobalt demand is projected to surge due to renewable energy infrastructure and electric vehicles.
Energy: Renewable energy transition is altering fossil fuel consumption patterns, but oil and gas may experience periodic spikes due to geopolitical tensions.
Agriculture: Rising population and urbanization will sustain demand for food and water resources, potentially driving agricultural commodity prices upward.
3. Bonds and Interest Rates
In traditional super cycles, bonds often serve as a counterbalance to equities and commodities. The current outlook, however, suggests a complex environment where rising inflation expectations may keep yields volatile. Central banks may adopt a mix of tightening and stimulus measures to balance growth and inflation, influencing bond market super cycles.
4. Digital Assets and Cryptocurrencies
Digital assets are increasingly being viewed as a component of modern super cycles. Cryptocurrencies, blockchain-based assets, and tokenized commodities represent a new class of assets influenced by technological adoption and regulatory evolution.
Implications for Investors and Policymakers
1. Portfolio Diversification
Super cycles emphasize the importance of long-term diversification. Investors should allocate across sectors and asset classes aligned with structural growth drivers such as urbanization, technology adoption, and energy transition. Commodities and emerging market equities may form core components of such a strategy.
2. Risk Management
Super cycles are long-term trends but not immune to corrections. Investors must manage risks arising from geopolitical tensions, inflationary pressures, and supply chain disruptions. Hedging strategies using options, futures, and commodities can help mitigate potential drawdowns.
3. Policy Formulation
Policymakers can leverage super cycles to drive sustainable growth. For instance, infrastructure investment, renewable energy promotion, and technological innovation policies can amplify structural growth, ensuring that economies benefit from long-term demand trends rather than being exposed to short-term volatility.
Current Super Cycle Outlook: 2025–2040
Global Economy
The global economy is likely entering a new super cycle driven by energy transition, technology, and demographic changes. Emerging markets, particularly in Asia and Africa, will be the key growth engines due to rising consumption and industrialization. Developed markets are expected to grow more moderately but will lead in technological innovation and green infrastructure development.
Commodities
Metals: Base metals, particularly copper, nickel, and lithium, will see long-term demand growth. Rare earth elements critical for high-tech applications will experience upward price pressure.
Energy: Renewable energy sources will dominate investments, while oil and gas will remain cyclical with periodic supply shocks.
Agriculture: Urbanization and climate change will drive increased agricultural commodity prices, with potential volatility from extreme weather events.
Equities and Financial Assets
Equities linked to technology, healthcare, and energy transition are expected to outperform traditional sectors. Emerging market equities may outperform developed market equities due to higher growth potential. Bonds and fixed income assets may face pressure from inflation and interest rate volatility, but safe-haven instruments will retain relevance during crises.
Geopolitical Considerations
Super cycles are not immune to geopolitical shocks. Trade realignments, regional conflicts, and global supply chain disruptions will remain critical factors influencing the trajectory of commodities and financial markets.
Potential Challenges to the Super Cycle
Despite positive structural drivers, several challenges could temper the super cycle’s momentum:
Inflationary Pressures
Prolonged inflation could prompt aggressive central bank policies, affecting liquidity-driven asset price growth.
Technological Disruptions
Rapid technological advancements may render existing infrastructure and industries obsolete, creating uneven benefits across sectors.
Climate and Environmental Risks
Climate change may disrupt commodity supply chains, agricultural production, and energy infrastructure, introducing volatility into otherwise steady super cycle trends.
Geopolitical Uncertainty
Prolonged conflicts or trade wars could disrupt supply chains and investment flows, impacting super cycle stability.
Conclusion
The super cycle outlook for the next two decades points to a period of transformative growth, driven by emerging market consumption, technological innovation, and the global energy transition. While traditional commodities will continue to experience cyclical demand, new-age materials, renewable energy assets, and digital technologies are set to define the contours of this super cycle.
Investors and policymakers must align strategies with structural shifts rather than short-term market fluctuations. Diversification, risk management, and forward-looking policy interventions are crucial for capitalizing on opportunities while mitigating potential challenges.
Ultimately, understanding super cycles is not just about predicting prices but about recognizing long-term structural changes that reshape economies, industries, and societies. Those who anticipate these shifts, adapt their strategies, and embrace innovation will be best positioned to thrive in the next super cycle.
XAUUSD LongFriday ending session setting the Directional bias for next week. Monday it can start with retracement to the demand zone and then continue to push up to target the external liquidity, which is Daily high or prevision trading day as well as day before that. Since both previous day made Equal high.
1. Daily closing with Big price rejection.
2. We have change of character in 1min, Leaving behind imbalance as well as Equal low.
