PCR Trading StrategiesWhy Traders Use Options
Options are used for several strategic purposes:
Hedging: Protecting existing positions from price fluctuations.
Speculation: Earning profits from expected price movements with limited capital.
Income Generation: Selling options to collect premiums regularly.
Leverage: Controlling large positions with smaller amounts of money.
Trade ideas

Gold Rebounds as CPI Cools and USD WeakensMarket Overview:
Gold has regained bullish traction after the latest US CPI report showed softer inflation data, leading to a weaker USD and renewed buying across metals.
CPI figures came in below market expectations (Core CPI 0.2% vs 0.3%, CPI m/m 0.3% vs 0.4%, CPI y/y 3.0% vs 3.1%), signalling lower inflation pressure and reinforcing bets that the Fed will stay dovish heading into November.
As a result, gold bounced strongly from the 4,050–4,058 support zone, reclaiming key structure levels and stabilising above 4,100 USD/oz.
Market sentiment remains risk-sensitive, but the short-term tone favours further upside correction, as long as gold holds above the trendline and liquidity support zones highlighted on the chart.
Technical Outlook (H2):
The market structure suggests gold has completed its correction phase and is attempting to form a new bullish leg.
Price action shows a clean rejection at the 4,050 liquidity base, and the next immediate objectives are the 4,211 neckline and 4,260–4,342 supply zones.
Key Technical Levels:
Support / Buy Zone: 4,058 – 4,002
Liquidity Sweep Zone: 3,930 – 3,940
Resistance / Neckline: 4,211
Sell Zone Reaction Fibo: 4,260 – 4,342
Trading Plan – MMFLOW View
🔹 BUY Zone #1 (Continuation Play)
Entry: 4,058 – 4,050
Stop Loss: 4,035
Take Profit: 4,155 → 4,211 → 4,260
🔹 BUY Zone #2 (Liquidity Sweep Scenario)
Entry: 4,002 – 3,930
Stop Loss: 3,915
Take Profit: 4,058 → 4,155 → 4,211
Ideal setup if price retests liquidity before CPI-induced recovery continues.
🔹 SELL Zone(Reaction Trade)
Entry: 4,260 – 4,342
Stop Loss: 4,355
Take Profit: 4,211 → 4,100 → 4,058
Weekly Bias & Summary:
With CPI cooling and the USD losing momentum, gold’s structure points to a recovery phase, possibly extending into Wave III of the medium-term cycle.
However, the 4,211 neckline remains the key pivot — a breakout above this zone could trigger momentum extension toward 4,260–4,340, while a rejection may result in another range-bound pullback.
🟡 MMFLOW Bias: Bullish while above 4,050 — dips remain opportunities to buy.
Macro tone favours risk-on rotation, supporting gold’s upside into next week.
📊 Do you think gold will break 4,211 for the next bullish leg, or is another correction incoming before the real move?
👉 Follow MMFLOW TRADING for daily institutional updates and Smart Money Flow structure.

XAUUSD/GOLD WEEKLY OVERVIEW PROJECTION 25.10.25“XAUUSD/GOLD WEEKLY OVERVIEW 25.10.25”:
🟡 Pair: XAUUSD (Gold vs USD)
📅 Timeframe: Weekly
📊 Chart Type: Price action with liquidity zone and retest entry plan
📌 Key Levels:
Resistance / Upper Target Zone: ~4,360 – 4,400
Entry Zone / Supply-Demand Range: ~4,057 – 4,145
Support / Lower Target Zone: ~3,868
🧭 Market Structure Analysis:
The price is currently consolidating inside a mid-range zone (4,057–4,145) after a strong previous down move.
Liquidity zones are marked both above and below, suggesting potential breakout and retest setups.
The market is showing accumulation or indecision before a big move.
🛒 Buy Scenario (Bullish Plan):
Price may retest the lower boundary of the entry zone (~4,057–4,145).
If a bullish retest/confirmation candle forms → Long Entry.
Target: ~4,360 area (major resistance).
Stop-loss likely placed slightly below 4,057.
🟢 This aligns with a potential reversal or continuation of higher timeframe bullish structure.
🐻 Sell Scenario (Bearish Plan):
Price may break below the entry zone, retest it from the bottom, and reject.
If a bearish retest/confirmation candle forms → Short Entry.
Target: ~3,868 support level.
Stop-loss likely placed slightly above 4,145.
🔴 This aligns with a continuation of the recent bearish momentum.
⚠️ Additional Notes:
Watch for fake breakouts near the entry zone.
Weekly candles can give strong direction but might take 1–2 weeks to fully play out.
High impact news related to gold or USD can accelerate the move.
✅ Summary Plan:
Buy entry: After bullish retest of 4,057–4,145 → TP 4,360
Sell entry: After bearish retest of 4,057–4,145 → TP 3,868
SL: Just outside the opposite edge of the entry zone.

Super Cycle OutlookIntroduction
The concept of a super cycle in economic and financial markets refers to an extended period, typically spanning decades, during which asset prices or commodity prices trend upward significantly, driven by fundamental structural shifts rather than short-term market fluctuations. Unlike typical market cycles, which may last 3–10 years, super cycles are driven by structural factors such as demographic shifts, technological revolutions, urbanization, industrialization, or major policy reforms. Understanding the super cycle outlook is crucial for investors, policymakers, and corporates as it can profoundly influence investment strategies, resource allocation, and global economic policy.
The super cycle outlook extends across multiple asset classes, including equities, commodities, bonds, real estate, and digital assets. Historically, commodities like oil, metals, and agricultural products have been primary indicators of super cycles. However, in recent years, financial markets, global supply chains, and geopolitical dynamics have increasingly influenced super cycle trends.
Historical Context of Super Cycles
Historically, the global economy has experienced multiple super cycles, each shaped by unique structural shifts:
Post-World War II Industrialization (1945–1970s)
After World War II, the world economy entered a super cycle driven by industrial expansion, reconstruction, and mass urbanization. Countries like the United States, Germany, and Japan experienced rapid economic growth. Commodities such as steel, copper, and oil saw strong demand due to infrastructure building, leading to a prolonged period of rising prices.
Globalization and Emerging Markets Boom (1980s–2000s)
The late 20th century witnessed globalization, liberalization of trade, and the rise of emerging markets, particularly China and India. This period marked a super cycle in industrial commodities as China’s rapid urbanization and manufacturing expansion drove demand for iron ore, copper, and crude oil. Financial markets also experienced sustained growth due to increased capital flows and technological advancements.
The Digital Era and Resource Efficiency (2000s–2020s)
The early 21st century introduced a super cycle centered around technology, energy transition, and environmental sustainability. While traditional commodities experienced volatility, digital infrastructure, rare earth metals, lithium, and energy-efficient technologies gained prominence. This super cycle is unique because it combines technological innovation with sustainability-driven investment trends.
Key Drivers of Current and Future Super Cycles
Several interlinked drivers are shaping the present super cycle outlook:
1. Demographic Shifts
Population growth and urbanization are fundamental long-term drivers of economic super cycles. Emerging markets, particularly in Asia and Africa, are experiencing rapid population growth and urban migration. Urbanization fuels demand for housing, energy, transportation, and infrastructure, which in turn drives commodity consumption and industrial production.
2. Technological Innovation
Technology plays a dual role in shaping super cycles:
Productivity Growth: Innovations in AI, robotics, and automation enhance productivity, reduce costs, and increase global competitiveness.
New Asset Classes: Advancements in renewable energy, electric vehicles, and battery storage create demand for specific commodities like lithium, cobalt, and copper, driving a technological commodities super cycle.
3. Energy Transition and Sustainability
The global shift toward green energy is a defining feature of the current super cycle. Countries and corporations are investing heavily in renewable energy, hydrogen, electric vehicles, and carbon-neutral technologies. This energy transition is expected to sustain demand for green infrastructure materials and energy commodities, creating a long-term upward trend in their prices.
4. Global Monetary and Fiscal Policies
Low-interest-rate environments and expansive fiscal policies in major economies have injected significant liquidity into financial markets. This monetary backdrop can extend asset price super cycles, as investors search for yield in equities, commodities, and alternative assets.
5. Geopolitical Dynamics
Geopolitical events, trade wars, sanctions, and supply chain disruptions are increasingly influencing super cycles. For instance, geopolitical tensions can create supply shortages in critical commodities, driving prices higher for prolonged periods. The Russia-Ukraine conflict highlighted how energy and food commodities can be dramatically affected by geopolitical shocks.
Super Cycle Outlook in Key Asset Classes
1. Equities
Equity markets are influenced by corporate earnings growth, technological innovation, and demographic shifts. Emerging markets equities, particularly in Asia, are poised for long-term growth due to rising middle-class consumption and urbanization. Sectors such as renewable energy, electric vehicles, AI, and healthcare are expected to outperform traditional sectors in this super cycle.
2. Commodities
Commodities remain the most visible markers of super cycles. The current outlook highlights:
Metals: Copper, nickel, lithium, and cobalt demand is projected to surge due to renewable energy infrastructure and electric vehicles.
Energy: Renewable energy transition is altering fossil fuel consumption patterns, but oil and gas may experience periodic spikes due to geopolitical tensions.
Agriculture: Rising population and urbanization will sustain demand for food and water resources, potentially driving agricultural commodity prices upward.
3. Bonds and Interest Rates
In traditional super cycles, bonds often serve as a counterbalance to equities and commodities. The current outlook, however, suggests a complex environment where rising inflation expectations may keep yields volatile. Central banks may adopt a mix of tightening and stimulus measures to balance growth and inflation, influencing bond market super cycles.
4. Digital Assets and Cryptocurrencies
Digital assets are increasingly being viewed as a component of modern super cycles. Cryptocurrencies, blockchain-based assets, and tokenized commodities represent a new class of assets influenced by technological adoption and regulatory evolution.
Implications for Investors and Policymakers
1. Portfolio Diversification
Super cycles emphasize the importance of long-term diversification. Investors should allocate across sectors and asset classes aligned with structural growth drivers such as urbanization, technology adoption, and energy transition. Commodities and emerging market equities may form core components of such a strategy.
2. Risk Management
Super cycles are long-term trends but not immune to corrections. Investors must manage risks arising from geopolitical tensions, inflationary pressures, and supply chain disruptions. Hedging strategies using options, futures, and commodities can help mitigate potential drawdowns.
3. Policy Formulation
Policymakers can leverage super cycles to drive sustainable growth. For instance, infrastructure investment, renewable energy promotion, and technological innovation policies can amplify structural growth, ensuring that economies benefit from long-term demand trends rather than being exposed to short-term volatility.
Current Super Cycle Outlook: 2025–2040
Global Economy
The global economy is likely entering a new super cycle driven by energy transition, technology, and demographic changes. Emerging markets, particularly in Asia and Africa, will be the key growth engines due to rising consumption and industrialization. Developed markets are expected to grow more moderately but will lead in technological innovation and green infrastructure development.
Commodities
Metals: Base metals, particularly copper, nickel, and lithium, will see long-term demand growth. Rare earth elements critical for high-tech applications will experience upward price pressure.
Energy: Renewable energy sources will dominate investments, while oil and gas will remain cyclical with periodic supply shocks.
Agriculture: Urbanization and climate change will drive increased agricultural commodity prices, with potential volatility from extreme weather events.
Equities and Financial Assets
Equities linked to technology, healthcare, and energy transition are expected to outperform traditional sectors. Emerging market equities may outperform developed market equities due to higher growth potential. Bonds and fixed income assets may face pressure from inflation and interest rate volatility, but safe-haven instruments will retain relevance during crises.
Geopolitical Considerations
Super cycles are not immune to geopolitical shocks. Trade realignments, regional conflicts, and global supply chain disruptions will remain critical factors influencing the trajectory of commodities and financial markets.
Potential Challenges to the Super Cycle
Despite positive structural drivers, several challenges could temper the super cycle’s momentum:
Inflationary Pressures
Prolonged inflation could prompt aggressive central bank policies, affecting liquidity-driven asset price growth.
Technological Disruptions
Rapid technological advancements may render existing infrastructure and industries obsolete, creating uneven benefits across sectors.
Climate and Environmental Risks
Climate change may disrupt commodity supply chains, agricultural production, and energy infrastructure, introducing volatility into otherwise steady super cycle trends.
Geopolitical Uncertainty
Prolonged conflicts or trade wars could disrupt supply chains and investment flows, impacting super cycle stability.
Conclusion
The super cycle outlook for the next two decades points to a period of transformative growth, driven by emerging market consumption, technological innovation, and the global energy transition. While traditional commodities will continue to experience cyclical demand, new-age materials, renewable energy assets, and digital technologies are set to define the contours of this super cycle.
Investors and policymakers must align strategies with structural shifts rather than short-term market fluctuations. Diversification, risk management, and forward-looking policy interventions are crucial for capitalizing on opportunities while mitigating potential challenges.
Ultimately, understanding super cycles is not just about predicting prices but about recognizing long-term structural changes that reshape economies, industries, and societies. Those who anticipate these shifts, adapt their strategies, and embrace innovation will be best positioned to thrive in the next super cycle.
XAUUSD LongFriday ending session setting the Directional bias for next week. Monday it can start with retracement to the demand zone and then continue to push up to target the external liquidity, which is Daily high or prevision trading day as well as day before that. Since both previous day made Equal high.
1. Daily closing with Big price rejection.
2. We have change of character in 1min, Leaving behind imbalance as well as Equal low.

XAUUSD, Whats the Trend? If Pattern Breaks out?#Gold (#XAU/USD) Technical Analysis - October 24, 2025
Current Market Bias: **BEARISH**
Gold is currently trading at 4,109.12, positioned within a critical decision zone. The price action shows a developing #Descendingtriangle pattern with a clear resistance trendline connecting the recent highs around 4,150-4,200.
Key Observations:
The market has failed to break above the dynamic resistance multiple times, indicating weakening bullish momentum. Price is currently hovering near the 0.618 Fibonacci retracement level (4,153.81) but struggling to maintain above it. The horizontal support around 4,015 has been tested multiple times, forming the base of this triangle pattern.
#Breakout Scenarios:
📉 Bearish Breakdown (Higher Probability)
If the horizontal support at 4,015 breaks decisively:
- First Target: 3,918 (1.272 Fibonacci extension)
- Second Target: 3,865 (1.414 Fibonacci extension)
- Extended Target: 3,791 (1.618 Fibonacci extension)
- Major Support: 3,652 (2.0 Fibonacci extension)
This breakdown would represent a continuation of the corrective move from the all-time highs, potentially triggering significant selling pressure as stop-losses are triggered below 4,000.
📈 #Bullish Breakout (Alternative Scenario)
If price breaks above the descending resistance trendline AND reclaims 4,150-4,200:
- First Target: 4,250
- Extended Target: 4,300 (previous highs)
This would invalidate the bearish triangle pattern and could trigger a rally back toward recent highs.
#Risk Management
The pattern suggests a #risk-reward favoring short positions on breakdown confirmation. Traders should wait for a decisive close below 4,015 with increased volume before entering bearish positions. Stop-loss above 4,150 would be prudent for short positions.
Current stance: Monitor the 4,015 support closely - a break here opens the door to significant downside.

XAUUSDFunny I was just checking in gold saw a good short opportunity best part smashed the TP very fast please have a look at below idea

XAUUSDContinues to push up. Next retracement could be M15 Demand zone. Then push up. We have equal low above demand zone. Eq Low is strong liquidity pool.

Gold comex sell on rise until 4150 not break if break then 4350 Gold comex sell on rise until 4150 not break
How My Harmonic pattern projection Indicator work is explained below :
Recent High or Low :
D-0% is our recent low or high
Profit booking zone ( Early / Risky entry) : D 13.2% -D 16.1 % is
range if break them profit booking start on uptrend or downtrend but only profit booking, trend not changed
SL reversal zone (Safe entry ) : SL 23.1% and SL 25.5% is reversal zone if break then trend reverse and we can take reverse trade
Target : T1, T2, T3, T4 and .
Are our Target zone
Any Upside or downside level will activate only if break 1st level then 2nd will be active if break 2nd then 3rd will be active.
Total we have 7 important level which are support and resistance area
Until , 16% not break uptrend will continue if break then profit booking will start.
If break 25% then fresh downtrend will start then T1, T2,T3 will activate
1,3,5,10,15,20 minutes are short term levels.
30 minutes 60 minutes , 2 hours,3 hours, ... 1 day and 1 week chart positional and long term levels

Elliott Wave Analysis – XAUUSD (October 24, 2025)
1️⃣ Momentum
D1 Timeframe:
• D1 momentum is closing within the oversold zone → bearish strength has clearly weakened.
• The probability of a bullish reversal is now very high.
• A strong bullish D1 candle close is needed to confirm the reversal.
• Once confirmed, price may enter a 5-day bullish rally.
H4 Timeframe:
• H4 momentum is still declining.
• If the current H4 candle closes as it is now, we may see a main bearish move today (around 5 H4 candles).
• Since today is Friday, a deeper decline remains possible.
→ Therefore, careful observation and analysis are required before entering any trades.
H1 Timeframe:
• H1 momentum continues to decline.
• Price may drop toward the 4098 liquidity zone.
• If this level breaks, the next potential target is 4050.
________________________________________
2️⃣ Wave Structure
D1 Structure:
• Price has been moving sideways for several days.
• In Elliott Wave theory, when price reaches its target, it often needs time symmetry before the wave completes.
• Therefore, this prolonged sideways phase helps maintain time balance.
• It’s still too early to confirm whether this is yellow Wave 4 or just Wave 4 within yellow Wave 3.
H4 Structure:
• There are two possible scenarios:
1. The blue Y wave is still unfolding.
2. The purple Wave 5 has already started forming.
• To determine which scenario is valid, we monitor the current
H4 bearish phase:
o If price does not break the previous low, and H4 momentum enters the oversold zone, it likely indicates purple Wave 5 has begun, with an upside target near 4476.
o If price breaks the previous low, the blue Y corrective wave is still in progress, or a larger corrective structure is unfolding.
o In that case, we’ll watch the lower liquidity zones, with the ideal completion target for Wave Y around 3927.
H1 Structure:
• On the H1 chart, Wave C appears to have completed in the form of an Ending Triangle.
• According to Elliott theory, after an ending triangle, price should drop sharply and quickly.
• However, such a strong drop hasn’t appeared yet, so we continue to observe the price action carefully.
There are two main scenarios to consider:
1. If price declines slowly toward the 4050 liquidity zone, showing overlapping waves while H4 momentum moves into the oversold region, it’s likely that Wave 5 has already started.
→ In this case, we’ll look for buying opportunities.
2. If price falls rapidly and steeply, it suggests that the blue Y wave is still unfolding, or that the market is inside a larger corrective phase.
→ In this case, price may break below 4004, and we will patiently wait for buy setups around 3953 or 3927.
________________________________________
3️⃣ Trading Plan
• Sell Setup:
o Yesterday’s sell zone at 4149 has already reached about +400 pips.
o No new ideal sell zone for now → wait for liquidity breaks to look for the next sell setup.
• Buy Setup:
o Monitor potential buy reactions at:
4050
3953
3927
⚠️ Note:
Price is currently at a sensitive zone, with each candle showing a range over 200 pips.
→ Therefore, limit orders are highly risky at the moment and could easily get stopped out.

Good buying zone for gold (15min)Gold is taking a support from 1hr trendline and made a demand zone.
Adding the confluence of fib golden zone level we could make a long order from the 0.618 level after sweep of recent low in lower time frame.

gold swing new ideabuy and sell setups on gold
sell conditions valid on if 45 min candle closed below prev week low. buy condition possible above the inverse head and shoulder neck line. either one of it activated means opposite other criteria get automatically invalidated. if the market condition is stable this can give profit. if not at the very worst choppy and volatile both side stops can get be triggerd..
my opinion hold till target to get the max benefit of the trade.

Gold Analysis and Trading Strategy | October 24✅ From the 4-hour structure:
Gold has formed a continuous downtrend after a period of high-level consolidation, showing a clear bearish pattern. The price is currently moving near the lower Bollinger Band, around the 4050–4060 zone.
The moving averages (MA5 < MA10 < MA20) are arranged in a bearish formation, with MA10 and MA20 sloping downward, indicating that the medium- to short-term trend remains in a decline phase. The current candles are trading below all major MAs, suggesting that upward rebounds will face heavy resistance. If gold breaks below 4026, it could open further downside potential toward 3980 support.
✅ From the 1-hour chart:
Gold has fallen continuously after facing resistance at 4154.69, breaking below the 4115 support level. The price is now consolidating around 4050, with bearish pressure still dominating.
Currently, the candles are near the lower Bollinger Band, so a short-term technical rebound is possible; however, since the lower band continues to expand downward, the rebound is likely to be limited.
🔴 Resistance Levels: 4075 / 4115 / 4155
🟢 Support Levels: 4050 / 4025 / 3985
✅ Trading Strategy Reference:
🔰 If gold rebounds to the 4070–4080 zone but fails to break above, consider light short positions, with a stop loss above 4090 and targets at 4045–4025.
🔰 If the price pulls back to the 4025–4030 area and stabilizes, consider short-term long positions targeting 4050–4060.
✅ The medium-term trend remains bearish. Unless the price firmly holds above 4115–4120, the overall strategy should still focus on selling the rallies.

XAUUSD BUY TRADE PLAN🔱 VALHALLA CORE — XAUUSD (1H) TRADE PLAN
Date: 24 Oct 2025
🧭 Market Outlook:
Gold dropped hard from the 4,150 area after rejecting the Golden Zone (50–61.8% retracement).
Now heading toward our main BUYING ZONE at 4,012–4,004 where we’ll look for a bullish setup.
📉 If Price Pulls Back Up:
Sell zone: 4,092–4,150 (Golden Area / Supply zone)
SL: Above 4,165
TP1: 4,035
TP2: 4,010 (Buying Zone)
📈 If Price Drops to Buying Zone:
Buy zone: 4,012–4,004
SL: Below 3,995
TP1: 4,092
TP2: 4,120–4,150
💡 Plan Summary:
Short from the Golden Area = continuation trade.
Buy from the Buying Zone = reversal setup.
Wait for 1H confirmation before entry (strong candle or rejection wick).
Always move SL to BE after TP1 hits.

Trade Bullish Quantity smallFor every fall a rise is required. Just see a 30min parallel channel broken. SL is 4148.76, tp1 is 4088, tp2 4117. Time 200-300min.

XAUUSDLast day was consolidating and has generated sell side liquidity. There could be possibility the price sweeps that liquidity and then reverse from the Marked Demand zone.
We have Imbalace left in 15M
We have Equal lows. Srong liquidity pool.
Below Eq low we have Demand zone.

Buy in GoldBuy Gold now as it has rejected sellers at the previous low. Now clear uptrend for remainder of the day.

Gold Stuck Near ₹4,100 Ahead of CPIMarket Pulse:
Gold is holding steady around ₹4,100, caught between uncertainty and opportunity as traders brace for the US CPI release and new developments in US–China trade talks.
The yellow metal has paused its recovery from ₹4,050 → ₹4,160, while the US Dollar and bond yields edge higher amid renewed geopolitical tension and surging oil prices.
This is the classic “calm before volatility” moment — the market is simply waiting for data to decide the next wave.
If CPI comes in softer or trade talks disappoint, liquidity could flood back into gold, breaking above ₹4,155–₹4,160 and opening the path toward ₹4,215 → ₹4,261.
But a strong CPI surprise could flip sentiment fast — dragging price back into the ₹4,056 and ₹4,018 buy zones, where the next reaction will decide direction.
📊 Technical Outlook (M30)
Price continues to coil within a tight structure between ₹4,100 – ₹4,155, forming a “spring compression” right below trendline resistance.
Market flow suggests accumulation beneath ₹4,100, hinting that liquidity is building before the next expansion.
Key Structure Zones:
Resistance Pivot: ₹4,154 – ₹4,155 → Key breakout level
Breakout Support (CP Zone): ₹4,056 – ₹4,060
Liquidity Buy Zone: ₹4,018 – ₹4,020
Sell Zone (Fibo Reaction): ₹4,215 – ₹4,261
🎯 Trading Plan – MMFLOW Style
🔹 BUY PLAN – Reaccumulation Base
Entry: ₹4,056 – ₹4,060
Stop Loss: ₹4,045
Targets: ₹4,100 → ₹4,140 → ₹4,155
Focus on reaction candles & liquidity grab confirmation.
🔹 BUY PLAN – Liquidity Sweep Setup
Entry: ₹4,018 – ₹4,020
Stop Loss: ₹4,005
Targets: ₹4,056 → ₹4,100 → ₹4,150
If liquidity sweeps this zone clean, watch for a sharp recovery flow.
🧭 Summary – MMFLOW View
Gold is in “decision mode”, waiting for CPI and macro catalysts to trigger the next trend.
The structure stays neutral-bullish as long as price holds above ₹4,056.
A confirmed breakout above ₹4,155 may unlock a fast rally toward ₹4,215–₹4,260, while a break below ₹4,018 could open the door for one more liquidity flush.
⚜️ MMFLOW Bias: No need to predict the move — just follow the flow when liquidity confirms.
📊 Do you expect gold to break higher after CPI, or trap traders before reversing?

$4,005 BROKEN! GOLD READY FOR CPI COLLAPSEFranCi$$_FiboMatrix Emergency Action Plan (H1 Focus)
Welcome Traders! Gold (XAU/USD) has attracted sellers and is now trading below $4,100. With the US CPI release looming, the DOWNSIDE BREAKDOWN is our highest conviction scenario!
1. Market Snapshot
Current State: Gold is consolidating in a Sideway Zone between $4,159 (Resistance) and $4,005 (Critical Support).
Pressure: The recent break below $4,100$ and the recovering USD are key bearish factors.
The Catalyst: US CPI today. A hot inflation print will fuel the USD and shatter the $4,005$ floor.
Dominant Risk: Break below $4,005.438$ confirms the major bearish trend targeting $3,889$.
2. MAIN TRADING PLAN: Breakdown Scenario (SHORT) 💰
We are setting the trap to execute the SELL trade immediately upon the decisive breach of the $4,005$ Support.
Activate SHORT: Breakdown below $4,005.438$. (Wait for H1 close confirmation).
STOP-LOSS (SL): $4,159.686$. Placed safely above the Sideway Resistance.
TAKE-PROFIT 1 (TP1): $3,938.128 (Fibo Target).
TAKE-PROFIT 2 (TP2): $3,889.330 (Ultimate Structural Target).
3. Contingency Scenario (LONG) ⬆️
Activate LONG: Only if Gold decisively breaks $4,159.686$ (Breakout Zone) and targets $4,237.334.
Note: High-risk counter-trend trade, likely requiring a major negative surprise from the CPI report.
Community Interaction 🚀
The CPI is coming! Will the data be hot enough to smash $4,005$? Or is the Sideway Zone here to stay?
Drop your priority scenario NOW! 👇

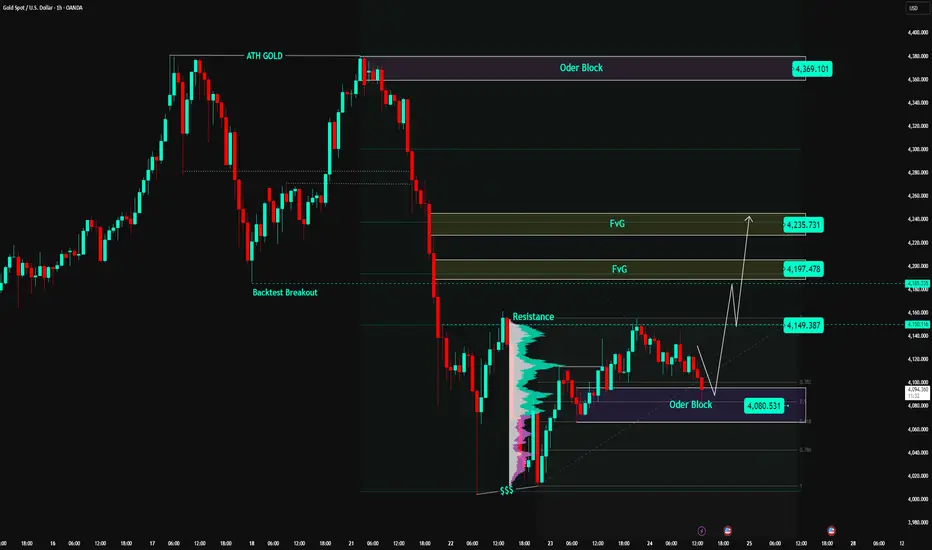
Gold Maintains Re-Accumulation Above OB, Wave Recovery Target🔍 Market Context
After a sharp decline from the ATH GOLD 4,371 USD peak, gold has completed a liquidity sweep around the 4,010 USD bottom and formed a stable accumulation zone above the Order Block 4,080 USD .
The buyers are gradually regaining control as the price holds firm at the OB and shows signs of short-term supply absorption.
The Resistance 4,149 USD zone is currently a temporary barrier; if successfully breached – gold could trigger a recovery wave towards the Fair Value Gap (FVG) zones at 4,197 and 4,235 USD.
The current price structure leans towards a bullish retracement structure – prioritising buy orders when the price reacts from the active demand zone.
💎 Key Technical Structure
Order Block (OB): 4,080 – 4,085 USD → crucial support zone, confluence with Fibo 0.786, serving as an accumulation base.
Resistance (Breakout Level): 4,149 USD → confirmation zone for upward direction, requires decisive breakout.
FVG1: 4,197 – 4,210 USD → first target, short-term supply test zone.
FVG2: 4,225 – 4,235 USD → confluence resistance zone, potential profit-taking for recovery wave.
ATH GOLD: 4,371 USD → long-term resistance, expanded target if the market maintains strong buying flow.
Overall Structure:
→ Short-term: bullish recovery.
→ Medium-term: re-accumulation after a deep correction phase.
📈 Trading Scenarios
1️⃣ BUY Setup #1 – Retest Order Block 4,080 USD
Entry: 4,080 – 4,085
SL: 4,060
TP1: 4,149
TP2: 4,197
TP3: 4,235
✅ Condition:
Wait for the price to retrace to the OB zone and show clear bullish reversal signals (rejection or bullish engulfing).
➡️ This is a classic “Buy the Dip” setup – aligning with the recovery structure, with high probability due to OB + strong Fibonacci confluence.
2️⃣ BUY Setup #2 – Break & Retest zone 4,149 USD
Entry: 4,149 – 4,155
SL: 4,130
TP1: 4,197
TP2: 4,235
✅ Condition:
Price breaks through the 4,149 resistance zone with good volume and lightly retests, without closing candles below 4,130.
➡️ Trend-following setup, aligning with the flow when the market confirms a short-term resistance break.
3️⃣ SELL Scalp – Reaction at FVG 4,235 USD (short-term)
Entry: 4,230 – 4,235
SL: 4,245
TP: 4,197 → 4,150
✅ Condition:
If gold reacts weakly and there is no follow-up buy at the FVG2 zone → a short-term technical sell can be considered on pullback.
➡️ Short-term sell – only execute if there is no confirmation of continued upward movement.
⚠️ Risk Management
Prioritise BUY according to the main structure (retracement bullish).
Do not FOMO buy within the zone (4,110 – 4,130).
If H1 closes candles below 4,060 → invalidates the bullish scenario, wait for structure reconstruction.
Maintain moderate order size when trading around the FVG zone to avoid noise.
💬 Conclusion
Gold is in the process of re-accumulation and preparing for a technical recovery phase.
As long as the price holds the Order Block 4,080 USD zone, the recovery structure remains valid, and the feasible target is 4,197 → 4,235 USD .
If it breaks through 4,235 USD, the market could extend the rally towards the 4,300 – 4,370 USD (ATH GOLD) zone.
👉 Reasonable Strategy:
Buy 4,080 → TP 4,197 / 4,235.
Buy more when 4,149 break confirms upward direction.
Sell short reaction at 4,235 if there is no signal of continued break.
🔥 “Patience at the base — profits come to those who wait for the OB reaction.”
⏰ Timeframe: 1H
📅 Update: 24/10/2025
✍️ Analysis by: Captain Vincent
XAU/USD: GEMING! US-RUSSIA TENSION DI MANA MAU ENTRY?Gold ($4,140/oz) has bounced back nicely after a big drop from the top. This strength is mostly because of the new US sanctions on Russia (more geopolitical heat!) and everyone is waiting for the key US Inflation Data (today, 24/10). Basically, the fundamentals are giving Gold a strong support!
📌 TECHNICALS & THE GAME PLAN (H1)
Crucial Resistance (Level Berat): $4,180 - $4,186
Action: Jual (Sell) if price reaches this level and gets rejected. Beli (Buy) only if it breaks decisively above $4,186 for a big continuation.
The 'Sweet Spot' Support (Area Cuan): $4,085 - $4,091
Action: Bias BUY. This is the 'Buy The Dip' opportunity. Watch for bullish confirmation here—this is a high-value area.
Safety Net (SL Aman): Below $4,057
If this level is lost, watch out! Pressure will mount to push Gold towards $4,000.
💡 VERDICT & STRATEGY
Gold is currently consolidating. With all this strong news backing it up, the best strategy is to look for BUY entries around the established support zone.
Ideal Entry: $4,085 - $4,091
Stop Loss (SL): Below $4,057
Target (TP): Aim for $4,180
Yuk, trading hati-hati! Don't forget to keep an eye on US Inflation later! 🚀
#XAUUSD #Emas #ForexIndonesia #TradingViewID #Geopolitik #AnalisaTeknikal #BuyTheDip #TradingStrategy #SinyalEmas

XAUUSD SHORTAs per Trendline break I was looking to short gold was waiting for right opportunity then I lowered the time frame saw Head and shoulder pattern plus gold was already favouring for short so got this short term trade idea.
Tp around
4085
4075

Gold leaning on $4100 psychological zone, Bulls to break $4150Gold Daily Technical Report
Gold is trading sideways with temporary downward bias affected by price stability below immdiate resistance 4118 while immediate support sits at psychological zone 4100 which appears to be carrying some recovery attempts.
Clear breakout above 4118 will face hurdle at 4123-4128 above which momentum builds up for further extension to 4134-4144-4154 & 4170
Break and stability below 4100 exposes broad support zone 4080 & 4060 which is next potential point of interest for buyers.
