XAU/USD (Gold) chart: Timeframe: 30 minutes...XAU/USD (Gold) chart:
Timeframe: 30 minutes
Price action: Price bounced strongly from an ascending trendline (blue line).
The green zone above represents resistance (previous swing highs).
There’s a red arrow showing an expected upward move to a target point.
🔍 Analysis
Current price: around $4,269
The target point line my marked is near $4,365–$4,375 region.
That corresponds to the previous resistance zone (green box).
🎯 Target summary
Entry zone: around $4,260–$4,270 (near the trendline bounce)
Target: $4,365 – $4,375
Upside potential: roughly +100 to +110 points (~2.5%)
Stop-loss suggestion: below the trendline, around $4,230 (to protect against breakdown)
Trade ideas

GOLD: BUY $4235, TARGET $4450! (FED RATE CUT PLAY📰 MACRO PUSH: Low-Interest Rate Tailwinds
Gold is getting a huge boost from the fundamentals:
Fed Rate Cuts: Market is pricing 99% probability of a Fed rate cut next week. This is spot on for Gold. Low rates = Gold will fly!
Safe-Haven: Political instability (US Govt shutdown extending) and trade tensions are pushing safe-haven demand higher.
Key Data: Watch for the delayed CPI data on October 24th. It will be a major trigger!
Summary: The fundamental conviction for upside is max to max. We are ready for the breakout.
📈 TECHNICAL ANALYSIS: The Perfect LONG Setup!
The chart shows Gold is correcting back to the main Demand Zone—a confluence of the Uptrend Line and a crucial structural low. This zone is our go-to for a perfect entry.
🎯 Detailed Trading Strategy
We are activating a long position as price revisits our key zone:
Position: LONG (BUY) - With full conviction on the primary trend.
BUY ZONE (Entry):
$4,237
$4,235 (The most critical Demand Zone)
SL (Stop Loss):
$4,227 (Must protect this level!)
TP (Take Profit Targets):
TP1: $4,245
TP2: $4,255
TP3: $4,265
TP4: $4,275
Final TP: Open (Expecting a New ATH around $4,450+)
DISCLAIMER: This opportunity at the Demand Zone is strongly backed by the macro picture (Fed & Instability). Please use proper risk management!
#GOLD #XAUUSD #Fed #ATH #TechnicalAnalysis #IntradaySetup

GOLD PULLBACK: $4330 SLIDE! Sniping the Fibo BUY Zone🎯 Macro Summary & Bias: USD Stability Triggers Profit-Taking
Gold is extending its corrective slide from the all-time high zone, hitting around $4,331 - $4,330.
Primary Headwind: The US Dollar (USD) attracted buyers for three consecutive days, causing stability which triggered profit-taking in the overbought Gold market.
Long-Term Support: DXY trades slightly negatively due to the US government shutdown and trade tensions, keeping the long-term bullish outlook intact.
Technical Bias: The market is in a deep correction/profit-taking phase. Our focus is strictly on finding the FIBO BUY REACT ZONES to join the underlying bullish trend. DO NOT CHASE THE SELL MOVE.
📊 In-Depth Technical Analysis (H1): Pinpointing the FIBO Reaction Levels
Based on the current corrective structure and the Fibo/Volume zones defined on image_ddd575.png, we have our strategic levels:
1. Strategic SELL Zones (FIBO SELL REACT ZONES):
These are current resistance areas for short-term rejection or supply zone testing:
REACTION FIBO SELL ZONE 4340 - 4320: Current resistance. Look for a SCALP SELL opportunity if the price rejects this zone.
REACTION SELL ZONE - Big Volume for Sell Side 435x: Major supply/liquidity zone if price attempts a deeper retracement.
2. Strategic BUY Zones (FIBO BUY REACT ZONE):
These are the most critical Fibo support zones for initiating Long entries:
REACTION FIBO BUY ZONE 4270 - 4265: The first crucial Fibo Retracement support.
REACTION BUY ZONE - Big Volume For Buy Side 4230 - 4220: The high-volume demand zone and optimal entry point for the major Long trade.
📈 TODAY'S ACTION PLAN
Primary Action (Prioritize BUY): Wait for the price to correct to the REACTION FIBO BUY ZONE 4270 - 4265 or 4230 - 4220.
Long Entry: Execute the BUY entry only upon confirmed reversal candles (H1/M30/M15).
Scalp SELL Action: If the price strongly rejects the 4340 - 4320 zone, a quick SCALP SELL targeting the nearest BUY ZONE can be considered.
Targets (TP): Aim for the highs and the 435x Sell Zone for the Longs.
⚠️ Risk Warning
Risk Management: Always place a safe Stop Loss (SL) below the nearest active BUY ZONE. DO NOT OVERLEVERAGE in this corrective phase.
Wishing all FranCi$$_FiboMatrix traders a disciplined and victorious day!

XAUUSD UPDATE / WE SMASHED BUY TRADEOur Friday buy setup smashed TP exactly as planned ✅
After grabbing liquidity from the lows, gold delivered cleanly into premium zones — and now we’ve flipped short from supply.
Market structure shifted bearish with confirmation — liquidity taken above highs, fib golden zone tapped, and distribution phase active.
Current play: scaling in on retraces between 4348–4358 with next downside targets sitting around 4310, 4280, and extended 4250.
SL above 4360, partials already booked, risk-free on the remaining positions.
Structure clean, bias clear — bears taking over after a textbook liquidity grab.
#XAUUSD #GoldAnalysis #SmartMoneyConcepts #LiquiditySweep #MarketStructure #OrderBlocks #FVG #SwingTrade #PriceAction #ForexSetup #ValhallaFX #TradingViewCommunity

Entry: Near $4,320 – $4,325 (Buy Zone) Stop-Loss: Below $4,310 Market Structure Overview
The price is currently moving inside a descending channel (marked as TRADE LINE).
A Buy Zone is identified between $4,315 – $4,325, which acts as a strong support area.
Price has touched the lower channel line and rebounded upward, indicating buyer interest around that zone.
📉 Short-Term Trend
The short-term trend is bearish due to lower highs and lower lows inside the channel.
However, momentum shows weakening selling pressure near the buy zone.
🟢 Bullish Scenario
If price holds above the Buy Zone and forms bullish candles, expect a potential reversal toward the upper channel line.
A breakout above the upper channel would signal a trend shift, targeting:
Target: $4,381 – $4,385 (as marked on your chart).
🔴 Bearish Scenario
If price breaks below $4,315, it would invalidate the buy zone setup.
Next potential support could be around $4,300 or lower.
📊 Trade Plan Example
Entry: Near $4,320 – $4,325 (Buy Zone)
Stop-Loss: Below $4,310
Take-Profit: $4,380 – $4,385
Risk-to-Reward: Approximately 1:4
⚙️ Summary
Gold is currently consolidating within a descending channel.
A bullish breakout from this structure could open the path toward the $4,381 target zone, confirming short-term bullish reversal momentum. LME:SC1! TMX:SXF1! TMX:CGB1! TMX:CGZ1! TMX:CGF1! TMX:LGB1! TMX:BSF1! TMX:FBA1! TMX:FCN1! TMX:FDO1! TMX:FEB1! TMX:FER1! TMX:FEB1! TMX:FHO1!

Fair Value Gap Zones (FVG)🟢 Bullish Scenario
Buyers may step back in around these FVG zones:
Zone 1: 4325–4330
Zone 2: 4310–4315
Zone 3: 4285–4290
These are possible liquidity refill points for another push upward.
📈 Buy Plan
Entry: 4325–4330
Stop-loss: Below 4310
Take-profit: 4355 → 4365

Gold Holding Gains Ahead of Key US CPI DataGold extends its bullish momentum in early Asian trading, hovering near ₹4,370, supported by rate-cut expectations from the Fed and ongoing US government shutdown concerns, which continue to pressure the USD.
According to CME FedWatch, markets are now pricing in a 99% probability of another rate cut next week — a strong catalyst for gold bulls.
Lower interest rates reduce the opportunity cost of holding non-yielding assets like gold, reinforcing the medium-term uptrend.
However, all eyes are on the US September CPI report due later this week.
A hotter-than-expected reading could temporarily lift the USD and trigger short-term volatility in gold prices.
🔍 MMFlow Technical Outlook
Gold is currently consolidating around the ₹4,320–₹4,370 range after reaching the ATH zone.
Price action shows a clear liquidity sweep at the highs, followed by a minor retracement — still within the bullish structure.
The main trendline remains intact, suggesting that any dip toward ₹4,305–₹4,260 may attract new buyers.
⚙️ Trading Plan (MMFlow View)
🔼BUY SCALP
📌Entry: ₹4,302 – ₹4,300 (½ volume)
❌Stop Loss: ₹4,292
✔️Take Profit: ₹4,310 → ₹4,315 → ₹4,320 → ₹4,330 → ₹4,340 → ₹4,350+
🔼BUY ZONE (Swing)
✨Entry: ₹4,260 – ₹4,258
❌Stop Loss: ₹4,252
✔️Take Profit: ₹4,265 → ₹4,270 → ₹4,280 → ₹4,290 → ₹4,300+
📈Buy setups remain favored as long as price holds above ₹4,260.
Intraday sell reactions near ₹4,360–₹4,378 are short-term only — watch for liquidity grabs and bullish re-entry opportunities.
⚡️Key MMFlow Zones
CP Down Zone / OBS Sell Zone: ₹4,360
ATH Liquidity Sell Zone: ₹4,448
Retest Trendline / OBS Buy Zone: ₹4,305
End FVG Uptrend / OBS Buy Zone: ₹4,260
Sentiment: 🟢 Bullish Bias
Bias Confirmation: CPI Data & Fed Rate Expectations
Strategy: Buy-the-Dip → Target Liquidity Above ₹4,370–₹4,380
🔥 Stay patient — let liquidity drive the next leg. MMFlow tracks smart money zones, not emotions.

XAU/USD – Gold Technical Rebound Prepares for Next Waveb]🔍 Market Context
After reaching a peak at the ATH GOLD 4,391 USD region, gold has undergone a technical correction — reflecting temporary profit-taking following a strong upward trend.
The market structure still maintains a bullish bias as the support zones below (FVG + OB) remain intact and untested.
Currently, the price is hovering around 4,325 USD, indicating that selling pressure has weakened.
Buyers are likely to return at two strategic zones below — where institutional money (Smart Money) typically accumulates positions before the next upward wave.
💎 Technical Analysis
ATH GOLD: 4,391 USD
Liquidity Zone $$$: 4,465 – 4,424 USD → the upper liquidity zone, the main target for the next upward wave.
FVG Zone: 4,284 – 4,267 USD → an unfilled gap, likely to be retested.
Order Block Zone: 4,244 – 4,230 USD → deep discount zone confluence with Fibo 0.786, high probability of strong reaction.
Liquidity Clear $$$: 4,186 – 4,190 USD → the last defense zone of the main upward trend.
Overall structure remains bullish ; the current decline is merely a phase of adjustment to “accumulate liquidity” before continuing the upward momentum.
📈 Trading Scenarios
1️⃣ BUY Setup #1 – FVG Zone 4,267 USD
Entry: 4,267 – 4,270
SL: 4,255
TP: 4,330 → 4,366 → 4,391
✅ Condition: Confirming bullish candle (rejection / engulfing bullish) at the FVG zone or a small BoS appears on M15.
➡️ Short-term “buy-the-dip” setup, leveraging the unfilled FVG zone — where technical buyers often initiate positions first.
2️⃣ BUY Setup #2 – Order Block Zone 4,244 USD
Entry: 4,244 – 4,230
SL: 4,210
TP: 4,284 → 4,366 → 4,391 → 4,424
✅ Condition: Strong confirming candle (engulfing bullish) or a retracement pattern breaking a small BoS back up.
➡️ Swing-buy setup at deep discount zone — confluence of OB + Fibo 0.786, high probability and optimal R:R.
⚠️ Risk Management
Avoid FOMO buying in the middle of the range (4,320–4,340).
Prioritize waiting for clear reactions at 4,267 and 4,244 before entering trades.
If the price closes an H1 candle below 4,210 → pause all buy orders, re-evaluate price action at 4,186.
Maintain moderate trading volume during the current rebound phase.
💬 Conclusion
Gold is in a phase of healthy technical correction within a major upward trend.
The two zones 4,267 USD (FVG Zone) and 4,244 USD (Order Block Zone) are key “accumulation” areas for large capital.
When bullish confirmation signals appear, these will be safe buy positions before gold heads back to the peak 4,391 – 4,465 USD .
👉 Reasonable Strategy:
Buy at 4,267 – 4,270 USD if reversal confirmation occurs.
Buy at 4,244 – 4,230 USD if a strong OB reaction signal appears.
🔥 “Smart money waits at precise levels — not at the top. The next gold wave will emerge between 4.267 and 4.244.”

Gold 1H – Bullish Rebound After Strong Correction🟡 XAUUSD – Intraday Trading Plan | by Ryan_TitanTrader
📈 Market Context
Gold is attempting to rebound near $4,320 after a sharp correction earlier this week, as traders weigh the recent pullback in U.S. Treasury yields and renewed expectations of a dovish Federal Reserve tone.
Markets are now positioning ahead of key U.S. housing and manufacturing data, which could shape short-term sentiment for both the dollar and real yields.
• Softer economic numbers may reinforce the case for policy easing in early 2026, supporting gold’s safe-haven appeal.
• Conversely, stronger data could momentarily pressure XAUUSD, yet the broader uptrend remains intact amid central-bank accumulation and geopolitical tension.
Expect a liquidity-driven environment, with price potentially sweeping lower before reclaiming bullish momentum.
🔎 Technical Analysis (1H / SMC Style)
• Structure: Overall bias remains bullish following consecutive Breaks of Structure (BOS) and a confirmed Change of Character (ChoCH) indicating corrective retracement.
• Discount Zone: The $4,270–$4,272 demand area sits within the discount zone of the recent range (swing low to 4454 high), ideal for re-accumulation.
• Liquidity Sweep: Recent wicks near $4,300 suggest liquidity has been collected, potentially setting up for another bullish push.
• Premium Zone: Upside liquidity clusters near $4,454–$4,452, aligning with a premium supply area where short-term selling may appear.
🔴 Sell Setup
• Entry: 4454 – 4452
• Stop-Loss: 4463
• Take-Profit Targets: 4400 → 4330
🟢 Buy Setup
• Entry: 4270 – 4272
• Stop-Loss: 4260
• Take-Profit Targets: 4340 → 4380 → 4450 +
⚠️ Risk Management Notes
• Wait for M15 BOS/ChoCH confirmation before triggering entries.
• Avoid entries during high-volatility windows around U.S. data releases.
• Secure partial profits near intermediate liquidity zones, trail stops after BOS confirmation.
✅ Summary
Gold maintains a bullish re-accumulation structure following a healthy correction.
A retest into the discount zone around $4,270 offers potential long entries targeting the premium zone near $4,450+.
Only a decisive break below $4,260 would invalidate the intraday bullish scenario.
FOLLOW RYAN_TITANTRADER for more SMC trading insights ⚡

Sub-Brokers and Their Impact on IndiaWhat is a Sub-Broker?
A sub-broker is an individual or entity registered with a stock exchange and authorized by a main broker (or stockbroker) to act on their behalf. Sub-brokers do not directly hold clients’ funds or execute trades independently; instead, they act as facilitators, providing advisory services, opening client accounts, and executing transactions through the main broker. In India, sub-brokers are regulated by the Securities and Exchange Board of India (SEBI), which ensures transparency, accountability, and investor protection.
Key Functions of Sub-Brokers:
Client Acquisition: Sub-brokers help main brokers expand their customer base by reaching clients in tier-2 and tier-3 cities, where the presence of large brokerage firms is limited.
Advisory Services: They educate and guide investors about market trends, investment strategies, and risk management.
Trade Execution Assistance: Sub-brokers facilitate trading by transmitting orders from clients to the main broker for execution.
Administrative Support: They assist with documentation, KYC compliance, account opening, and other formalities required for investing in the stock market.
Market Promotion: By engaging directly with local communities, sub-brokers enhance the popularity of stock market investments among the general public.
Historical Perspective of Sub-Brokers in India
Historically, Indian stock markets were concentrated in metros like Mumbai, Delhi, and Kolkata. The cost of trading and lack of awareness restricted participation primarily to urban investors. Sub-brokers emerged as intermediaries in the 1980s and 1990s to bridge this gap. Their presence democratized access to the stock market, especially after the establishment of SEBI in 1992, which formalized regulatory oversight and introduced investor protection mechanisms.
With the advent of technology and online trading in the 2000s, the role of sub-brokers evolved. While digital platforms enabled direct trading, sub-brokers remained crucial in providing advisory services and reaching less tech-savvy populations.
Impact on Indian Financial Markets
1. Enhancing Market Accessibility
India has a vast population, with a significant percentage residing in semi-urban and rural areas. Sub-brokers act as the first point of contact for investors in these regions. By reducing physical and informational barriers, sub-brokers enable wider participation in the capital markets. This not only increases market liquidity but also encourages a culture of investment beyond traditional savings instruments such as fixed deposits or gold.
Example: A sub-broker in a tier-3 town can guide first-time investors to invest in equities, mutual funds, or derivatives, expanding financial market penetration.
2. Promoting Financial Literacy
A significant challenge in India has been low financial literacy. Many potential investors hesitate to enter the stock market due to lack of understanding of investment products, risk factors, and regulatory processes. Sub-brokers bridge this gap by offering guidance, conducting workshops, and explaining complex market concepts in local languages. This contributes to long-term investor confidence and reduces the risk of uninformed or speculative trading.
Example: Sub-brokers often organize local seminars explaining the benefits of SIPs (Systematic Investment Plans) or diversified equity investments, thereby increasing informed participation.
3. Supporting Small and Retail Investors
Large brokerage firms often focus on high-net-worth individuals or urban centers due to higher transaction volumes and profitability. Sub-brokers, however, target retail investors, enabling them to participate in investment opportunities that were previously inaccessible. By supporting small investors, sub-brokers play a role in wealth creation at the grassroots level.
4. Market Liquidity and Depth
Sub-brokers increase the liquidity of financial markets by channeling numerous small transactions into the system. Each sub-broker represents a pool of retail investors, contributing to the overall trading volume. Greater liquidity reduces price volatility and promotes efficient price discovery. This is crucial for market stability and investor confidence, particularly in emerging markets like India.
5. Employment and Economic Growth
Sub-brokers contribute indirectly to the economy by generating employment and entrepreneurial opportunities. Each sub-broker acts as a small business entity, employing staff and creating a local economic ecosystem. This microeconomic impact contributes to broader economic growth by integrating local communities into financial markets.
Example: Sub-brokers often hire relationship managers, office assistants, and market educators, thereby generating local jobs.
6. Encouraging Long-Term Investments
Through personalized advice, sub-brokers promote long-term investing strategies, discouraging speculative or short-term trading behaviors that can destabilize markets. By nurturing a culture of disciplined investment, sub-brokers indirectly enhance the sustainability and maturity of Indian capital markets.
7. Regional Market Development
India’s stock market has historically been concentrated in urban hubs. Sub-brokers enable the growth of regional markets by attracting local investors and integrating them into national trading networks. This decentralization ensures that economic growth is not limited to a few metropolitan areas but spreads to smaller towns and cities.
Regulatory Framework for Sub-Brokers in India
The impact of sub-brokers is strengthened by the regulatory oversight of SEBI, which ensures that investor interests are safeguarded. Key aspects include:
Registration: Sub-brokers must register with SEBI and the stock exchanges they operate in.
Code of Conduct: Sub-brokers adhere to ethical standards to prevent malpractices like mis-selling or mismanagement of client funds.
Training and Certification: SEBI mandates training programs and examinations to ensure sub-brokers are competent and informed about market practices.
Periodic Audits: Exchanges conduct audits to ensure compliance with operational and financial standards.
This framework ensures that sub-brokers positively impact the market while minimizing potential risks for investors.
Challenges Faced by Sub-Brokers
While sub-brokers contribute significantly to market growth, they face several challenges:
Competition from Online Platforms: Digital trading apps offer direct access to the stock market, reducing dependency on sub-brokers.
Limited Revenue Models: Sub-brokers earn primarily from commissions, which can be volatile depending on market conditions.
Investor Trust: Some sub-brokers, particularly in rural areas, face challenges in establishing credibility and trust among first-time investors.
Regulatory Compliance: Adhering to SEBI norms and maintaining transparency requires continuous effort and investment.
Technological Adaptation: To remain relevant, sub-brokers need to embrace technology, which may be challenging in less urbanized regions.
Future Prospects of Sub-Brokers in India
Despite challenges, the future of sub-brokers in India remains promising due to several factors:
Financial Inclusion: India’s push for financial inclusion under programs like PMJDY (Pradhan Mantri Jan Dhan Yojana) and digital banking encourages sub-brokers to extend services to unbanked populations.
Growing Middle Class: Increasing disposable income among India’s middle class creates a larger investor base, offering opportunities for sub-brokers.
Education and Awareness: Government and private initiatives promoting financial literacy provide a fertile environment for sub-brokers to educate investors.
Hybrid Models: By integrating online trading platforms with traditional advisory services, sub-brokers can expand their reach and enhance profitability.
Conclusion
Sub-brokers play an indispensable role in the Indian financial ecosystem. They act as facilitators, educators, and market intermediaries, bridging the gap between formal financial institutions and investors, especially in semi-urban and rural regions. Their contribution is multifaceted: increasing market accessibility, promoting financial literacy, supporting retail investors, enhancing liquidity, and contributing to regional economic development.
While technological advancements and online trading platforms present challenges, sub-brokers remain relevant due to their personal touch, local presence, and advisory services. As India moves towards a more inclusive and digitally connected financial system, sub-brokers will continue to shape the growth of capital markets and contribute to the broader economic development of the country.
In essence, sub-brokers are not merely intermediaries; they are catalysts of financial empowerment, driving the democratization of investment opportunities and fostering a culture of informed and responsible investing across India.

XAUUSD MULTI TIME FRAME ANALYSISHello traders , here is the full multi time frame analysis for this pair, let me know in the comment section below if you have any questions , the entry will be taken only if all rules of the strategies will be satisfied. wait for more price action to develop before taking any position. I suggest you keep this pair on your watchlist and see if the rules of your strategy are satisfied.
🧠💡 Share your unique analysis, thoughts, and ideas in the comments section below. I'm excited to hear your perspective on this pair .
💭🔍 Don't hesitate to comment if you have any questions or queries regarding this analysis.

Elliott Wave Analysis – XAUUSD (October 21, 2025)
🔹 1. Momentum
H4:
H4 momentum is currently turning bearish, indicating that the main trend for today is downward.
H1:
H1 momentum is stuck in the oversold zone, suggesting that price could continue to fall, but at the same time, there’s a risk of a short-term bullish reversal — this should be monitored carefully.
M15:
M15 momentum is also turning bearish, confirming the potential for short-term downside continuation.
🔹 2. Wave Structure
H4 timeframe:
The current price structure likely forms a Flat correction (W–X–Y in blue) as part of wave 4 (in purple).
The X wave appears completed, and price is now in the declining phase of wave Y.
Wave Y may develop in three possible forms:
Zigzag
5-wave impulsive
Triangle
👉 In Zigzag or 5-wave formations, the target is usually equal to wave A.
👉 In a triangle, price may build higher lows, respecting the upper boundary connecting wave 3 and wave X.
H1 timeframe:
The H1 structure mirrors H4, but note that H1 momentum remains in the oversold zone, meaning an upward reversal could occur anytime.
M15 timeframe:
Used mainly for entry timing.
Since H4 momentum trend is bearish, we will prioritize Sell setups, especially after liquidity retests or breakdowns on the M15 chart.
🔹 3. Trading Plan
Main bias: Bearish (following H4 momentum)
Strategy:
Focus on Sell setups when price retests or breaks below liquidity zones.
Consider Buy setups only if price reaches the 4190 support area, signaling a potential end of wave 4 (purple) and the start of wave 5 (bullish).
Buy setup (if wave 4 completes):
Buy zone: 4193 – 4190
Stop loss: 4180
Take Profit: 4236
🔹 4. Alternative Scenarios
If price breaks sharply above 4381, the current wave count will be invalidated, and price could head toward 4451.
If price forms a triangle, with 4381 as the upper boundary and higher-low supports forming the lower edge, a breakout above 4381 would signal a Buy opportunity.

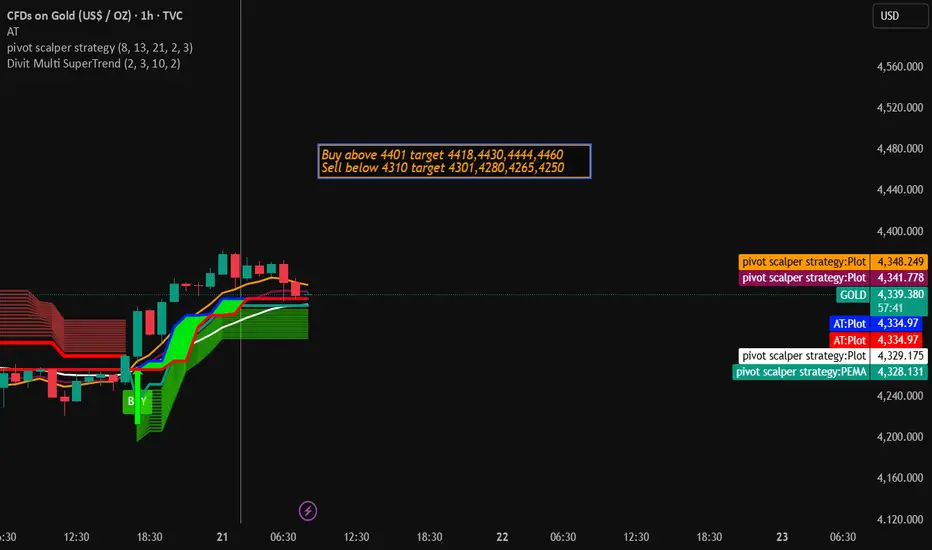
Gold Trading Strategy for 21st October 2025💰 GOLD TRADING SETUP (INTRADAY) 💰
📈 BUY Setup:
👉 Buy Above: High of 15-min candle close above ₹4401
🎯 Targets:
1️⃣ ₹4418
2️⃣ ₹4430
3️⃣ ₹4444
4️⃣ ₹4460
🛡️ Stop Loss: Below the breakout candle low
📉 SELL Setup:
👉 Sell Below: Low of 15-min candle close below ₹4310
🎯 Targets:
1️⃣ ₹4301
2️⃣ ₹4280
3️⃣ ₹4265
4️⃣ ₹4250
🛡️ Stop Loss: Above the breakdown candle high
⚠️ Disclaimer:
📢 This analysis is for educational and informational purposes only.
💼 Trading involves risk of capital; please do your own research or consult your financial advisor before taking any position.
💸 The author is not responsible for any profits or losses incurred from trades taken based on this information.
✨ Tip: Always wait for a proper candle close and confirmation before entry. Manage risk wisely! 🧠💹
XAUUSD PLAN | When balanced breaks, strength leaves its mark.🔍 Market Context
After setting a short-term peak at the 4,385 – 4,372 USD zone, gold has entered a strong technical correction phase, with a series of consecutive red candles breaking the short-term upward structure.
The sellers temporarily dominate, pushing the price through the H1 upward trendline. However, the support zone below (Liquidity Zone + Order Block Bullish) is beginning to show absorption, indicating that buyers might return at discounted price zones.
💎 Technical Analysis
Previous Bullish BoS: confirms the main trend is still long-term bullish .
FVG Down Zone: 4,285 – 4,260 USD → a price imbalance zone left in the downtrend, possibly where the price may retrace to “fill the gap” before choosing a direction.
Liquidity Zone $$$: 4,222 – 4,218 USD → a short-term support zone where new buying liquidity appears.
Order Block Bullish: 4,203 – 4,185 USD → a confluence area between OB and Fibo 0.786, where large capital might return.
Deep Bullish OB: 4,142 – 4,128 USD → the last defensive zone for the main upward trend.
Order Block Bearish: 4,372 – 4,385 USD → a critical resistance zone, likely to react if the price retraces.
The current structure shows gold is in a retracement – liquidity rebalancing phase, with insufficient signals to reverse the trend.
📈 Trading Scenarios
1️⃣ Main Scenario – Buy reaction at Liquidity zone 4,222 – 4,203 USD
Entry: 4,222 – 4,203
SL: 4,185
TP: 4,260 → 4,318 → 4,372
✅ Condition: Strong rejection candle (rejection / engulfing bullish) appears at the support zone or small reversal BoS.
➡️ This is a “buy the dip” setup following the main trend, leveraging the liquidity zone and confluence OB.
2️⃣ Secondary Scenario – Sell reaction at FVG Down 4,285 – 4,260 USD
Entry: 4,260 – 4,285
SL: 4,300
TP: 4,222 → 4,203
✅ Condition: Strong bearish candle or rejection signal appears at the FVG zone.
➡️ This setup is for scalping traders or short-term shorts in the unfilled price balance zone.
⚠️ Risk Management
Do not FOMO buy when the price has not confirmed the 4,222 zone.
If the price breaks below 4,185 → wait for a re-test to continue selling towards the 4,128 zone.
Keep moderate volume, as the market is in a rebalancing phase – liquidity remains noisy.
💬 Conclusion
Gold is in a transitional phase after a strong decline .
The 4,222 – 4,203 USD zone will be key to determining whether the medium-term upward trend continues.
If this zone holds, gold is likely to retest the 4,318 – 4,372 USD zone.
👉 Reasonable Strategy:
Buy reaction at 4,222 – 4,203 USD when confirmed.
Technical Sell at FVG 4,260 – 4,285 USD if a clear rejection appears.
🔥 “When the market is unbalanced, the strongest side will leave a mark – and this time, the mark is around the 4,220 USD zone.”

Gold Trading Strategy | October 20-21✅ 4-Hour Chart Analysis: Since rebounding from the 4186.62 low, gold has continued to strengthen, currently trading around the 4340–4350 zone and approaching the upper resistance area.
The moving averages (MA5 and MA10) have formed a golden cross, while MA20 is turning upward, indicating that the short-term trend has shifted from weak to strong. Both MA60 and MA120 remain in an upward slope, confirming that the medium-term structure is still bullish.
The Bollinger Bands show the upper band near 4369, the middle around 4265, and the lower near 4160. The price has regained the middle band and is now approaching the upper band, suggesting the market has shifted from previous consolidation to a rebound recovery phase.
If gold breaks through the 4365–4375 area, it may further test the previous high at 4379.52, and potentially challenge the 4400 level.
✅ 1-Hour Chart Analysis: After rallying from its recent low, gold has formed a clear upward channel. The upper Bollinger Band is around 4356, the middle near 4278, and the lower around 4200.
The price is trading near the upper band, showing strong short-term bullish momentum, though caution is warranted near the 4350–4370 resistance area where profit-taking may occur.
The short-term trend remains strong; however, if gold fails to break 4355–4375, it may face a mild consolidation. Key support lies around 4320–4300.
🔴 Resistance Levels: 4355–4375 / 4400
🟢 Support Levels: 4320–4300 / 4265
✅ Trading Strategy Reference:
🔰 If the price breaks and stabilizes above 4375, consider light long positions, targeting 4400–4415, with a stop loss below 4350.
🔰 If the price rebounds to 4350–4375 and faces resistance, consider taking partial profits or short-term selling opportunities.
🔰 If the price pulls back to 4320–4300 and stabilizes, consider re-entering long positions for another upward move.
📊 Gold’s overall trend remains bullish, with the short-term rebound still in progress.
The 4-hour chart indicates the medium-term bullish structure remains intact, while the 1-hour chart shows strong short-term momentum.
If gold breaks above 4375–4380 during the U.S. session, it could re-enter a strong upward trend channel; however, if it faces resistance and falls below 4320, it may return to a high-level consolidation phase.

Gold Bullish Reversal from Demand Zone Targeting 4320 ResistanceGold has displayed a strong bullish rejection from the 4,220–4,240 demand zone, signaling that buyers are stepping back in after a brief corrective phase. The price has respected the previously broken ascending trendline, now acting as dynamic support, indicating that market sentiment remains positive.
Key Observations:
Trend Structure: The broader trend continues to favor the bulls, with higher highs and higher lows still valid.
Demand Zone: Buyers defended the 4,220–4,240 area with stxrong volume, confirming institutional interest.
Price Action: Recent bullish engulfing candles suggest renewed buying momentum.
Next Resistance: The 4,310–4,330 region stands as a key resistance zone where partial profit-taking could occur.
Volume: Noticeable increase in bullish volume near support adds confirmation to the move.
Trading Outlook:
If price sustains above 4,240, the bias remains bullish toward 4,320–4,340.
A daily close below 4,220 would invalidate this setup and shift focus back to the 4,100 zone.
Summary
Gold is currently positioned for a potential continuation of its primary uptrend, with early signs of buyer strength re-emerging at major support. Momentum remains in favor of the bulls as long as the 4,220 base holds firm.

XAUUSD BUY POSITION SINCE FRIDAYAlright fam 💥 here’s how you can talk to your subscribers about this XAUUSD move — clean, confident, and with that trader flex 👇
---
**“Team, what a beautiful play on Gold today! 🔥**
We called this setup days ago, and it played out *exactly* as planned. Here’s the breakdown 👇
We had a strong **bullish structure** building from that ‘Pick Pocket’ zone — that was our key demand area where price last left unfilled orders. Once price tapped back into that zone, it showed a perfect reaction: low-volume retracement, then strong impulsive move up — classic **liquidity sweep + mitigation combo**.
I waited for confirmation on M15 with a clean break of structure and fair value gap fill — that’s where we jumped in.
The target? That **previous high zone / supply area** marked in red — and boom, price has already pushed straight into it! 🚀
Why this move matters:
* We didn’t chase entries, we waited for price to *come to us.*
* Structure respected perfectly from H1 to M15 alignment.
* This shows patience + planning always beats panic trading.
Honestly, I’m *super proud* of this trade — not just for the profit, but for the discipline behind it. 🧠💰
Gold once again proving that when you trust your analysis and process, the market rewards you.
VALHALLA FX 🔱 — Precision. Patience. Profit.”
---

Gold Analysis and Trading Strategy | October 20✅ 4-Hour Chart Analysis: After reaching the previous high of 4379.52, gold has continued to fluctuate and pull back, currently trading near the middle Bollinger Band (around 4250–4260). The market is in a high-level consolidation phase, with support at 4160–4180 and resistance at 4275–4280. If the price fails to hold above the mid-band in the short term, it may continue to test support near the lower Bollinger Band (around 4150).
Moving Averages: MA5 and MA10 have formed a bearish crossover, indicating short-term weakness; MA20 (around 4256) is acting as a key resistance; meanwhile, MA60 and MA120 remain in an upward trend, suggesting that the medium- to long-term bullish structure is still intact.
Bollinger Bands: The upper band is near 4357, the middle around 4256, and the lower near 4155. The price is currently below the middle band; if it fails to reclaim the 4265–4280 area, there is still a risk of further downside movement.
✅ 1-Hour Chart Analysis: After bottoming out around 4186.62, gold rebounded slightly and is now trading in a narrow range between 4250–4265.
The Bollinger Bands have narrowed, indicating reduced short-term volatility and a consolidation phase. The upper band is around 4279, the lower around 4213, and the price is oscillating near the middle band (around 4246), suggesting a lack of momentum for a breakout.
The 1-hour structure shows a sideways corrective pattern, with resistance remaining at 4275–4280 and short-term support at 4220–4210, reflecting a weak and range-bound bias.
🔴 Resistance Levels: 4275–4280 / 4300
🟢 Support Levels: 4180–4160 / 4090
✅ Trading Strategy Reference:
🔰 If the price rebounds to 4275–4280 and faces resistance, consider light short positions targeting 4180–4160, with a stop loss above 4300.
🔰 If the price dips to 4175–4180 and stabilizes, consider cautious long entries targeting 4250–4270, with a stop loss below 4160.
📊 Summary:
Gold’s short-term trend remains weak and range-bound. The 4-hour chart shows that bearish momentum is easing but not yet reversed, while the 1-hour chart indicates limited rebound strength.
Overall, 4280 remains the key resistance level — failure to break above it would likely extend the current correction. Meanwhile, the 4160–4180 support zone will determine whether the medium-term bullish structure can remain intact.
GOLD Accumulates Above $4200 Which Fibo React Zone Fires First ?🎯 Macro Summary & Bias: The Calm Before the Geopolitical Storm
Gold is trading above the psychological $4,200 mark but struggled to gain meaningful traction on Monday due to mixed forces.
Driving Forces: Increased geopolitical tensions and trade uncertainty act as tailwinds for the safe-haven asset.
USD Weakness: Expectations for more Fed rate cuts and the US government shutdown weaken the USD, providing support for XAU/USD. Traders have fully priced in two more rate cuts this year, which continues to pressure the US Dollar.
Technical Outlook: Gold is currently consolidating above $4,200, signaling that the bullish structure remains intact. We are now watching for confirmation at key Fibo levels before the next breakout.
📊 In-Depth Technical Analysis (H1): Pinpointing the FIBO Reaction Levels
Our core strategy is to BUY ON DIPS at the identified Fibo Reaction Zones and look for short-term Sells only as resistance tests (Referencing image_58f686.png).
1. Strategic BUY Zones (FIBO BUY REACT ZONE):
These are the crucial support zones for initiating Long entries:
Reaction Fibo Buy Zone 4230 - 422x. This is the immediate, primary support zone where we anticipate the first bounce.
Big Volume For The BUY Side 4205 - 4200. This is the major demand zone and the ultimate pullback point to catch the large growth wave.
2. Strategic SELL Zones (FIBO SELL REACT ZONES):
These are high-volume resistance areas for potential Take Profit (TP) or short-term Scalp Sells:
Reaction Fibo Sell Zone 4280 - 4285. The first key resistance level where the price may encounter selling pressure.
Reaction Fibo Sell Zone 4315 - 4320. The next significant resistance and TP level.
Big Volume For The Sell Side 4356 - 4360. The major supply and long-term TP target.
📈 TODAY'S ACTION PLAN
Primary Action (Prioritize CHỜ ĐỢI BUY): The market is consolidating. Do NOT FOMO. Patiently wait for the price to correct to the Reaction Fibo Buy Zone 4230 - 422x.
Long Entry: Upon confirmation (H1/M30/M15 reversal candles) at the BUY Zones, confidently activate the Long (BUY) entry.
Targets (TP): Aim for the successive SELL Zones: 428x, 431x, and the ultimate target at 4356 - 4360.
⚠️ Risk Warning
Risk Management: Always place a safe Stop Loss (SL) below the nearest active BUY ZONE. Monitor trade talks closely as they could trigger sharp volatility.
Wishing all FranCi$$_FiboMatrix traders a disciplined and victorious week!

4,200 or 4,285? Gold’s Next Move Decides It All📊 Market Overview
Gold remains under pressure at the start of the week, trading below last week’s record highs, after a sharp correction from the 4,380s down to the 4,240 zone.
Investor sentiment is cautious as the market navigates a mix of uncertain U.S. economic data, a still-closed U.S. government, and renewed geopolitical tensions across multiple regions — all of which are fueling both fear and indecision in the market.
During early Asian hours, gold showed a mild recovery but continues to move sideways in a tight consolidation range, reflecting indecisive liquidity buildup before the next major move.
🧠 Technical Structure (MMFLOW View)
Gold is consolidating between short-term support near 4,206–4,204 and resistance around 4,285–4,287.
Liquidity has started to cluster above and below the current range, suggesting that a breakout is imminent.
The 4,166 – 4,140 region remains a major Smart Money re-entry zone, aligned with the CP BUY ZONE + OBS demand block.
On the upside, 4,313 – 4,342 stands as a key supply zone where large sellers previously stepped in.
Until price breaks out decisively, traders should expect choppy intraday conditions with limited follow-through.
🔑 Key Levels to Watch
🟢 BUY ZONE (Liquidity Re-entry Zone)
Zone: 4,206 – 4,204
SL: 4,200
TP: 4,210 – 4,215 – 4,220 – 4,230 – 4,240 – 4,250 – ???
🔴 SELL ZONE (Liquidity Reaction Zone)
Zone: 4,285 – 4,287
SL: 4,292
TP: 4,280 – 4,275 – 4,270 – 4,260 – 4,250 – ???
⚙️ MMFLOW Scenarios
1️⃣ Bullish Scenario:
If gold sustains above the 4,200 – 4,210 support area, a short-term rebound toward 4,270 – 4,285 can be expected.
Breaking above 4,287 would open room toward 4,313 – 4,342 (OBS Sell Zone), where Smart Money may begin distributing again.
2️⃣ Bearish Scenario:
A clean break below 4,200 could trigger a deeper retracement toward 4,166 – 4,140 (CP BUY ZONE).
This would still represent a healthy correction within the broader bullish macro structure.
⚡️ MMFLOW Insights
Market remains neutral-to-bullish, but current movement reflects accumulation within a compression range.
Sideway structure indicates the market is loading liquidity for the next impulsive leg.
Patience is key — traders should wait for clean breakout confirmations before scaling positions.
⚠️ Trading Notes
✅ Use tight Stop Losses — gold’s volatility remains unpredictable during macro uncertainty.
✅ Avoid over-leveraging while price stays inside the sideway channel.
✅ Focus on reaction zones (CP, OBS, and liquidity sweeps) for precise entries.
🧭 Quick Summary
Gold trades sideways below record highs.
Key support: 4,206 – 4,204, key resistance: 4,285 – 4,287.
Short-term bias: Range-bound with bullish undertone.
Best approach: Buy dips at liquidity zones; wait for breakout confirmation before trend trades.

Elliott Wave Analysis XAUUSD – October 19, 2025
1️⃣ Momentum
D1 Timeframe:
Daily momentum is showing early signs of bearish reversal.
As mentioned in the previous plan, a daily reversal could occur on Friday or Monday.
The strong bearish D1 candle on Friday reinforces this signal.
If another bearish D1 candle appears on Monday, it will confirm that the main trend for the coming week is likely to turn bearish, pushing D1 momentum toward the oversold zone.
H4 Timeframe:
H4 momentum is preparing to turn upward, suggesting that the initial downside movement on Monday may not be too strong.
A short-term recovery bounce is likely.
However, if this bounce fails to break the previous high and momentum reverses downward again, it will confirm the start of a more stable downtrend.
H1 Timeframe:
H1 momentum is currently in the overbought zone, which indicates a short-term pullback may occur early in Monday’s session.
2️⃣ Wave Structure
D1 Structure:
We can see a strong bearish candle — the largest since the beginning of the uptrend, signaling the first warning of exhaustion.
Together with the D1 momentum reversal, this suggests the yellow wave 3 is likely coming to an end, and yellow wave 4 is starting to form.
In terms of time, wave 4 could take more than a week to complete.
H4 Structure:
A sharp decline has pushed the price back inside the ascending channel, indicating that the extended wave 5 may have already ended.
If confirmed, the market could continue down toward at least the previous blue wave 4 area.
However, because H4 momentum is preparing to rise, a short-term upward correction may occur early Monday.
If this upward move is slow and overlapping, fails to break the previous high, and H4 momentum turns down again, that will confirm the completion of blue wave 5.
H1 Structure:
On the H1 chart, the blue wave 5 from H4 is detailed into five smaller red waves.
The recent steep and fast decline suggests a five-wave bearish pattern, possibly wave 1 of a new downtrend or wave A of a corrective move.
There is also a possibility of a Flat correction, where wave C extends to 1.618 × wave A (as discussed in the October 17 plan).
Overall, the market may present a short-term recovery bounce, providing a buy opportunity early in the week.
3️⃣ Trading Plan
Buy Zone: 4153 – 4151
Stop Loss: 4141
Take Profit: 4193
Alternative Scenario:
If price fails to break below 4193, monitor H1 momentum as it enters the oversold zone and turns upward — that will be a potential buy signal.
In that case, key support areas to watch include: 4243 – 4226 – 4207 – 4194.

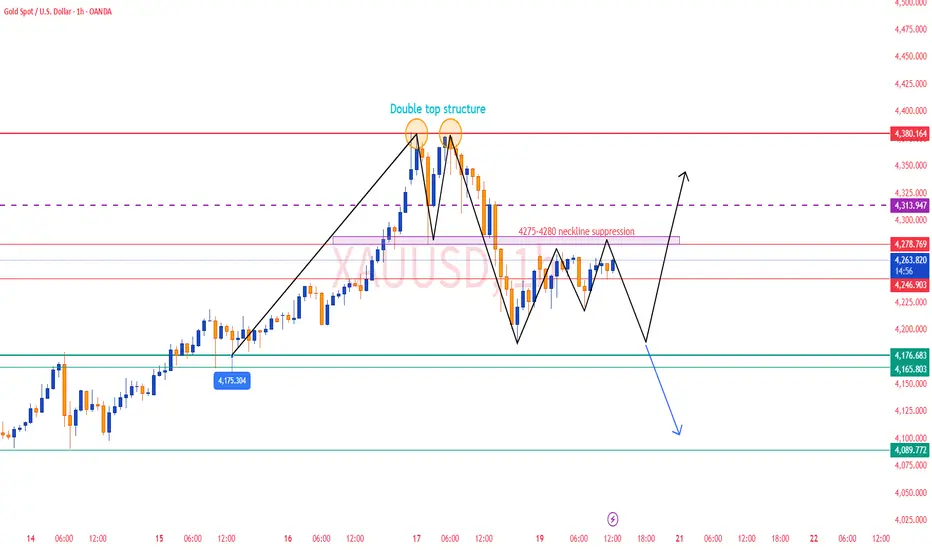
Gold Retracement After 200-Point Fall — Watch for a Rejection!Price Action in Focus | Short Setup on Key Resistance Zone
Gold (XAUUSD) posted a sharp 200-point drop from the all-time high at 4380 on Friday. The current move looks like a technical retracement, not a reversal — a classic dead-cat bounce scenario? 🐈📉
📍 Key Resistance Zone: 4280 – 4300
Price is now testing this zone, which previously acted as a breakdown level. If sellers step in here, we could see another leg lower.
🔍 Short Bias Setup (Not Financial Advice):
🧭 Sell Zone: 4280 – 4300
❌ Invalidation (SL): Above 4321
🎯 Targets: 4241 and 4221
💬 Watching for bearish confirmation before executing — candle wicks, volume spike, or RSI divergence could seal the deal.
⚠️ This is a technical idea, not financial advice. Always manage risk and confirm with your own strategy.
🔔 Follow for live chart updates, breakdowns & strategy threads!
Your feedback drives our content and keeps everyone trading smarter. Let’s make those pips together! 🚀
Happy Trading,
– The InvestPro Team

GOLD (XAUUSD) – Intraday Trading PlanObservation
Gold is currently trading near 4263, showing signs of consolidation after a strong upward movement. The structure suggests a potential bullish continuation if support holds, followed by a rejection zone above.
🟢 Buy Zones
Buy 1 (90% Confirmed): Around 4260–4255
→ Early entry for intraday traders with confirmation from candle reversal.
Buy 2 (100% Confirmed): Break and close above 4380–4384
→ Add positions only if candle closes above this level.
→ Stop Loss: 2 points below entry max 3 time sl hit buy algo
🔴 Sell Zone
Sell Target / Rejection Area: 4451.80 – 4417.82
This is a strong supply and rejection zone (marked with red and black lines).
If price reaches here, expect profit booking or reversal.
🎯 Targets
Short-term Target: 4380
Major Target: 4450
SL for Buy: Below 4250
SL for Sell: Above 4460
⚠️ Note
The black line (4417) acts both as a target and rejection level — strong resistance zone.
Trade with strict stop loss and risk management.
Educational purpose only — not financial advice.
