XAUUSD Positional Long with SL#Gold Positional Trade Outlook
Gold is currently pulling back after a sharp rally, offering #positional traders an opportunity to build entries gradually with the target upto prev ATH or rejection. Price is approaching key demand zones, so follow a scaled stop-loss (SL) structure to manage risk effectively. Consider building positions in phases as price reacts to each support level:
SL1: 4,008 – Early protective stop for light entries
SL2: 3,930 – Medium-risk level for second build-up
SL3: 3,886 – Deep stop for long-term positional holds
Stick to disciplined risk management, add positions only on confirmations, and allow the trend structure to guide your exposure.
Trade ideas

Gold Analysis for upside movement. Gold trading in a sideways zone. buyer's liquidity has already been grabbed. targeting for
sell side pending liquidity.
Gold Analysis and Trading Strategy | November 21-22✅From the 4-hour timeframe, gold rebounded strongly to 4101 (previous high + Bollinger upper band + MA20 resistance) and then quickly fell back to the 4080 area, indicating that selling pressure at higher levels remains very strong.
1️⃣ Moving averages remain bearish
MA5 and MA10 have turned upward slightly, but overall still remain below MA20.
MA20 (around 4155) acts as strong resistance, and the failure to break above shows the rebound is still a weak corrective move, not a trend reversal.
2️⃣ Bollinger Bands remain weak
Price continues to trade near the Bollinger mid-band (around 4071) and has failed multiple times to break the upper band.
The Bollinger Bands have not expanded upward, indicating the market is still in a weak, range-bound structure.
3️⃣ Clear rejection signal
A long upper wick formed at 4101 — a classic “spike and reversal” pattern.
Bears aggressively sold at resistance, forming a clear short-term top.
📌 H4 Conclusion:
Rebound met resistance, the market remains in a weak corrective phase, and no bullish reversal structure has formed.
✅ On the 1-hour timeframe, gold rebounded strongly from 4022 → 4101, but still failed to break through key resistance.
1️⃣ Rebound failure at 4101 → structure shifts to consolidation
After touching 4101, gold quickly pulled back to the 4080 area, showing weakening bullish momentum.
This level corresponds to previous highs + Bollinger upper band resistance, making a breakout difficult.
2️⃣ Moving averages continue to suppress
MA10 / MA20 / MA60 remain in a bearish configuration; the H1 structure has not turned bullish.
Although 4080 provides support, rebound highs are gradually decreasing, signaling fading momentum.
3️⃣ Short-term rebound strength is limited
The most recent rebound only reached MA10 and failed to regain key levels.
This confirms the bounce is a weak correction, not a structural trend change.
📌 H1 Conclusion:
Short-term spike faded, structure remains weak, and rebound is unlikely to break above the 4100–4110 strong resistance zone.
🔴 Resistance Levels
4100–4110 (major resistance zone: previous high + MAs + Bollinger upper band)
4132
4155
🟢 Support Levels
4075–4070
4044–4038
4022
3997
✅If you would like to receive real-time trading signals and professional guidance, you are welcome to join our membership. We provide comprehensive services including account risk management, position control, and strategy adjustments to help you achieve stable and consistent profits in the market🤝
✅ Trading Strategy Suggestions (Key Focus Today)
🔰 Strategy 1: Sell the Rebound (Primary Strategy)
If gold rebounds to 4095–4105 and faces rejection:
✔️ Light short positions
❌ Stop-loss: 4118 (exit immediately if price breaks above 4110)
🎯 Targets: 4075 / 4055 / 4040
👉 Reason: 4100–4110 is extremely strong resistance with low probability of a breakout.
🔰 Strategy 2: Short After a Failed Breakout
If price makes a false breakout above 4110 but fails to hold:
✔️ Enter short immediately
🎯 Same targets as above
⚠️ A long upper wick is a bearish signal.
🔰 Strategy 3: Trend-Following Short on Breakdown
If gold breaks 4038–4044:
✔️ Follow with breakout shorts
🎯 Targets: 4022 / 4008 / 3997
👉 This zone is the key dividing line; breaking it gives full control to the bears.
🔥Trading Reminder: Trading strategies are time-sensitive, and market conditions can change rapidly. Please adjust your trading plan based on real-time market conditions.
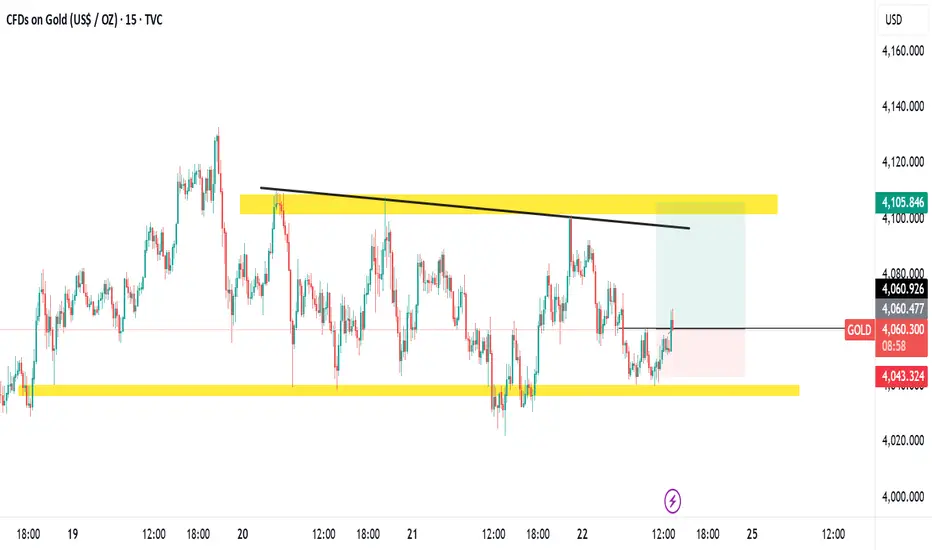
Gold at a Crossroads: Up or Down?If we zoom in and carefully observe how the GOLD price is moving, it becomes immediately clear:
The market has just shown a very strong upward impulse, but now something interesting is happening. The price is tightening and forming a small, narrow triangle, which indicates that the market is accumulating energy. In these situations, there are usually two possible directions, but given the clearly bullish context, I feel that a breakout to the upside is much more likely.
What do you think? Do you agree with me?
Leave your thoughts in the comments. And trust me, being part of the TradingView community will help you improve every day as a trader.
Of course, this is not financial advice, just my personal view on the chart.

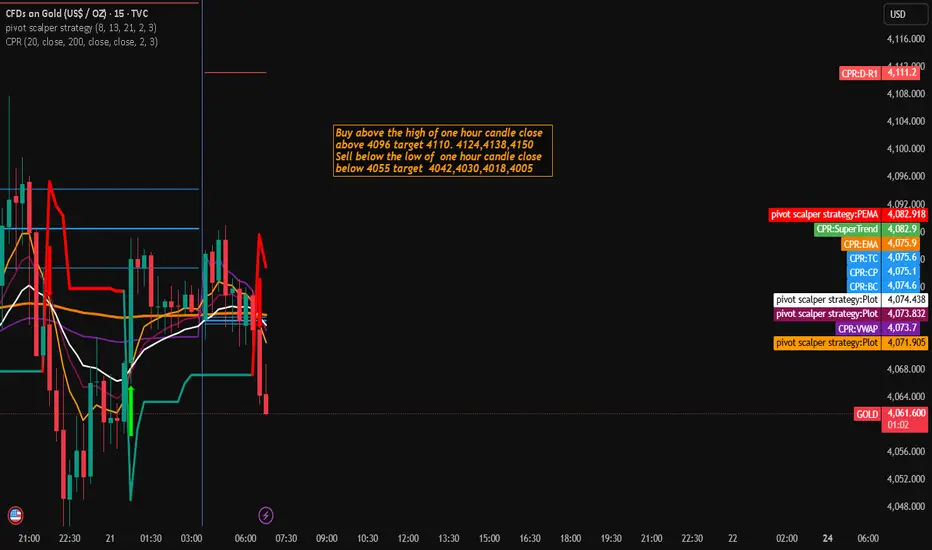
Gold Trading Strategy for 21st November 2025📈 BUY SETUP (Long Position)
➡️ Condition to Enter Buy:
Enter a BUY only if the 1-Hour candle closes above the high of 4096.
This confirms bullish momentum and reduces false breakouts.
🎯 Buy Targets:
TP1: $4,110
TP2: $4,124
TP3: $4,138
TP4: $4,150
🛑 Recommended Stop Loss:
Place SL below the breakout candle low or ≈ $4,085–4,088 based on your risk comfort.
📝 Reasoning:
A strong close above $4096 indicates buyers gaining control.
Targets move in 14–16 point intervals, ideal for intraday or short swing trades.
📉 SELL SETUP (Short Position)
➡️ Condition to Enter Sell:
Enter a SELL only if the 1-Hour candle closes below 4055.
This signals bearish continuation.
🎯 Sell Targets:
TP1: $4,042
TP2: $4,030
TP3: $4,018
TP4: $4,005
🛑 Recommended Stop Loss:
Place SL above the breakdown candle high or ≈ $4,062–4,067 depending on volatility.
📝 Reasoning:
A close below $4055 confirms downside pressure.
Targets decrease in 12–15 point steps, matching typical gold volatility on breakdowns.
🧠 TRADING TIPS
Always wait for candle close confirmation, not wick break.
Use 1–2% risk per trade to avoid major drawdowns.
Check news events (FOMC, CPI, NFP) before entering any trade.
Watch market structure on 15m for refined entries.
⚠️ DISCLAIMER
This analysis is for educational & informational purposes only.
It is NOT financial advice, and trading involves high risk.
You are responsible for your own trading decisions.
Always do your own analysis and use strict risk management.
Gold Turning BEARish #XAUUSD turning BEARish 🐻
Now at 4060.
SELL on RISE 🤞
Expecting significant downside moves
that may last for a couple of hours...
Until trades below 4064 weak trend wud remain
&
wud get intensified after crossing 4049-51 range...🤞
Expected to hit-
TP 1: 4041
TP 2: 4029
TP 3: 4019
SL: 4087

Elliott Wave Analysis XAUUSD – 21/11/2025
1. Momentum
D1:
The D1 momentum is contracting, signaling a potential reversal. If today’s candle confirms this, it will further support the continuation of wave Y.
H4:
H4 momentum has turned downward, so the expectation for today remains bearish movement.
H1:
H1 momentum is preparing to turn upward, suggesting a small corrective bounce. However, in the current context, price is likely to remain sideways within the 4046 – 4081 range.
________________________________________
2. Wave Structure
D1 – Higher timeframe
With D1 momentum preparing to turn down, the continuation of wave Y is reinforced.
But since momentum is near the oversold zone, two potential scenarios may unfold:
1️⃣ Strong decline:
A sharp drop may break 3888, opening the way toward deeper targets such as 3746.
2️⃣ Weak decline – Compression:
Price may continue down but fail to break 3888.
Once momentum turns upward again, a new trend could form.
________________________________________
H4 – Pattern outlook
The H4 structure remains unclear—price may still be in wave (3) or wave (2).
• If it is wave (3), strong bearish candles or a test of 4001 should appear.
• If price keeps moving sideways without breaking 4001 until H4 momentum reaches oversold, the current move is likely wave B of an ABC correction inside wave 2.
Based on the current depth of wave B, wave C is estimated to target 4175.
________________________________________
H1 – Lower timeframe
Wave 2 (green) is taking longer than ideal, but not enough to invalidate the current labeling.
The 4081 resistance is very strong and serves as our sell zone.
Below, the 4020 support is equally important:
• A sharp decline with H1 closing below 4020 may trigger a larger bearish continuation.
• Typically, price reacts with a bounce when it first touches this area.
________________________________________
3. Trade Plan
Sell Zone: 4073 – 4075
SL: 4093
TP1: 4020
TP2: 3958
TP3: 3885

Gold (XAU/USD) 2H Chart Analysis – Sell Setup from High ProbabilBased on the chart you provided, Gold is currently reacting near a High Probability POI (supply zone) after a corrective bullish move. The structure still shows:
Lower highs and lower lows → Bearish market structure
Price is approaching a supply zone where sellers previously dominated
Liquidity has been taken above internal highs (marked as "$$$"), indicating a liquidity grab
This supports a short position idea from the supply zone.
🔍 Key Technical Levels
Zone / Level Meaning
4,125 – 4,150 USD High Probability POI / Supply (Sell area)
4,080 – 4,100 USD Entry region (price is currently here)
4,040 – 4,025 USD First reaction / partial take zone (50% area)
3,990 – 4,000 USD Main Target (previous demand + equal lows)
🎯 Suggested Target
Primary Target: $4,000
(Exactly aligning with your chart’s marked “TARGET” zone where liquidity sits)
If momentum continues and structure breaks more aggressively:
Extended Target: $3,975 – $3,960
(deeper sweep into demand)
🛑 Risk Management
Detail Level
Stop Loss Above 4,155 USD (beyond POI + liquidity)
R:R Potential Approx. 1:3 to 1:4
📌 Summary
Price has retraced into a key supply zone
Liquidity was taken → seller confirmation likely
Expectation is continuation downward towards the liquidity pool below
📊 Title Recommendation:
“Gold Retests Supply Zone – Bearish Continuation Toward $4,000 Expected”

#XAUUSDPlease stick to your strategies
Any resistance will lead to big losses
Never take revenge on the market if a loss is triggered
Close the trade if the channel ceiling is broken

Gold XAUUSD – Fresh Resistance Tested Twice, Bears Eye 4057 PullGold gave us a clean reaction today, rejecting the 4107–4110 supply zone not once, but twice. That double tap reinforced a fresh resistance band at 4087–4095, where sellers stepped back in with intention.
As long as 4012 holds on the upside, this resistance zone remains my short-term line in the sand. Any push back into 4087–4095 may attract renewed selling pressure, keeping the door open for a move toward 4057, with momentum potentially extending lower if sellers stay in control.
I’ll be watching how price behaves on each revisit—structure remains king.
Your feedback drives our content and keeps everyone trading smarter. Let’s make those pips together! 🚀
Happy Trading,
– The InvestPro Team

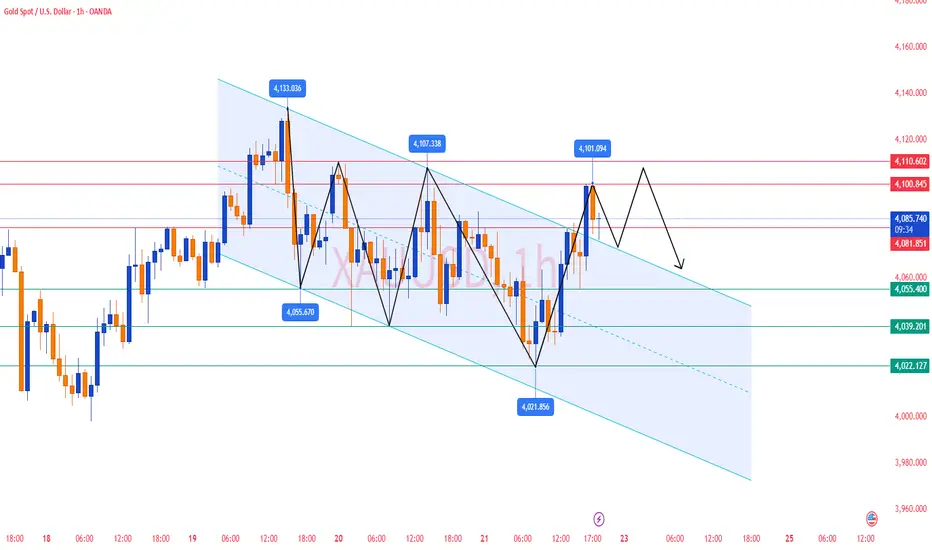
LiamTrading – XAUUSD H1 | Gold breaks bullish structure...LiamTrading – XAUUSD H1 | Gold breaks bullish structure, short-term downside takes control
Gold has dropped sharply by more than $20 in a short time, losing over 1% on the day and moving close to the lower 4,030 area. The previous bullish structure has officially been broken, 4040 failed to hold, and today’s focus continues to be selling with the trend until the 4000–398x support zone shows clear reactions.
Macro Analysis
Gold prices declined as expectations for a December rate cut weakened: JPMorgan no longer forecasts a Fed rate cut in December, opposite to their earlier 25 bps cut scenario.
Some institutions still believe rising unemployment and weaker economic data may force the Fed to cut 25 bps at the upcoming meeting.
The market is currently pricing the probability of a December rate cut at nearly “50–50,” creating strong uncertainty and putting short-term pressure on gold, even though the metal still benefits in the long term if the rate-cut cycle begins.
Technical Analysis H1 – Bearish structure, price channel, and support zones
After breaking below 4040, price formed a series of Lower Highs – Lower Lows, confirming a Dow-theory bearish structure on H1.
A falling channel is forming; the channel’s upper boundary aligns with the short-term resistance zone at 4050–4060.
4000 zone: a key psychological support. If broken decisively, the medium-term structure may shift into a deeper corrective phase.
Buy Zone 3987–3989
Strong support confluence + Fibonacci extensions (1.618/2.272) of the current bearish swing
Optimal area for catching a corrective bounce if clear reversal signals appear
Key Resistance Levels Today
4052–4054: retest of former support + upper boundary of falling channel → ideal area for a pullback-sell setup.
Trading Scenarios Today (LiamTrading)
Scenario 1 – SELL with the prevailing downtrend (priority)
Entry: 4052–4054
SL: 4060
TP: 4030 → 4015 → 3990
Logic: Price retraces to resistance + channel top, suitable for trend-continuation selling. Prefer setups where M15 shows rejection candles (pin bar/bearish engulfing) around 405x.
Scenario 2 – BUY at strong support 398x (counter-trend bounce)
Entry: 3987–3989
SL: 3980
TP: 3999 → 4014 → 4040 → 4080
Logic: 398x is a high-confluence support zone; trigger only when clear price reaction appears (long lower wicks or reversal patterns on M15–H1).
This is counter-trend, so use smaller position sizes and take partial profits.
Risk Notes & Invalidation
H1 closes above 4060: short-term bearish structure weakens → pause all sell setups and reassess.
H1 closes below 3980: buy zone fails → downside could extend further; only sell setups preferred.
Always keep risk per trade at 0.5–1%, and once reaching +1R, move SL to break-even.
Are you leaning towards continuing to sell with the trend, or waiting to buy the dip at 398x?
Follow LiamTrading on TradingView for daily XAUUSD updates

XAUUSD Bullish Retracement Setup from Support Zone Toward Key Re1. Market Structure
Price is currently trading near a major support zone (~4055–4060 area), highlighted in blue.
Multiple rejections from this zone in the past indicate strong buying interest.
The structure shows higher lows forming intraday, suggesting bullish pressure building.
2. Key Zones
🔵 Support Zone (Entry Region)
Marked around 4055–4060.
Price dipped into this zone and bounced, showing a potential demand area for long positions.
🔵 Resistance Level (First Target Region)
Around 4081–4098.
This is the first major resistance the price is likely to test after bouncing.
🔵 Final Target Zone
4120 area, the upper major resistance.
Previous highs around this level show strong selling interest historically.
3. Expected Price Movement
The chart suggests a potential bullish move:
Price bounces from the support (entry) area.
Climbs toward 4081 (minor resistance).
Retraces slightly.
Continues upward toward 4097–4100.
Final push toward 4120 target zone.
This is a classic retracement + continuation bullish structure.
4. Trade Idea
Bias: Bullish
Entry: 4055–4060 (support zone)
First TP: 4081
Second TP: 4097–4100
Final Target: 4120
Stop Loss: Below 4050 (beneath support zone)


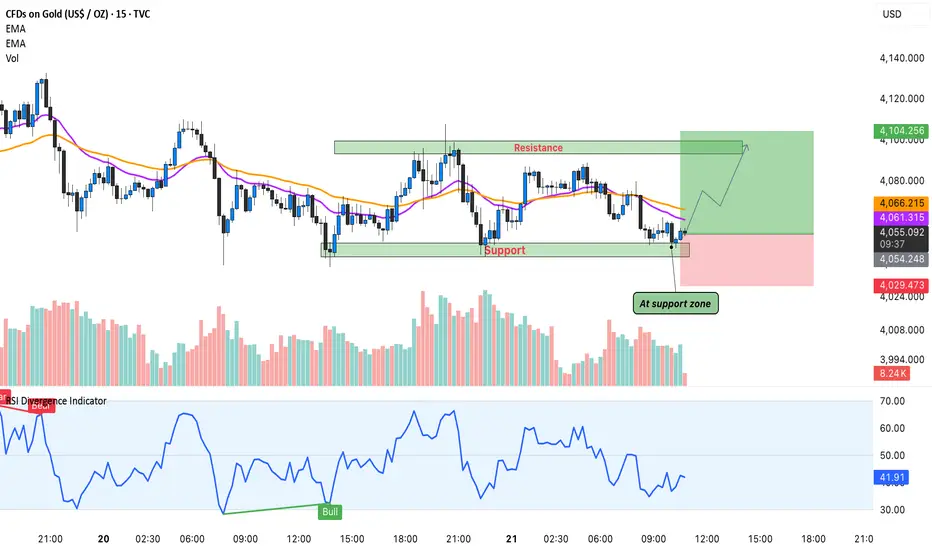
Gold’s Intraday Reversal – Buyers Stepping In!Hello Guy's Let's analyse Gold and it is once again respected the intraday support zone highlighted on the chart. This level has acted as a strong demand area multiple times, and today price reacted from the same zone with clear bullish intent.
Price is also sitting above EMA 20 & EMA 50, and the RSI bullish divergence confirms that momentum could be shifting back toward the upside.
If buyers hold this support, we can see a short-term push toward the 4,090–4,105 resistance region. A clean breakout above that may open more upside, but for now the focus remains on this bounce setup.
This is not breakout trading, this is simply reacting to a level where buyers have shown strength many times.
As long as this support holds, the risk-reward favors the bullish side.
Analysis By @TraderRahulPal | More analysis & educational content on my profile.
GOLD REVERSAL AREA GOLD will reverse from this area for sure if you see any CHoCH in these level in 5MIn hold it till bottom

Trade Journal Missed trade XAUUSD SellNamaste 🙏 everyone
What hurts more than missing an A+ setup?
Many other things, life is beyond trading lol
Ok so this was a clean setup,
We were in a daily bearish FVG on gold and we had smt betweengold and silver at London highs.
Easy setup, enter at change in State and target 1 to 2 RR, I mean it doesn't get easier than this.

Gold Trading Strategy for 20th November 2025🟡 GOLD INTRADAY LEVELS – 30-Min Strategy
📈 BUY SETUP (Long Position)
🔸 Entry Condition:
Buy above the High of the 30-min candle after price closes above $4122.
💰 Targets:
🎯 $4132
🎯 $4145
🎯 $4160
📌 Notes for Traders:
Wait for a strong bullish candle close above $4122 to confirm the breakout.
Ideal if volume increases as the breakout happens.
Keep the trendline/market structure in view before executing.
📉 SELL SETUP (Short Position)
🔻 Entry Condition:
Sell below the Low of the 30-min candle after price closes below $4056.
💰 Targets:
🎯 $4044
🎯 $4032
🎯 $4018
📌 Notes for Traders:
Look for a strong bearish candle close below $4056.
Breakdown is more reliable if accompanied by increasing selling pressure.
Always confirm with momentum indicators (RSI, MACD, etc.) if possible.
⚙️ Risk Management (Highly Recommended)
🔒 Use Stop-Loss just below breakout candle for buys / above breakdown candle for sells.
📏 Risk–Reward ratio: Minimum 1:2.
💼 Avoid over-leveraging; trade only with allocated risk capital.
⚠️ Disclaimer
This information is provided only for educational and informational purposes.
It is not financial advice, and trading in gold or any financial instrument involves high market risk.
Always consult your financial advisor and trade at your own discretion.

Part 3 Learn Institutional Trading Option Buyers
Pay premium.
Have limited risk (premium loss).
Have unlimited profit potential (in theory).
Bet on directional moves.
Option Sellers (Writers)
Receive premium upfront.
Have limited reward (premium earned).
Can face significant or unlimited risk.
Bet on time decay, sideways markets, or low volatility.

LiamTrading – XAUUSD H1 | Gold breaks bullish structure...LiamTrading – XAUUSD H1 | Gold breaks bullish structure, short-term downside takes control
Gold has dropped sharply by more than $20 in a short time, losing over 1% on the day and moving close to the lower 4,030 area. The previous bullish structure has officially been broken, 4040 failed to hold, and today’s focus continues to be selling with the trend until the 4000–398x support zone shows clear reactions.
Macro Analysis
Gold prices declined as expectations for a December rate cut weakened: JPMorgan no longer forecasts a Fed rate cut in December, opposite to their earlier 25 bps cut scenario.
Some institutions still believe rising unemployment and weaker economic data may force the Fed to cut 25 bps at the upcoming meeting.
The market is currently pricing the probability of a December rate cut at nearly “50–50,” creating strong uncertainty and putting short-term pressure on gold, even though the metal still benefits in the long term if the rate-cut cycle begins.
Technical Analysis H1 – Bearish structure, price channel, and support zones
After breaking below 4040, price formed a series of Lower Highs – Lower Lows, confirming a Dow-theory bearish structure on H1.
A falling channel is forming; the channel’s upper boundary aligns with the short-term resistance zone at 4050–4060.
4000 zone: a key psychological support. If broken decisively, the medium-term structure may shift into a deeper corrective phase.
Buy Zone 3987–3989
Strong support confluence + Fibonacci extensions (1.618/2.272) of the current bearish swing
Optimal area for catching a corrective bounce if clear reversal signals appear
Key Resistance Levels Today
4052–4054: retest of former support + upper boundary of falling channel → ideal area for a pullback-sell setup.
Trading Scenarios Today (LiamTrading)
Scenario 1 – SELL with the prevailing downtrend (priority)
Entry: 4052–4054
SL: 4060
TP: 4030 → 4015 → 3990
Logic: Price retraces to resistance + channel top, suitable for trend-continuation selling. Prefer setups where M15 shows rejection candles (pin bar/bearish engulfing) around 405x.
Scenario 2 – BUY at strong support 398x (counter-trend bounce)
Entry: 3987–3989
SL: 3980
TP: 3999 → 4014 → 4040 → 4080
Logic: 398x is a high-confluence support zone; trigger only when clear price reaction appears (long lower wicks or reversal patterns on M15–H1).
This is counter-trend, so use smaller position sizes and take partial profits.
Risk Notes & Invalidation
H1 closes above 4060: short-term bearish structure weakens → pause all sell setups and reassess.
H1 closes below 3980: buy zone fails → downside could extend further; only sell setups preferred.
Always keep risk per trade at 0.5–1%, and once reaching +1R, move SL to break-even.
Are you leaning towards continuing to sell with the trend, or waiting to buy the dip at 398x?
Follow LiamTrading on TradingView for daily XAUUSD updates

XAU/USD: Gold's Final Correction Before a Strong Rebound📊 Market Structure – Elliott Wave + SMC
Gold has completed impulse wave 1–5 at the peak of 4,207 USD and is entering an Elliott correction phase in the form of ABC .
Wave A : bottomed at Demand Zone 4,008 – 4,020 USD
Wave B : retraced upwards, creating consecutive Equal Highs and small BoS but has not broken the larger structure
Wave C : is forming, may extend down to the Demand Zone if the price loses 4,030
SMC signals reinforce the scenario of a completed correction:
A series of Equal Lows → the market still has liquidity below to "sweep" towards the Demand Zone
The area BoS – 4,076 is the decisive structure: if not broken upwards, the correction trend continues
The area FVG + Resistance 4,152 USD is the target for a major retracement wave after completing wave C
=> In summary: the market is in the final phase of correction. Once wave C is completed, gold is likely to rebound strongly in the larger trend.
💎 Key Technical Zones
🔹 Demand Zone – Main BUY area
4,008 – 4,020 USD
→ Strong Demand confluence + Elliott wave C + liquidity below.
→ High probability of reversal.
🔹 Reaction Zone – Temporary reaction area
4,030 – 4,040 USD
→ If the price retraces early but hasn't swept the bottom → the correction may still continue.
🔹 Supply & FVG Zones (Strong resistance)
4,152 – 4,207 USD
→ Main target of the retracement wave after the ABC pattern is completed.
🎯 Trading Plan – Vincent’s Execution Map
1️⃣ BUY Setup – According to Wave C (top priority)
Wait for the price to complete wave C at the Demand Zone:
Entry: 4,012 – 4,020
SL: below 3,984
TP1: 4,076
TP2: 4,128
TP3: 4,152
TP4: 4,207
→ This is the main setup of the day, confluence of both SMC + Elliott.
2️⃣ BUY Aggressive – Early buy according to Break of Structure
If the price breaks BoS 4,076 before reaching Demand:
Entry: 4,070 – 4,076
SL: 4,040
TP: 4,128 – 4,152 – 4,207
→ Setup for those who want to catch the impulsive wave early.
3️⃣ SELL Scalp – Small trend (not the main trade)
Only enter when the price retraces to Fibo:
Entry: 4,092 – 4,106
SL: 4,116
TP: 4,040 → 4,020
→ Short-term scalp, aiming to complete wave C.
🧠 Vincent’s View
The overall trend still leans towards Bullish Reversal after correction.
As long as the price holds Demand Zone 4,008 – 4,020 , gold can rebound strongly back to the target of 4,152 – 4,207.
“Liquidity always shows the way – patience is the real advantage.” ⚜️
⏰ Timeframe: 1H
📅 Updated: 21/11/2025
✍️ Analyzed by: Captain Vincent

Advanced / Premium-Level PatternsWhy Chart Patterns Work Universally
Human psychology doesn’t change.
Market cycles repeat.
Patterns reflect economic behaviour.
Institutional buying/selling creates recognizable structures.
Liquidity zones attract predictable reactions.

The Gold Bullish Setup You Can't Miss!OANDA:XAUUSD The price is clearly approaching a critical support zone, one that has previously triggered positive reactions in the market. This zone also aligns closely with the psychological level of $4,000, which tends to capture the market’s full attention.
Given the current momentum, there’s a strong possibility that buyers will step in and push prices higher. A confirmation, such as a solid rejection pattern, a bullish engulfing candle, or a long lower shadow, would significantly increase the likelihood of a rebound. If my analysis proves accurate, and buyers regain control, we could see the price rise to around $4,070.
However, if the price breaks below this key support, it would negate the bullish outlook and could lead to further declines.
Please note, this is not financial advice!

Gold Analysis & Trading Strategy | November 20-21✅ From the 4-hour chart, gold remains in a weak, downward-biased consolidation structure after yesterday’s failed rally.
1️⃣ Moving averages show a bearish setup
MA5 and MA10 have formed a bearish crossover and continue to slope downward, indicating that short-term bearish momentum still dominates.
MA20 (around 4082–4088) acts as strong resistance; price has repeatedly failed to break above it, showing weak rebound strength.
2️⃣ Bollinger Bands indicate weakness
The Bollinger middle band (around 4069) continues to suppress the price; the latest candles remain below it — a classic weak consolidation pattern.
The lower band (around 4014) remains the next downward target.
3️⃣ Rebound attempts fail
Multiple attempts to break above 4088–4090 failed, creating a short-term top structure.
The recent rebound also failed to break above the moving averages, showing continued lack of bullish momentum.
➡️ H4 Conclusion: The structure remains bearish. As long as price stays below 4090, the market bias remains to the downside.
✅The 1-hour chart confirms the same bearish structure:
1️⃣ Clear downward channel
After topping at 4132, gold dropped sharply to 4038, then rebounded to 4068–4070 and faced renewed selling pressure.
MA5 / MA10 / MA20 / MA60 are again aligned in a bearish formation.
2️⃣ Rebound momentum is weak
The latest rebound only reached MA10–MA20 before turning down again, showing strong selling pressure.
Key resistance remains at 4070–4085; breaking above this area is unlikely.
3️⃣ Key support at 4044–4038
This zone has shown short-term buying interest but lacks strength.
A break below this region will open the path toward 4015–4008.
➡️ H1 Conclusion: Weak short-term structure with limited rebound strength. More downside tests toward 4044–4038 remain likely.
🔴 Resistance Levels
4070–4085
4100–4110
4132
🟢 Support Levels
4044–4038
4015–4008
3997
✅ Trading Strategy Suggestions
🔰 Strategy 1: Sell the Rebound (Main Plan)
If gold rebounds to 4070–4085 and faces rejection:
➡️ Enter light short positions
SL: 4090
Targets: 4055 / 4044 / 4035
👉 This is the highest-probability strategy under current conditions.
🔰 Strategy 2: Strong Resistance Short (Aggressive)
If gold reaches 4100–4110:
➡️ Use medium position shorts
SL: 4120
Targets: 4065 / 4045
👉 Strong resistance zone; breakout probability is low.
🔰 Strategy 3: Breakout Short Below Support
If gold breaks 4044–4038:
➡️ Follow the trend with breakout shorts
Targets: 4015 / 4000
👉 Loss of this zone will open further downside.
📌 Summary
Both H4 and H1 remain in a weak bearish structure.
Rebounds lack momentum and are consistently pressured by moving averages.
4044–4038 is the key support; if broken, the downtrend will accelerate.
Recommended approach today:
Sell rebounds as the primary strategy
Buy dips only at strong support levels (around 4038)
