Gold Analysis and Trading Strategy for next week✅ Recently, gold has repeatedly shown sharp one-sided moves, with several swings exceeding $80 in both directions this week, forming typical V-shaped reversals. Friday’s rapid decline reflected heavy short-term profit-taking at the highs, signaling that the market has entered a strong corrective consolidation phase.
✅ 4-Hour Chart:
After peaking at 4379.52, gold pulled back sharply and is now trading below the Bollinger mid-band, stabilizing around 4230–4250.
🔹Moving Averages: MA5 and MA10 have formed a bearish crossover, and MA20 has begun to turn down, showing short-term weakness; MA60 and MA120 remain upward-sloping, indicating that the medium- to long-term structure is still bullish.
🔹Bollinger Bands: Upper band near 4364, middle at 4237, lower at 4111. Price is oscillating below the mid-band; failure to reclaim it could lead to a test of the 4110–4150 zone.
Overall, gold is in a high-level correction phase dominated by short sellers. Unless it can hold above 4237, further testing of 4180–4150 remains likely.
✅ 1-Hour Chart:
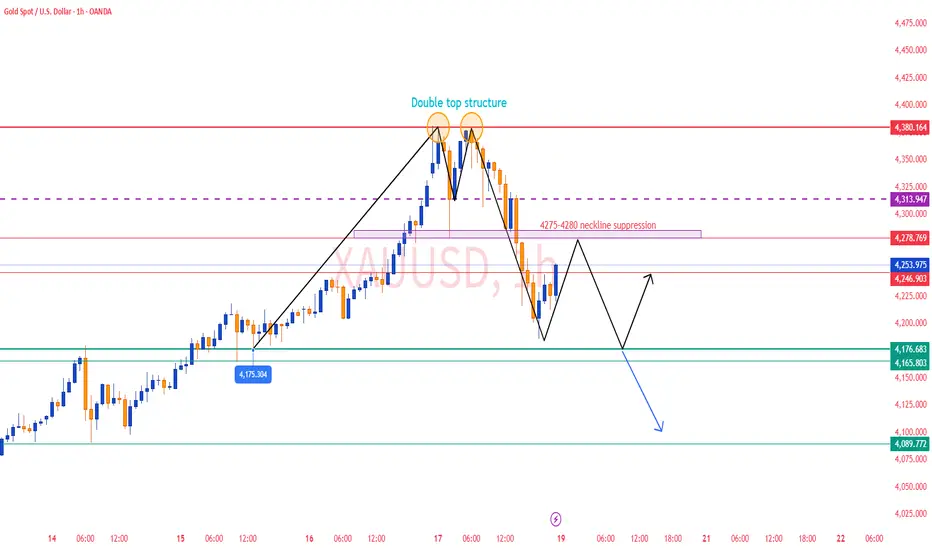
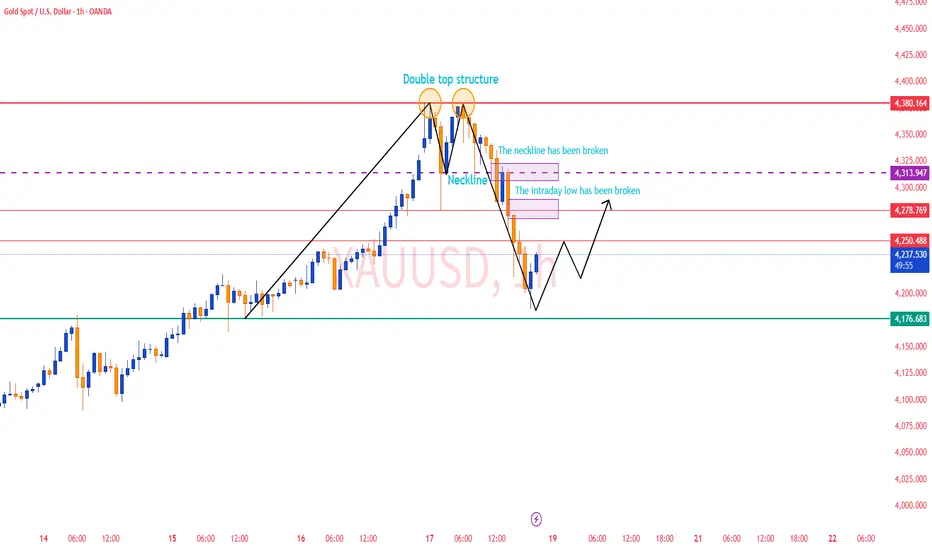
After retreating from the 4379.52 high to a 4186.62 low, gold saw a weak rebound capped near 4240, forming a classic double-top around 4379. The short-term trend has turned bearish, and the 4280 region now acts as key resistance.
🔴 Resistance Levels: 4275–4280 / 4300
🟢 Support Levels: 4180–4160 / 4090
✅ Trading Strategy Reference:
🔰 If the price rebounds to 4275–4280 and faces resistance, consider light short positions with targets at 4180–4160, stop loss above 4300.
🔰 If the price dips to around 4175–4180 and stabilizes, consider cautious long entries with targets at 4250–4270, stop loss below 4160.
📊 Summary:
Gold’s short-term trend remains weak, representing a technical correction after a strong rally. As long as 4160–4180 support holds, the medium-term bullish structure remains intact. Failure to break above 4280–4300 will keep the market in a weak consolidation phase, with secondary support around 4110–4090.
Trade ideas
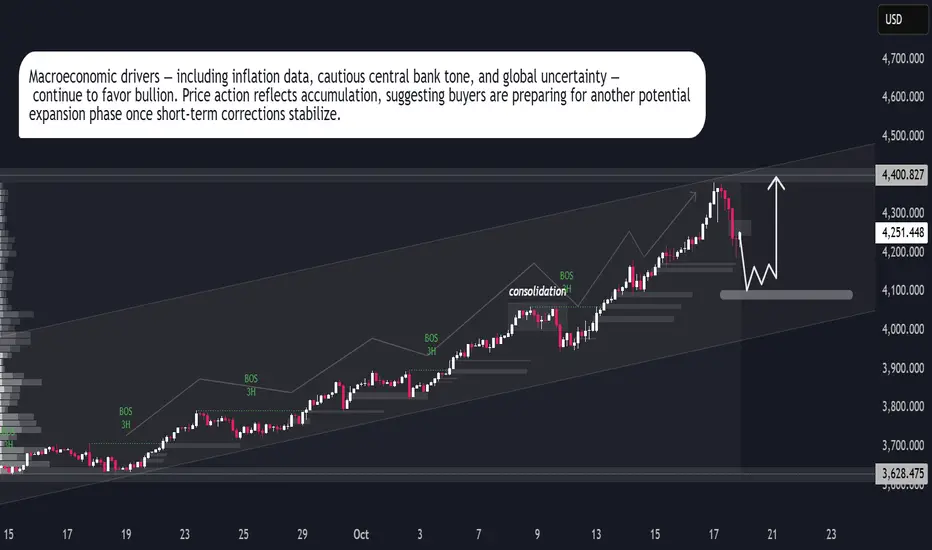
Gold Price Outlook | Buyers Stay in Full ControlGold remains firmly positioned within its broader bullish trajectory, supported by consistent demand from both institutional and retail investors. The market has shown strong resilience, forming a well-defined higher-low structure, which reflects continued accumulation. Price action indicates that buyers are confidently stepping in after each controlled pullback, maintaining upward momentum.
The current market tone favors continuation toward the 4,180–4,250 range if momentum persists. Short-term retracements into the 4,070–4,090 area may offer new buying opportunities for position traders aligning with the prevailing trend. Macroeconomic factors such as ongoing inflation concerns, geopolitical instability, and cautious monetary policy stance continue to underpin gold’s strength.
XAUUSD/GOLD WEEKLY SELL PROJECTION 19.10.25(XAUUSD/GOLD 4H Weekly Sell Projection — 19.10.25):
🟡 Chart Overview
Instrument: XAUUSD (Gold/USD)
Timeframe: 4H (4-hour)
Projection: Bearish/Sell
Pattern Date: 19 October 2025
📊 Key Technical Structure
Trend Channel:
The price has been moving in an upward trend channel.
It reached the upper boundary near the 4,448.371 level (All-Time High/Resistance R2).
Reversal Formation:
A Three Black Crows candlestick pattern is formed at the top — a classic bearish reversal signal indicating potential downtrend continuation.
Strong Bearish Momentum followed this pattern.
Breakout Zone:
Price broke below the ascending channel.
“Breakout Zone Retest & Obey” suggests the price tested the previous support as new resistance.
Support & Resistance Zones:
R2 / ATH: 4,448.371
R1 / Fair Value Gap: ~4,281.132
Last Week Low Support S1: ~4,175–4,225 zone
Support S2: ~4,093.117
Potential final target around the lower support zone.
📉 Trade Projection
Entry Zone: Around 4,281–4,321 (after retest confirmation).
Stop Loss: Above 4,321 (previous resistance area).
Take Profit Target: ~4,093 (Support S2 zone).
Risk/Reward: Favorable short setup if bearish momentum continues.
🧭 Additional Notes
“Three Black Crows” near the ATH level adds high probability for a deeper retracement.
If support at 4,175 breaks cleanly, continuation to 4,093 is expected.
Watch for lower-high formations confirming the bearish structure.
A failure to break S1 may lead to a short-term range or bullish pullback.

XAU/USD: Channel Breakout → Retest → Downside Target at 3,940Pair: Gold Spot (XAU/USD)
Timeframe: 1-hour
Current Price: 4,253.975
Trend: Recently broke out of an ascending channel (bearish signal)
📉 Chart Breakdown
1. Ascending Channel (Trade Lines)
Price was moving steadily inside a rising channel, indicated by the two parallel yellow “TRADE LINE” levels.
The break below the lower trade line suggests weakening bullish momentum and potential trend reversal.
2. Resistance Level (4,320 – 4,360 zone)
Marked in purple, this zone served as a key resistance.
Price rejected strongly from this area, confirming seller presence.
3. Structure Retest and Potential Move
After the channel break, price retraced back to retest the broken channel support (now resistance).
The projected blue path shows a lower-high formation followed by a new drop, completing a bearish continuation pattern.
4. Target Zone
The projected target is near 3,940.693, aligning with previous structure support.
This level could serve as a profit-taking area for short positions.
📊 Summary of Key Levels
Zone Type Range / Level
4,320 – 4,360 Resistance Strong supply zone
4,220 – 4,240 Retest zone Potential short entry area
3,940 Target Bearish target / demand zone
⚙️ Trading Plan Concept (Hypothetical)
Bias: Bearish
Entry Idea: Wait for rejection from 4,220–4,240 zone.
Stop Loss: Above 4,280 (resistance)
Take Profit: Around 3,940 (target)
Risk/Reward: Approximately 1:3 or better
🧭 Conclusion
The chart suggests that Gold (XAU/USD) might be entering a corrective bearish phase after failing to sustain its bullish channel. A retest of broken structure before another drop aligns with typical market structure behavior. EURONEXT:AXFZ2025 EURONEXT:FMXX2025 EURONEXT:QL6X2025 EURONEXT:RH6X2025 EURONEXT:VV8Z2025 EURONEXT:2FTX2025

Part 4 Learn Institutional TradingOption Premium and Its Components
The premium is the price paid to acquire an option contract. It consists of two parts: intrinsic value and time value. Intrinsic value reflects the actual profitability if exercised immediately, while time value represents the potential for further profit before expiry. Several factors influence premiums—especially implied volatility (IV), time to expiration, and interest rates. Higher volatility generally increases premiums since potential price swings make the option more valuable. Traders analyze these components using models like Black-Scholes to determine fair value. Understanding premium behavior helps in selecting the right option strategy, whether to buy undervalued options or sell overvalued ones.

GOLD 1H Analysis for 20th October 2025 MondayThe 1H trend has shifted to bearish. The current price is above the 1H QML and has retested the 1H SBR zone.
The price is currently positioned in two areas: 1) Supply Zone and 2) Double Top.
The outcome of the market will be determined on Monday.

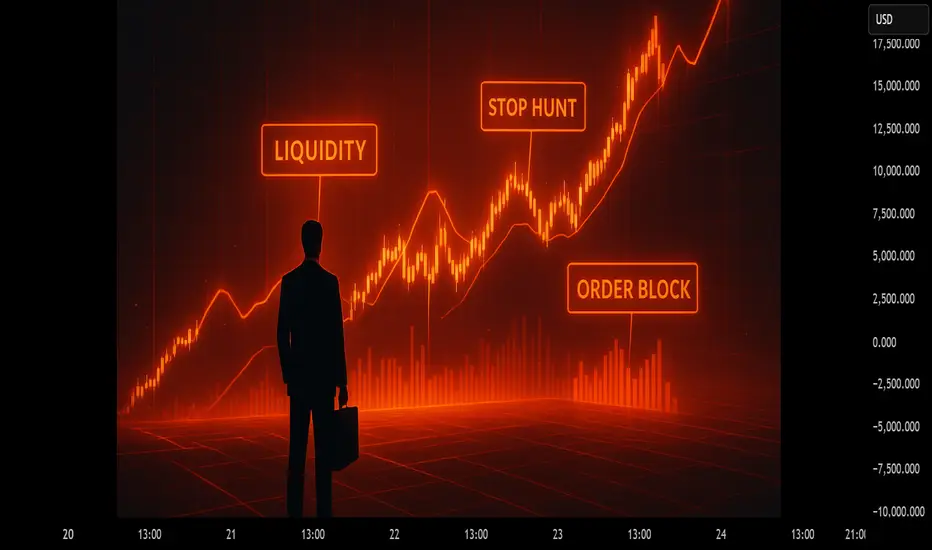
How Smart Money Hunts Liquidity on Gold🔶 1. Understanding Liquidity in the Market
Liquidity represents the orders resting above or below obvious price levels — mainly stop-losses and pending orders placed by retail traders.
In simple terms, where you see equal highs, equal lows, or strong swing points, that’s where liquidity pools exist.
On Gold (XAUUSD), because of its volatility, liquidity often accumulates near:
Double tops or double bottoms.
Previous day highs/lows.
Fair value gaps (imbalances).
Psychological round levels like $2300, $2350, $2400, etc.
These zones attract both buyers and sellers — and that’s exactly where Smart Money (institutional traders) aims to act.
🔶 2. What Smart Money Actually Does
Smart Money doesn’t follow retail moves — it creates them.
When price consolidates and retail traders position themselves early, institutions push price beyond these zones to:
Trigger retail stop losses.
Fill their own large institutional orders at better prices.
Remove weak hands from the market.
This process is called a Liquidity Hunt or Stop Hunt.
It’s not manipulation in a malicious sense — it’s simply how large players execute size efficiently in a decentralized market.
🔶 3. The Classic Gold Liquidity Hunt Pattern
Let’s break down a typical Smart Money setup on XAUUSD:
Step 1:
Price builds equal highs (or equal lows) — retail traders see it as a breakout zone.
Step 2:
Institutions push price slightly beyond that area, creating a false breakout.
Stop-losses of early traders are triggered — this is the liquidity grab.
Step 3:
Immediately after the sweep, structure shifts (Change of Character / CHoCH).
This confirms that Smart Money has completed its collection phase and is now ready to move price in the intended direction.
Step 4:
Price often retraces back into the order block or fair value gap left behind by displacement.
This is where the high-probability entry lies — the Smart Money entry point.
🔶 4. Why Gold (XAUUSD) Shows This So Clearly
Gold is one of the most liquid and manipulated markets on the planet — ideal for studying Smart Money behavior.
Because it trades heavily during London and New York sessions, liquidity is constantly generated and removed.
This is why you’ll frequently see:
Sudden spikes before major sessions open.
Sharp sweeps before news events (CPI, NFP, FOMC).
Rapid reversals after stop-hunts.
Institutions use gold as a liquidity engine, often hunting both sides of the market before the real move.
🔶 5. How to Identify a Real Liquidity Hunt (Checklist)
Use this professional checklist to train your eye:
✅ Look for equal highs/lows forming before the move.
✅ Wait for a stop-hunt candle — a long wick piercing liquidity zone.
✅ Confirm a market structure shift (MSS or CHoCH) in lower timeframe.
✅ Entry only after displacement and a clean retracement into an order block.
Avoid reacting emotionally to every breakout — Smart Money uses time + patience to trick impulsive traders.
🔶 6. Practical Educational Example
Suppose Gold forms equal highs at $2380 during the London session.
Many retail traders place buy stops above $2380 expecting a breakout.
Institutions see that as a liquidity pool.
Price suddenly spikes to $2385, sweeps those buy stops, and then drops to $2360 — that’s your liquidity hunt.
Once the structure shifts bearish after the sweep, Smart Money has filled sell orders at a premium — and the downtrend resumes.
🔶 7. Educational Takeaway
Smart Money doesn’t predict — it reacts to liquidity.
By understanding where traders are trapped, you align your trades with institutional flow instead of retail emotion.
📘 Key Principles:
Trade after the liquidity grab, not before.
Always wait for confirmation through structure shift.
Focus on zones of interest, not random breakouts.
Observe timing — most liquidity hunts occur during session opens or high-impact news.
💬 Final Note:
Every chart tells a story — but only those who understand liquidity can read the true language of price.
Study it, practice it, and you’ll see how Smart Money creates opportunity through manipulation and order flow.
📘 Follow me for more professional educational content on Smart Money, Liquidity, and Gold market behavior.
Option Trading Strategies Option Premium and Its Components
The premium is the price paid to acquire an option contract. It consists of two parts: intrinsic value and time value. Intrinsic value reflects the actual profitability if exercised immediately, while time value represents the potential for further profit before expiry. Several factors influence premiums—especially implied volatility (IV), time to expiration, and interest rates. Higher volatility generally increases premiums since potential price swings make the option more valuable. Traders analyze these components using models like Black-Scholes to determine fair value. Understanding premium behavior helps in selecting the right option strategy, whether to buy undervalued options or sell overvalued ones.

PCR Trading Strategies The Role of the Strike Price and Expiry Date
Each option contract includes a strike price and an expiry date. The strike price determines the level at which the asset can be bought or sold, while the expiry date sets the time limit. The relationship between the strike price and the market price determines whether an option is in-the-money (ITM), at-the-money (ATM), or out-of-the-money (OTM). As expiry nears, the option’s time value decreases—a concept known as time decay. Short-term options lose value faster, while long-dated ones retain time premium longer. Successful option traders always monitor how close prices are to the strike and how much time remains to expiry before making or exiting trades.

Unlock Trading Secrets1. Start with the right mindset
The single biggest secret is mindset. Markets are a probabilistic environment where losses are inevitable. Embrace uncertainty: every trade is a bet with an expected value (EV), not a promise. Detach ego from outcomes. Trade plans should guide actions, not emotions. Treat trading like a business: document processes, measure performance, and pay attention to costs (commissions, slippage, taxes).
2. Edge — your repeatable advantage
Edge is what separates gamblers from consistent traders. It could be a proprietary indicator, a superior way to read order flow, or simply disciplined risk management that lets you survive losing streaks. To build an edge:
Specialize. Pick one market (e.g., Nifty futures, EUR/USD, crude) and a timeframe. Mastering a smaller universe increases pattern recognition.
Quantify your hypothesis. Transform an idea into measurable rules. For example: “Buy when 20-day EMA crosses above 50-day EMA and RSI < 60.”
Backtest and forward-test. Check your rules across historical data and live paper trading to confirm they weren’t luck or overfitting.
3. Risk management is the backbone
Most traders who fail didn’t lose because their ideas were bad — they lost because one loss (or series of losses) wiped out gains. Core rules:
Risk per trade: Never risk more than a small percentage of capital on a single trade (commonly 0.5–2%).
Position sizing: Calculate size using stop-loss distance and acceptable risk amount. Position size = (Account Risk in ₹ or $) / (Stop distance × value per pip/point).
Diversify risks: Avoid putting all capital into correlated positions.
Use stop-losses: A logical stop is cheap insurance — accept small losses to avoid catastrophic ones.
4. Strategy types and when to use them
There’s no single winning strategy. Here are common families you can choose from and mix:
Trend following: Ride big moves using moving averages, breakouts, or momentum. Works best in trending markets and often needs larger stops and patience.
Mean reversion: Trade overreactions — fade extreme moves with tight stops and quick profit targets. Works in range-bound markets.
Breakout trading: Enter when price breaks a consolidation area. Can be explosive but prone to false breakouts.
Order-flow / tape-reading: Advanced; uses real-time market microstructure to detect large institutional flow.
Algorithmic/quantitative: Rules-based strategies executed automatically. Reduce emotional errors but require robust testing.
Select a style that matches your temperament: scalping for fast-paced focus, swing trading for part-time traders, trend-following for long-term discipline.
5. Technical and fundamental analysis — use both wisely
Technical analysis helps with entries and exits; fundamental analysis explains why trends exist. For many traders, a hybrid approach works best:
Technicals: Price action, support/resistance, volume, trend indicators, chart patterns.
Fundamentals: Earnings, macro data, central bank moves, inventory reports. Use fundamentals to bias direction for longer-horizon trades.
Don’t overcomplicate: prefer a few high-confidence tools over a dashboard of conflicting indicators.
6. Execution — rules for entry, management, and exit
A defined execution plan turns ideas into consistent actions.
Entry rules: Specify the setup, confirmation, and exact price for entry (market, limit, or stop).
Trade management: Decide pre-trade whether you’ll scale in/out, move stops to breakeven, or trail the stop. Avoid changing plans mid-trade because of emotions.
Exit rules: Define targets and stop levels. Some traders use risk:reward ratios (e.g., 1:2 or 1:3) while others use technical levels (support/resistance).
7. Psychology — master the inner game
Fear and greed are the twin devils. Common psychological traps:
Revenge trading: Trying to win back losses by increasing risk.
Averaging down: Increasing size into losing trades without reason.
Overconfidence after wins: Increasing risk after a streak.
Countermeasures: stick to a trading plan, enforce risk limits automatically, take regular breaks, and use objective measures (like a pre-trade checklist) to keep emotions out of the loop.
8. Backtesting and data hygiene
Ideas must survive rigorous testing:
Clean data: Use reliable historical data with dividends, splits, and corporate actions corrected.
Avoid look-ahead bias: Ensure your backtest only uses information that would have been available at the time.
Out-of-sample testing: Reserve a portion of data for validation to avoid overfitting.
Monte Carlo and stress tests: Estimate how strategies perform across different sequences of wins/losses.
9. Journaling and performance review
A trade journal is non-negotiable. Record: entry/exit, size, reason for trade, emotions, and lessons learned. Monthly and quarterly reviews should measure:
Win rate and average win/loss
Profit factor and expectancy
Drawdown frequency and depth
Which setups are most profitable
Use these metrics to prune poor setups, and double down on strengths.
10. Edge maintenance and adaptability
Markets evolve. A strategy that worked last year can fail today. Maintain edge by:
Continuous learning: Read market reports, research, and adapt to structural shifts (e.g., algo prevalence, regulation changes).
Parameter stability checks: Re-test strategy parameters periodically; if performance degrades, investigate why.
Scaling in and out: Increase capital allocation gradually as live performance proves itself.
11. Practical checklist before placing a trade
Always run through a checklist:
Does the trade fit my system? (Yes/No)
How much will I risk in ₹/$? Is it within limits?
Exact entry, stop, profit target set? (Record them)
Is market structure or news likely to invalidate the setup?
Am I emotionally clear to trade? (Not revenge-motivated)
If any answer is negative, skip the trade.
12. Avoid common myths and pitfalls
Myth: More indicators = better decisions. Reality: parsimony wins. Too many indicators create noise.
Myth: You must be right most of the time. Reality: success depends on average win size relative to losses.
Pitfall: Chasing high-leverage products without understanding margin calls and decay (time decay in options is a classic example).
13. Tools and tech that help
Start simple: a reliable broker, a fast internet connection, and one good charting platform. As you scale, consider:
Data subscriptions for depth and historical ticks
Backtesting platforms (Quant, Python libraries, or built-in platform tools)
Trade automation for precise execution and disciplined risk management
14. Continuous improvement — be patient and humble
Trading is a marathon. Expect ups and downs. The professionals who last are those who treat trading like a craft: measure everything, cut losing ideas ruthlessly, and preserve capital above all.
Final thought
There’s no magic formula, but there is a playbook. Combine a clear mindset, an objectively tested edge, strict risk management, and honest record-keeping — and you’ll be far ahead of most traders. Start small, learn fast, and let the market tell you which ideas are real. Good luck, and trade responsibly.

Gold (XAU/USD) Technical Analysis - October 18, 2025Overview and Recent Performance
As of October 18, 2025, spot gold closed at $4,196.00, marking a 2.12% decline from the previous day's close of $4,253.97. This pullback came after a volatile session where gold reached an intraday high of $4,380 but failed to sustain above $4,300, closing near the session low. Over the past week, gold has surged approximately 6.5%, extending its year-to-date gain to over 58%. U.S. Federal Reserve policy uncertainty, and safe-haven demand. Earlier in the month, gold notched its 45th all-time high of 2025.
Support and Resistance Levels
Resistance: Immediate at $4,300 (recent swing high), followed by $4,380 (today's high) and $4,460 (Elliott Wave target). A sustained break above $4,300 could target $4,500
Support: Near-term at $4,196 then $4,137 and $4,100 Deeper support at $4,000, where historical buying interest is strong.
~~ Disclaimer ~~
Trading or investing in assets like crypto, equity, or commodities carries high risk and may not suit all investors.
Analysis on this channel uses recent technical data and market sentiment from web sources for informational and educational purposes only, not financial advice. Trading involves high risks, and past performance does not guarantee future results. Always conduct your own research or consult a SEBI-registered advisor before investing or trading.
This channel, Render With Me, is not responsible for any financial loss arising directly or indirectly from using or relying on this information.

Gold Analysis and Trading Strategy | October 17✅ 4-Hour Chart Analysis:
Gold has entered a clear correction phase after a prolonged rally, with a recent high near 4379.52 followed by a sharp drop to around 4215.
Currently, the price is trading above the Bollinger middle band (around 4111), while MA5, MA10, and MA20 are all turning downward — indicating that short-term bullish momentum is weakening.
The Bollinger Bands are beginning to narrow, suggesting that volatility is calming. As long as the price holds above MA20 (around 4110), the medium-term bullish structure remains intact.
In the short term, gold may continue to consolidate between 4210–4280. If it breaks below 4200, a further correction toward 4150–4170 is possible.
✅ 1-Hour Chart Analysis:
On the 1-hour timeframe, gold has shown a steady decline after peaking near 4379, confirming a short-term bearish shift.
MA5, MA10, and MA20 have formed a bearish crossover, and the Bollinger Bands are opening downward — indicating that bears currently dominate the market.
The price is hovering near the lower Bollinger Band (around 4210), suggesting a potential for a short-term rebound, but resistance lies at 4240–4250.
If the rebound fails to hold, gold is likely to remain in a weak consolidation range between 4200–4250.
🔴 Resistance Levels: 4240–4250 / 4280–4290 / 4320
🟢 Support Levels: 4200–4190 / 4170–4150
✅ Trading Strategy Reference:
🔰 If the price rebounds to 4240–4250 and faces resistance, consider light short positions.
🎯 Targets: 4210 / 4190
🔰 If gold retraces to the 4170–4190 zone and holds steady, consider entering long positions in batches.
🎯 Targets: 4230 / 4250
📊 Summary:
Gold has entered a high-level correction phase after an extended rally. The medium-term bullish trend is still valid, but momentum has slowed.
Traders are advised to control position size, stay flexible, and wait for clearer direction before making larger commitments.
XAUUSD (Gold/USD) chart (1-hour timeframe)... XAUUSD (Gold/USD) chart (1-hour timeframe), here’s a breakdown of what’s visible:
Price has broken below an ascending trendline and dropped into the Ichimoku Cloud.
My marked target point below, around the 4,100–4,120 zone.
Current price: ≈ 4,217 USD.
Cloud support seems to extend down to roughly 4,100–4,080, and the horizontal support line drawn near the bottom confirms that area as the next target/support level.
✅ Technical Summary (from chart):
Trend: Short-term bearish correction.
Immediate support/target: ≈ 4,100–4,080.
Resistance: Around 4,260–4,285 (top of cloud / broken trendline retest).
📉 Target:
> 🎯 4,100 – 4,080 zone
That’s my likely downside target if price continues following the bearish momentum and cloud support break setup.

XAUUSD (Gold Spot vs. USD) Long Positioney Trade Details
Entry Price: Likely around $4,221.90 (aligned with the SELL marker, but interpreted as a long entry point post-dip).
Stop Loss (Risk Management): Potentially $4,211.12 (below the recent low, ~10.78 pips risk, based on the stop level marked).
Take Profit Target: Possibly $4,374.3 (extrapolating from the upward trend and prior high, ~152.4 pips reward; 3.6% move).
Risk-Reward Ratio: Approximately 1:14 (highly favorable if targeting the recent peak).
Position Size/Amount: 40.263 units (moderate exposure, adjust per risk tolerance).
Trade Direction: Long (BUY), anticipating a continuation of the bullish trend after a minor pullback.
Chart Context
Timeframe: 15-minute intraday (covering ~09:00 to 19:30 UTC).
Price Action: Gold rallied to ~$4,310 earlier (green box marking the breakout), with a dip to $4,221–$4,226. The long setup likely targets a bounce from this support zone, supported by a bullish engulfing candle or momentum resumption.
Indicators: ATR ~5.3 pips suggests low volatility; the trade leverages the broader uptrend (up 18% monthly, 58% YOY) driven by geopolitical tensions (e.g., US-China trade tariffs).
Trend: Strongly bullish, with analysts eyeing $4,100–$4,125 short-term support and potential highs beyond $4,374 if momentum holds.

XAUUSDIf you look at this chart of gold, in the last two years no cycle has given a return more than 19 % ago. Today gold has generated a return of 21% in this cycle and the candle that has formed today, according to me, is a sign of a reversal. What I mean to say is that we should book some profit the time . What do you say?

GOLD Awaiting Sell Reaction at Peak & Buy Pullback Support🔍 Market Context
After a series of strong Break of Structure (BoS) , gold has reached a new ATH at 4,385 USD – marking a sustainable uptrend over the past 3 sessions.
However, this peak area is currently acting as a significant psychological and technical barrier . Buying momentum is temporarily slowing as the price reacts to the Liquidity Zone around 4,351 – 4,385 USD .
The market is in a phase of liquidity rebalancing .
The major trend remains upward, but the current price area may see a short-term correction before further wave expansion.
💎 Technical Analysis
ATH GOLD: 4,385 USD
Sell Liquidity Zone: 4,430 – 4,435 USD → high liquidity resistance zone, potential for short-term sell reactions.
Liquidity Zone $$$: 4,284 – 4,282 USD → nearby support zone, confluence with trendline.
Order Block | Fibonacci Zone: 4,226 – 4,230 USD → deep discount zone confluencing with Fibo 0.618, high reversal potential.
Overall Structure: remains bullish , but showing short-term signs of weakness as the price fails to hold above 4,360.
📈 Trading Scenarios
1️⃣ SELL Setup – Rejection at peak area 4,385 – 4,433 USD
Entry: 4,430 - 4,435
SL: 4,440
TP: 4,425 → 4,420 →4,415→4,410→4405
✅ Condition: Appearance of rejection or strong bearish engulfing candles at high Liquidity zone.
➡️ This is a liquidity reaction setup – sell when the price sweeps the peak and clear sell signals from major players appear.
2️⃣ BUY Setup #1 – Pullback at 4,284 – 4,282 USD
Entry: 4,284 – 4,282
SL: 4,272
TP: 4,290 → 4,300 → 4,310/Open
✅ Condition: Strong H1 candle reaction at support or minor reversal structure.
➡️ Buy with the main trend, taking advantage of a slight pullback around the support Liquidity zone.
3️⃣ BUY Setup #2 – OB Deep Zone 4,226 – 4,230 USD
Entry: 4,226 – 4,230
SL: 4,190
TP: 4,235 → 4,240 → 4,250/Open
✅ Condition: Appearance of bullish BoS or confirming bullish engulfing candle.
➡️ This is a deep discount zone, suitable for swing orders following the main trend.
⚠️ Risk Management
Avoid FOMO buying at high zones (4,360+).
Prioritize observing price behavior at 4,284 and 4,226 before entering orders.
Sell orders at 4,385–4,430 are only triggered if there is a clear confirmation signal.
Maintain moderate volume, avoid averaging down without confirmation.
💬 Conclusion
Gold is accumulating after reaching the peak of 4,385 USD , this is a crucial phase to determine the correction before the new upward wave.
The most effective strategy now is sell reaction at the high peak area 4,385 – 4,430 and buy with the trend at 4,284 – 4,226 USD when confirmation appears.
👉 Reasonable Strategy:
Sell Reaction: 4,385 – 4,430 → TP 4,284 – 4,226
Buy Pullback: 4,284 – 4,282
Buy OB Deep: 4,226 – 4,230

Gold trend - 15 min on range-bound low. A buying opportunity.On 15 min chart, gold is showing a range bound. Also as the weekly candle is a big body green candle, price will hit the high again next week. So on 15 min, we can enter at the bottom of the range bound and exit at the top.

Elliott Wave Analysis – XAUUSD (17/10/2025)🔹 1. Momentum
D1 Timeframe:
The D1 momentum is now fully in the overbought zone → the probability of a reversal is very high.
A corrective move could occur either today or on Monday next week.
H4 Timeframe:
H4 momentum has been sticking together in the overbought zone.
Currently, there are about 5 candles holding the oscillator at this level — typically, 5 to 8 candles mark a potential reversal cycle.
H1 Timeframe:
H1 momentum is still rising → price may extend slightly higher or move sideways to accumulate before a clearer signal appears.
________________________________________
🔹 2. Wave Structure
D1 Chart:
The recent D1 candles are steep and impulsive, showing strong bullish pressure — indicating we are likely in Wave 3 (yellow).
I’ve adjusted the wave labels for better accuracy with current price structure.
Once D1 momentum reverses, we can expect the start of Wave 4 (yellow) correction.
H4 Chart:
• Waves (1) and (3) in blue are similar in length → suggesting Wave (5) blue may become an extended wave.
• Since price has broken above the Elliott channel, we should wait for a strong downward reaction together with momentum reversal on H4 to confirm:
✅ Wave (5) blue is complete,
✅ and Wave (3) purple has also finished.
⇒ Then, the market would begin Wave (4) purple correction.
💡 Note: During an extended Wave (5), avoid selling against the trend.
Be patient and wait for the first downward move — if it’s not deep, then buying from the next pullback would be a more reasonable strategy.
H1 Chart:
Within the blue Wave (5) on H1, we can see a five-wave red structure developing, and price is now in red Wave (3).
Inside red Wave (3), there’s another five-wave black sub-structure, currently in black Wave (4).
By drawing the Elliott channel, we can see that black Wave (4) is likely forming a flat correction, and one final small drop may still occur to complete the structure.
🎯 Ideal Target Zone:
• The high-liquidity area around 4297.
• This is a likely completion zone for the current flat pattern.
• If price doesn’t reach that level, we’ll use channel support confluence to identify the next valid entry area.
________________________________________
🔹 3. Trading Plan
Buy Zone: 4298 – 4296
Stop Loss: 4276
Take Profit 1: 4363

GOLD / XAUUSD – DAILY PLAN (Oct 17, 2025)🧭 MARKET CONTEXT
Main timeframe: M30 / H1
Current structure remains bullish, forming clear HH – HL sequences.
After a strong rally, price is now in a retracement phase toward a nearby demand zone aligned with the ascending trendline.
No sign of structure break yet (no BOS below the previous HL).
📈 PRIMARY SCENARIO (BUY SETUP)
➤ Entry Zone 1:
BUY GOLD 4280 – 4278
Stop Loss: 4275
Target 1: 4335
Target 2: 4350 (new HH)
Reason: This is a Bullish Order Block (OB) and BOS retest zone, aligned with the rising trendline.
Expecting a strong bullish reaction (rejection candle or engulfing bar) before triggering the buy limit.
➤ Entry Zone 2 (CP Setup – Confirmation Point)
BUY 4247 – 4245
Stop Loss: 4239
Target: 4300 / 4330 / 4350
Reason: This is the final demand zone near the main trendline, confluence of prior BOS + SSS (Structure Shift Support).
If price breaks below 4280 without reaction, patiently wait for confirmation around CP zone.
⚠️ ALTERNATIVE SCENARIO (STRUCTURE FAILURE)
If price closes below 4235 on M30, the bullish structure is invalidated.
→ The buy plan is canceled — wait for a pullback sell setup from 4280–4300 resistance.
If the buy stop loss is hit at 4239, monitor 4200 zone as the next H4 demand area.

Gold sweeps SL, wait for BUY LIMIT at Demand Zone 4,223-4,225Timeframe analysis: H4/30M
Logic: Trend Continuation after liquidity sweep.
MARKET STRUCTURE ANALYSIS (SMC Analysis)
Main Trend: Bullish (Price is moving within a parallel channel).
Structure Confirmation (BOS): The chart has confirmed an upward Break of Structure (BOS), indicating that buyers are controlling the market.
Liquidity Sweep/Fake: The strong bearish candle (marked as "Fake") is a move to sweep Stop Losses of early buyers and gather liquidity before Smart Money pushes the price in the main direction. This is an Inducement action.
Key Demand Zone (POI/Demand Zone/Order Block): The TIMING BUY area (4,223.154 - 4,225.000) is a potential Demand Zone/Order Block identified by Smart Money. The price is expected to retest this area before continuing to rise.
MAIN TRADING SCENARIO (LONG SETUP)
SCENARIO: Wait for the price to Pullback to the POI area to enter a buy order, continuing the main bullish trend.
Parameter
Value
SMC Description
Action
BUY LIMIT
Place a pending buy order
Entry Zone (POI)
4,225.000 - 4,223.150
Demand Zone/Order Block after liquidity sweep.
Stop Loss (SL)
4,214.390
Place below the low of the liquidity sweep candle ("Fake Low"), ensuring safety.
Take Profit 1 (TP1)
4,240.000
Target the nearest Swing High.
Take Profit 2 (TP2)
4,250.000
Target psychological resistance and mid-channel.
Take Profit 3 (TP3)
4,260.000+
Target the upper boundary of the parallel channel.
R:R Ratio
Approximately 1:2.5 to 1:3.5 (Depending on TP)
Good R:R ratio for a trend-following trade.
RISK MANAGEMENT
Risk: Only risk a maximum of 1-2% of the account for this trade.
Breakeven: When the price hits TP1, move SL to the Entry point (Breakeven) to protect capital.
Invalidation: If the price closes the D1/H4 candle below the SL level (4,214.390), the buy plan will be invalidated.

Part 2 Ride The Big Moves Call Options Explained
A call option gives the holder the right to buy an asset at a predetermined price, known as the strike price, before the contract expires. Traders buy call options when they expect the asset’s price to rise. For example, if a stock trades at ₹100 and you buy a call with a ₹105 strike, you profit if the price surpasses ₹105 plus the premium cost. Call options are commonly used to leverage bullish expectations, offering high potential returns with limited risk exposure compared to directly purchasing the stock.

Fibo BUY Zone Mandatory for Trend Continuation.🎯 Macro Summary & Bias: The Bulls Are Unstoppable!
Gold is the most sought-after asset as XAU/USD aims directly for the $4,300 mark and further.
Primary Catalyst: Financial markets remain cautious amidst the ongoing US government shutdown.
Driving Force: Widespread USD weakness—fueled by the funding battle in the US government—strengthens the bullish case for Gold.
Record Strength: XAU/USD is maintaining positive upward momentum despite extreme overbought conditions.
Technical Focus: In this continuous Bull market, FIBO is the paramount tool for identifying the critical pullback points to initiate BUY entries.
📊 In-Depth Technical Analysis (H1): Pinpointing the FIBO Reaction Levels
Our core strategy remains BUY ON DIPS at the most precise Fibo levels, leveraging the strong Parabolic structure.
1. Strategic BUY Zone (FIBO BUY REACT ZONE):
This is the most crucial Fibo support zone where we anticipate a high-probability pullback:
4,321.332 The REACTION FIBO BUY ZONE 0.5.
This is the most vital retracement point to catch the next growth wave.
2. Sell/Take-Profit Targets (FIBO SELL TARGETS):
These are the Fibo extension targets where the Longs are aiming:
TP Target 1 (Extension) 4,436.179 The REACTION FIBO SELL ZONE 1.5 - 1.618. The next immediate target for the rally.
TP Target 2 (Deep Extension) 4,538.394 The REACTION FIBO SELL ZONE 2.5 - 2.618. The long-term target if momentum remains unchecked.
📈 TODAY'S ACTION PLAN
Primary Action (Prioritize BUY): Patiently wait for the price to correct to the REACTION FIBO BUY ZONE 0.5 at 4,321.332.
Upon confirmation (H1/M30/M15 reversal candles), confidently activate the Long (BUY) entry.
Targets (TP): Aim for TP Target 1 (4,436.179) and further to TP Target 2 (4,538.394).
⚠️ Risk Warning
Risk Warning: Given the extreme overbought conditions, always place a safe Stop Loss (SL) below the Fibo BUY ZONE and maintain stringent risk management!
Wishing all FranCi$$_FiboMatrix traders a disciplined and victorious day!

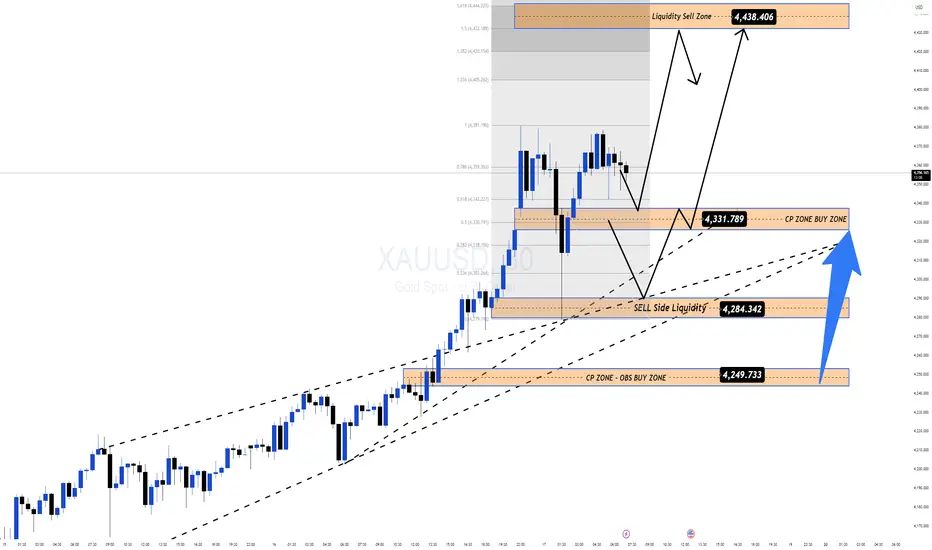
Gold Retests All-Time Highs – Bulls Still in Full Control📊 Market Overview
Gold experienced a sharp intraday drop during the Asian session, testing the 4,280 – 4,279 USD zone before quickly recovering. Despite short-term volatility, it continues to close the week in green for the ninth consecutive time — confirming the strength of the ongoing bullish cycle.
The broader fundamentals remain supportive:
💥 Persistent geopolitical tensions keep safe-haven demand high.
⚖️ US–China trade uncertainty and the risk of a prolonged US government shutdown weaken risk appetite.
💵 Fed rate-cut expectations and USD softness continue to favor gold upside.
In short — Smart Money remains positioned long, and every dip still looks like a liquidity grab for re-accumulation.
🧠 Technical Structure (MMFLOW View)
On the M30 timeframe, gold continues to respect an ascending channel, currently forming a liquidity trap and breakout setup around 4,280 – 4,330.
Price action suggests gold may be completing a short-term corrective wave (B) before resuming the larger bullish impulse.
The structure remains technically bullish, with all pullbacks showing strong rejections from demand zones.
🔑 Key Levels to Watch
🟢 BUY ZONE (Primary Setup)
Zone: 4,230 – 4,228
SL: 4,220
TP: 4,240 – 4,250 – 4,260 – 4,270 – ???
🔵 CP ZONE BUY (Secondary Support)
Zone: 4,284 – 4,285
SL: 4,275
TP: 4,300 – 4,315 – 4,330 – 4,340 – ???
🔴 SCALP SELL (Liquidity Reaction Zone)
Zone: 4,438 – 4,440
SL: 4,448
TP: 4,420 – 4,410 – 4,390 – ???
⚙️ MMFLOW Scenarios
1️⃣ Primary Bullish Scenario:
If gold holds above 4,280 – 4,284, expect continuation toward 4,380 – 4,438 (Liquidity Sell Zone).
The 4,284 level is the key control point where Smart Money may look to re-enter long positions.
2️⃣ Alternative Correction Scenario:
A clean break below 4,280 could drive price toward 4,249 – 4,243 (CP Buy Zone) before another bullish push higher.
This structure still aligns with a Healthy Correction Pattern within a broader uptrend.
⚡️ MMFLOW Insights
Gold remains in a mid-term expansion phase, with both macro and technical alignment favoring continued upside.
The 4,280 – 4,330 range acts as a Smart Money accumulation zone, preparing for a liquidity sweep higher.
Medium-term upside target: 4,438 – 4,445 USD/oz (Liquidity Sell Zone).
⚠️ Trading Notes
✅ Always use a protective Stop Loss — volatility can spike during liquidity hunts.
✅ Avoid chasing entries at highs; wait for reaction around BUY ZONES.
✅ Focus on liquidity confluence zones (Fibo + CP Zone + Order Block) for the highest-probability setups.
🧭 Quick Summary
Gold remains resilient despite early-session volatility.
Watch BUY ZONES at 4,230 – 4,228 and 4,284 – 4,285 for possible long re-entries.
Short-term target: 4,380 – 4,438 USD/oz.
Bias: Bullish – Buy the dips, not the breakouts.