Gold trading strategy | October 14-15✅ From the overall structure, gold is still moving within an upward channel, with the previous high around 4179 remaining a key short-term resistance level. Although selling pressure above has increased, the price continues to trade steadily above all major moving averages (MA5, MA10, MA20, MA60), indicating that the main bullish trend remains intact.
✅ On the 4-hour chart, the moving averages MA5 and MA10 maintain an upward slope, while MA20 and MA60 continue to rise, forming a standard bullish alignment — showing that the medium-term uptrend is still intact.
Currently, the price is moving above MA5 and MA10, suggesting that the bulls still have the upper hand.
The upper Bollinger Band is near 4196, and the middle band is around 4058. The price is moving between the middle and upper bands, indicating a strong consolidation zone. In the short term, gold may continue oscillating between 4120–4180, building momentum for a potential breakout above 4190.
As long as it does not fall below the middle band or MA20 (around 4050–4060), the overall bullish trend remains intact.
✅ On the 1-hour chart, gold is currently holding steady around 4145–4150, showing high-level consolidation in the short term. If the price holds above MA10 (around 4132), there is potential for another rebound toward the 4160–4175 range.
The upper Bollinger Band near 4165 forms short-term resistance, while the lower band around 4104 provides support. The middle band (around 4134) serves as a key support level.
If the middle band holds, the short-term rebound could continue; if it breaks, deeper correction may follow.
The 1-hour structure indicates that gold is undergoing high-level sideways correction, with short-term direction still unclear. If 4130–4120 support holds, gold is likely to extend its upward move; if it breaks below, a further pullback toward 4100–4085 could occur.
🔴 Resistance Levels: 4165–4175 / 4185–4190
🟢 Support Levels: 4130–4120 / 4100–4085
✅ Trading Strategy Reference:
🔰 If gold pulls back to the 4120–4130 zone and holds steady, consider building long positions in batches, targeting 4160–4175, with a stop loss below 4105.
🔰 If gold rises to the 4175–4185 area and faces resistance, consider light short positions, targeting 4135–4120, with a stop loss above 4190.
🔥Trading Reminder: Trading strategies are time-sensitive, and market conditions can change rapidly. Please adjust your trading plan based on real-time market conditions.
Trade ideas

Gold → Ready for the Next Bullish WaveGold (XAUUSD) continues to gain momentum as shifting global conditions drive investors toward safer assets. The ongoing uncertainty in financial markets, coupled with renewed concerns over U.S. fiscal policy and interest rate adjustments, has strengthened gold’s long-term appeal.
Recent market behavior reflects consistent institutional demand, with traders positioning ahead of potential monetary easing cycles. As confidence in traditional currencies weakens, gold remains a preferred store of value for both investors and central banks.
Structurally, the market is maintaining a healthy uptrend, showing controlled corrections within a broader bullish framework. The latest price movements suggest that momentum is building for another upward phase, possibly targeting new historical zones if global instability persists.
In summary, gold’s outlook stays constructive — supported by both macroeconomic sentiment and steady technical momentum.
How do you see the XAUUSD trajectory evolving — continuation of growth or a major pause ahead?

Elliott Wave Analysis – XAUUSD | October 14, 2025📊
________________________________________
🔹 1. Momentum
D1:
Daily momentum has started to turn upward from the oversold zone, suggesting that the bullish pressure may continue throughout the week.
H4:
On the H4 chart, momentum is stuck together in the overbought zone, indicating that a reversal could occur at any moment.
Currently, there have been 13 consecutive bullish candles in the H4 momentum cycle — a typical length before a reversal often appears.
👉 Therefore, avoid chasing long positions (Buy) at this stage.
H1:
H1 momentum is also deep in the overbought area, which means a short-term correction could take place soon.
________________________________________
🔹 2. Wave Structure
D1:
The current pattern shows that Wave 5 is extending, which makes it difficult to project the exact target using Fibonacci ratios.
However, an extended fifth wave usually ends with a sharp and decisive decline, which serves as a confirmation that Wave 5 has completed.
H4:
Price is currently forming Wave 5 (yellow), which also represents Wave 3 (purple) in the higher degree.
Thus, the uptrend is still intact for now.
Once Wave 5 (yellow) — equivalent to Wave 3 (purple) — finishes, the market will likely enter a corrective phase (Wave 4 purple), which would align with a momentum reversal on H4.
H1:
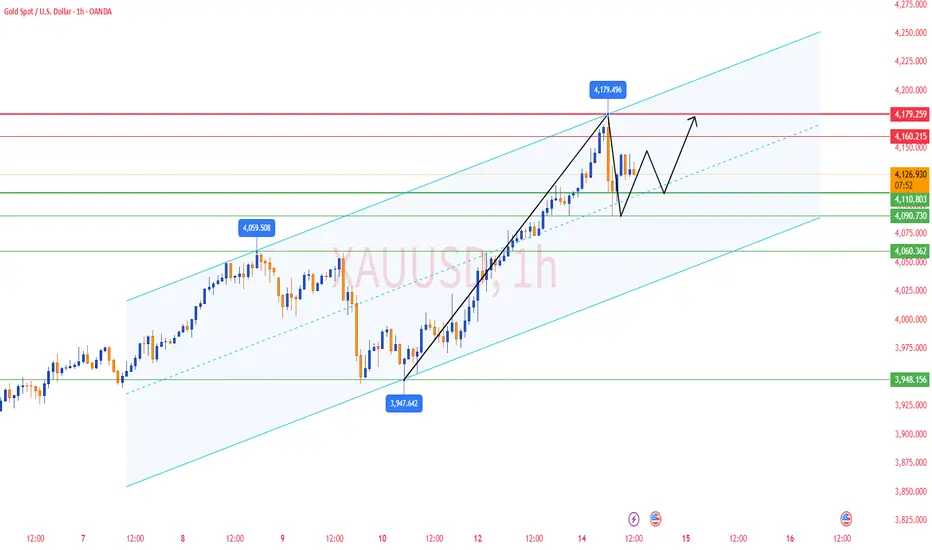
On the Elliott channel drawn from Wave 2 → Wave 4 → Wave 3 (yellow), price has broken above the upper boundary, which could be a throw-over pattern.
If price returns and closes back inside the channel, it would confirm the completion of Wave 5.
Connecting Wave 1 and Wave 3 highs, we can see that price is now above this trendline, and the 4157 zone coincides with the 0.618 Fibonacci extension of Waves 1–3 — forming a strong confluence area where a correction is likely to begin.
________________________________________
🔹 3. Trading Plan
At the moment, price is sitting around a major top, where the Monthly Wave 3 and the Weekly Wave 5 structures converge.
👉 This means volatility could be high and unpredictable.
For now:
• Avoid swing trades,
• Focus only on short-term scalp opportunities with tight targets,
• Wait for a clear confirmation signal at the top zone before entering new positions.

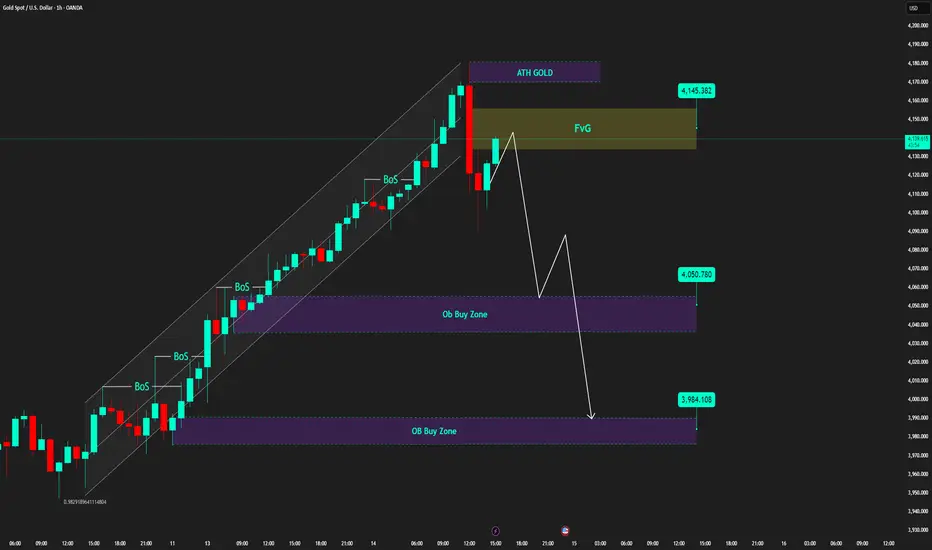
m15 timeframe sees gold drop sharply by 50 points 🔍 Market Context
Gold prices have just reached an all-time high (ATH GOLD) around the 4,180 USD mark, following a steep upward rally over several sessions.
Immediately after, the market witnessed the first break of structure (BoS) – a sign that the upward momentum is weakening .
Currently, prices are returning to fill the Fair Value Gap (FVG) at 4,125 – 4,145 USD , and this is likely a liquidity rebalancing phase before prices choose the next direction.
💎 Technical Analysis
ATH GOLD: 4,180 – 4,185 USD
Fair Value Gap (FVG): 4,125 – 4,145 USD → an empty price zone that needs to be filled.
Order Block Buy Zone 1: 4,050 – 4,060 USD → the nearest demand zone, potentially creating the first technical reaction.
Order Block Buy Zone 2: 3,980 – 3,985 USD → a deeper demand zone, large liquidity confluence, possibly becoming the main "accumulation point."
Overall Structure: After breaking the upward channel, the market is in a retracement phase – the medium-term structure remains bullish .
📈 Trading Scenarios
1️⃣ Short-term Sell Scenario – filling FVG and technical adjustment
If prices continue to test the FVG 4,125 – 4,145 USD zone without surpassing it,
→ consider a short-term sell to catch the technical retracement phase.
Target: the first OB Buy Zone at 4,050 USD .
Stop Loss: above 4,155 USD (to avoid being swept above the FVG peak).
➡️ This scenario suits short-term traders following corrective waves – only enter when there is a clear reversal candle confirmation.
2️⃣ Trend-following Buy Scenario – catching the rebound from OB Zone
If prices adjust to the 4,050 – 4,060 USD zone, observe reaction signals such as Bullish Engulfing or strong Rejection .
Upon confirmation, initiate a trend-following buy order .
Target: zone 4,125 → 4,145 USD or the previous peak at 4,180 USD.
Stop Loss: below 4,030 USD.
If the first OB zone does not hold, the 3,980 – 3,985 USD zone will be an ideal area for long-term "accumulation."
⚠️ Risk Management
Avoid FOMO buying at high prices when the FVG is not yet filled.
Prioritise trading at clear reaction zones (OB, FVG edge).
Reduce volume when entering counter-trend orders to preserve capital.
💬 Conclusion
After a steep rise, gold is entering a value rebalancing phase .
The current market structure leans towards a short-term technical retracement before continuing the main upward trend.
If the 4,050 – 4,060 USD zone reacts well, gold may soon rebound and aim for the 4,150 – 4,180 USD zone.
👉 Reasonable Strategy:
Short-term sell when price reacts at FVG.
Wait to buy at OB Buy Zone when there is a confirmed bullish signal.
Gold Analysis and Trading Strategy | October 14✅ From the overall structure, gold remains in a medium-term bullish trend, but after encountering resistance around 4179, it has started to pull back and is now in a high-level consolidation phase. The main bullish trend remains intact, but selling pressure above has increased as the market digests previous gains.
✅ From the 4-hour chart, after a series of upward moves, the candlesticks have pulled back and are currently fluctuating between MA5 and MA10. Both MA20 and MA60 continue to slope upward, indicating that the medium-term trend is still strong. However, short-term momentum has weakened, and the market is undergoing a high-level correction. The upper Bollinger Band is near 4172, and the middle band around 4046, with prices currently trading between them — a sign of strong consolidation. There is, however, short-term correction pressure. As long as the price does not break below the 4080–4060 support range, the overall uptrend remains valid.
✅ On the 1-hour chart, gold quickly retreated after hitting 4179, stabilizing around 4130. The price movement shows slight weakness but still remains above the main bullish structure.
The moving averages MA5 and MA10 have converged, while MA20 is still pointing upward, indicating intensified short-term price battles between bulls and bears, but no clear reversal signal yet. The upper Bollinger Band is near 4163, and the lower band around 4087. The current candlestick is close to the middle band; if gold holds the 4120–4110 area, a rebound is likely.
The 1-hour timeframe has entered a high-level sideways consolidation and short-term correction phase. If the 4110–4100 zone holds, gold may once again test 4150–4170 in the near term.
🔴 Resistance Levels: 4160–4175 / 4180–4190
🟢 Support Levels: 4110–4100 / 4060–4040
✅ Trading Strategy Reference:
🔰 If gold pulls back to the 4100–4110 zone and holds steady, consider building long positions in batches, targeting 4150–4170, with a stop loss below 4085.
🔰 If gold rises and faces resistance in the 4175–4180 area, consider light short positions, targeting 4120–4105, with a stop loss above 4185.
🔥Trading Reminder: Trading strategies are time-sensitive, and market conditions can change rapidly. Please adjust your trading plan based on real-time market conditions.
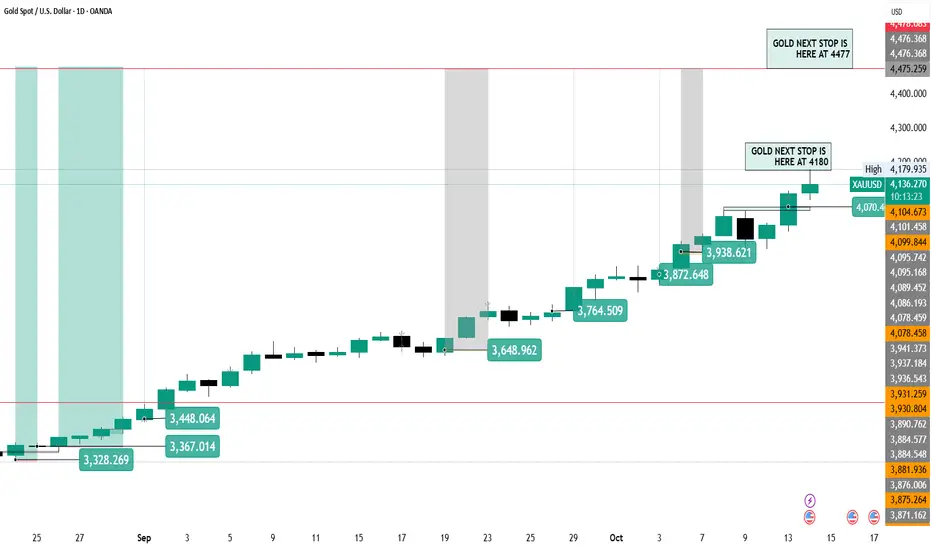
This is my next #gold tp in next 2-3 week and hight will be 4477This is my next #gold tp in next 2-3 week and hight will be 4477This is my next #gold tp in next 2-3 week and hight will be 4477This is my next #gold tp in next 2-3 week and hight will be 4477This is my next #gold tp in next 2-3 week and hight will be 4477This is my next #gold tp in next 2-3 week and hight will be 4477This is my next #gold tp in next 2-3 week and hight will be 4477This is my next #gold tp in next 2-3 week and hight will be 4477
Part 1 Candle Stick PatternRisks and Rewards in Option Trading
Option trading offers tremendous potential—but it comes with unique risks. Understanding these is essential:
Limited Time: Options lose value as expiry nears due to time decay (Theta).
Volatility Risk: Sudden drops in volatility can reduce option prices unexpectedly.
Liquidity Risk: Some options have low trading volume, making it difficult to enter or exit positions.
Leverage Effect: Options amplify both gains and losses.
Margin Requirements (for Sellers): Option writers must maintain sufficient margin, as potential losses can be large.

GOLD CRASH ALERT: +60 PRICES DUMP! Waiting for the Ultimate Fibo React BUY Zone.
FranCi$$_FiboMatrix Emergency Action Plan
Gold just suffered a brutal 60-point plunge from 416x to 411x, triggered by mounting geopolitical tensions. The market is volatile, and deep correction is highly likely. We must trade smart, not emotionally.
🎯 EMERGENCY ACTION ZONES (H1/M30)
Avoid chasing! We only trade when price hits our calculated FIBO REACTION ZONES.
1. SCALP SELL RETRACEMENT:
Zone 1 (High): Watch the 407x area (4,077.605).
Zone 2 (Key Fibo Resistance): The 405x area (4,048.493).
Action: If price bounces back into either zone, look for strong bearish rejection to execute a SCALP SELL.
2. CRITICAL BUY REACT ZONE (The Lifeline):
Zone: We are waiting for the AD's updated FIBO REACTION zones that conform to the new deep trend.
Action: DO NOT BUY BLINDLY. Only enter a Long when the price reaches these deeper support levels and gives a strong, confirmed BUY REACT signal.
⚠️ Immediate Focus: OBSERVE & WAIT. The AD will provide continuous updates. Manage risk strictly—this volatility demands discipline!

XAUUSD – Liquidity Sweep “Flush”XAUUSD – Liquidity Sweep “Flush”; prioritise trading around key zones 🟡
Gold just dropped nearly 90 points during the Asian session – a time typically lacking volume, resulting in a “flush” that wiped out many leveraged positions. The larger trend remains bullish, but short-term risks of a deep pullback are present before the European–American markets engage.
The accompanying image shows:
Price peaked and then broke the upper edge of the H1 uptrend channel → quickly fell to the mid-channel zone.
Thick Volume Profile cluster around 4.07x, POC ~4,075; below lies VAL ~4,025.
Sell retest zone marked around 4.14x; grey boxes indicate buy zones at 4,075 and 4,056.
Key Levels
Resistance: 4,143–4,150, 4,122, 4,160.
Support: 4,075 (POC), 4,056 (buy scalping), 4,025 (VAL).
Scalping watch: 4,057 – 4,085 – 4,160 – 4,025.
Trading Scenarios
SELL retest (reaction, higher risk)
Entry: 4,143
SL: 4,150
TP: 4,122 → 4,105 → 4,078 → 4,050
Idea: activate only upon clear rejection at 4.14x (long wick/engulfing H1).
BUY at POC zone
Entry: 4,075
SL: 4,067
TP: 4,089 → 4,100 → 4,122 → 4,155
BUY scalping (shallow pullback)
Entry: 4,056
SL: 4,049–4,050
TP: 4,075 → 4,089
Invalidation: short-term buy bias weakens if H1 closes below ~4,025 (VAL). If this zone breaks, prioritise waiting for a failed retest to consider selling with the continued downtrend.
Practical Notes
The range is currently very wide; the European session will increase volume, making false breaks more likely.
After TP1, move SL to entry to secure the position.
Sell orders are merely reaction trades at 4.14x; prioritise buy-the-dip at 4,075/4,056 upon confirmation signals.

October 14th Gold Analysis: High-Level Fluctuation, Waiting for October 14th Gold Analysis: High-Level Fluctuation, Waiting for the Storm
Key Point: The gold market will maintain a high-level fluctuation pattern this week, with bulls and bears fiercely battling in the 4100-4150 range. The core drivers of the market remain the escalating geopolitical crisis in the Middle East and the Federal Reserve's monetary policy expectations. This interplay between the two will determine the short-term direction of gold prices.
Current Market Review
The gold market has risen for three consecutive weeks, generally rising at the beginning of the week and falling on Thursday and Friday, with gains exceeding $100 each week.
This week, the market rose on Monday, then surged $100 before immediately falling, indicating that the market's rapid rise led to profit-taking by some investors. If the gold price fluctuates above 4100 today, there may be another wave of increases from Wednesday to Friday. The increase can refer to the increase of US$100 in the previous two weeks. Therefore, as long as gold prices do not fall below 4100 this week, it presents a good entry opportunity, with a target of 4175 and a stop-loss at 4070.
Trade cautiously and manage risk! Wish you a smooth trade!
XAUUSD – Sharp Pullback After Hitting New ATHMarket Context:
Gold has seen a steep intraday drop after hitting a fresh all-time high at 4,179 USD/oz, extending beyond the morning target of 4,170–4,172.
The move likely reflects profit-taking amid broader market caution, as the US Dollar strengthened and GBP fell sharply, indirectly weighing on XAUUSD.
Silver also followed the correction, down over 2%, trading near 51 USD/oz after peaking at 53.60 earlier.
Despite this drop, the overall market sentiment remains defensive — both metals are still up about 2% for the week, suggesting this is a technical retracement, not a full trend reversal.
Technical Outlook (M30):
Price has broken below the short-term rising channel and is now retesting key liquidity areas.
Watch the 4,134 – 4,135 zone for a potential retest (50% pullback) before continuation toward lower buy zones.
End Liquidity Sell Zone: 4,165 – 4,170
Retest Zone (50% Down): 4,134 – 4,135
CP Buy Zone / Fibo 0.618: 4,052 – 4,054
OBS Buy Zone: 4,000 – 4,005
Trading Plan:
🔹 Sell Setup (Correction Play):
Entry: 4,134 – 4,136
Stop Loss: 4,142
Take Profit: 4130 - 4125 - 4120 - 4110 - 4100 - ???
🔹 Buy Setup (Reaction Zone):
Entry 1: 4,052 – 4,054 (Fibo 0.618 Confluence)
Stop Loss: 4,044
Take Profit: 4056 - 4060 - 4065 - 4070 - 4080 - 4090 - ???
Summary:
Gold’s sharp drop after a new ATH signals a short-term correction phase while the broader bullish trend stays intact.
A pullback toward 4,052 or even 4,000 could attract buy-side liquidity before any recovery.
Keep an eye on 4,135 for a potential retest before continuation.
📊 What’s your view — is this just a healthy retracement or the start of a deeper correction?
👉 Follow MMFLOW TRADING for precise intraday setups and structure-based analysis.

Breakout and Breakdown Trading1. Introduction to Breakout and Breakdown Trading
In financial markets, price movement is influenced by the forces of supply and demand. Traders identify key levels where these forces tend to converge and then anticipate movements when price “breaks out” above a resistance level or “breaks down” below a support level.
Breakout Trading: A strategy that involves entering a position when the price moves above a defined resistance level with the expectation of further upward momentum.
Breakdown Trading: The opposite approach, where traders enter a position when the price falls below a support level, anticipating a continuation of downward movement.
These strategies are rooted in technical analysis, relying on historical price action and market psychology rather than fundamental factors.
2. Core Concepts
2.1 Support and Resistance
Support: A price level where buying interest is strong enough to prevent further decline. It acts as a “floor.”
Resistance: A price level where selling pressure is strong enough to prevent further increase. It acts as a “ceiling.”
Breakouts occur when price surpasses resistance, while breakdowns happen when price falls below support.
2.2 Volume
Volume is a crucial confirmation tool. A breakout or breakdown is considered strong if accompanied by increased trading volume, as this indicates genuine market participation rather than a false move.
2.3 Price Consolidation
Before breakouts or breakdowns, prices often consolidate in tight ranges. These consolidations can be:
Rectangles
Triangles
Flags and pennants
Understanding the consolidation pattern helps traders anticipate the direction and magnitude of the breakout or breakdown.
3. Types of Breakouts and Breakdowns
3.1 Horizontal Breakouts
Occur when price breaks a clearly defined horizontal support or resistance.
Example: A stock repeatedly fails to move above $100. A breakout above $100 signals upward momentum.
3.2 Trendline Breakouts
Occur when price crosses a diagonal trendline drawn along highs or lows.
Uptrend breakout: Price breaks above a descending trendline.
Downtrend breakdown: Price falls below an ascending trendline.
3.3 Pattern-Based Breakouts
Certain chart patterns often precede strong breakouts or breakdowns:
Triangles: Symmetrical, ascending, or descending triangles
Rectangles: Price moves within a horizontal range
Flags and Pennants: Continuation patterns after a sharp move
Pattern-based breakouts tend to offer predictable price targets based on pattern dimensions.
4. Breakout Trading Strategy
4.1 Identifying a Breakout
Look for a well-defined resistance level or consolidation pattern.
Confirm breakout using volume: higher than average volume indicates strong buying interest.
Check for fundamental or news catalysts that may strengthen the breakout.
4.2 Entry Techniques
Aggressive Entry: Enter immediately when price crosses resistance.
Conservative Entry: Wait for a candle to close above resistance to confirm breakout.
4.3 Stop Loss Placement
Below the breakout point or recent swing low.
Helps protect against false breakouts.
4.4 Profit Targets
Use pattern-based targets: For triangles or rectangles, project the height of the pattern above breakout.
Use trailing stops to capture extended moves without exiting too early.
5. Breakdown Trading Strategy
5.1 Identifying a Breakdown
Look for a strong support level or consolidation pattern.
Check for rising selling volume: heavy selling confirms breakdown.
Identify any macroeconomic or sector-specific events that may accelerate declines.
5.2 Entry Techniques
Aggressive Entry: Enter immediately as the price breaks support.
Conservative Entry: Wait for a candle close below support to reduce risk.
5.3 Stop Loss Placement
Above the breakdown point or recent swing high.
Protects against false breakdowns where the price quickly recovers.
5.4 Profit Targets
Pattern-based projections: Use the height of the consolidation pattern subtracted from the breakdown point.
Trailing stops help lock in gains in volatile markets.
6. Psychological Aspects of Breakout and Breakdown Trading
Trading breakouts and breakdowns is as much psychological as technical:
6.1 Fear of Missing Out (FOMO)
Many traders enter too early due to FOMO, risking false breakouts.
Patience and confirmation reduce this risk.
6.2 Market Sentiment
Breakouts often occur when sentiment shifts from neutral or negative to bullish.
Breakdowns often coincide with panic selling or negative news.
6.3 Confirmation Bias
Traders may see a breakout or breakdown where none exists.
Strict adherence to predefined rules prevents bias-driven errors.
7. Common Mistakes and Risks
7.1 False Breakouts/Breakdowns
Occur when price briefly crosses support or resistance but reverses immediately.
Mitigation: Wait for candle close, confirm with volume, and consider broader market trend.
7.2 Overleveraging
Using excessive margin amplifies losses if breakout fails.
Always use proper risk management (1–2% of capital per trade).
7.3 Ignoring Market Context
Breakouts in choppy or low-liquidity markets are less reliable.
Always consider overall market trend, sector strength, and macroeconomic factors.
8. Tools and Indicators for Confirmation
8.1 Volume Indicators
On-Balance Volume (OBV)
Volume Oscillator
8.2 Momentum Indicators
RSI (Relative Strength Index): Confirms overbought or oversold conditions
MACD (Moving Average Convergence Divergence): Identifies trend shifts
8.3 Moving Averages
Help confirm breakout/breakdown trend direction.
Common strategy: Wait for price to cross above/below 20-day or 50-day moving average.
9. Examples of Breakout and Breakdown Trading
9.1 Breakout Example
Stock consolidates between $50–$55.
Breaks above $55 on heavy volume, closing at $56.
Entry: $56
Stop Loss: $54.50 (below consolidation)
Target: $61 (height of consolidation added to breakout level)
9.2 Breakdown Example
Stock trades between $70–$65.
Falls below $65 with high volume, closing at $64.
Entry: $64
Stop Loss: $66 (above consolidation)
Target: $59 (height of consolidation subtracted from breakdown level)
10. Advanced Techniques
10.1 Pullback Entry
After breakout, price often retests the breakout level.
Provides lower-risk entry opportunities.
10.2 Multiple Timeframe Analysis
Confirm breakout on higher timeframe (daily or weekly) while entering on lower timeframe (hourly or 15-min).
Reduces the likelihood of false breakouts.
10.3 Combining with Fundamental Analysis
Breakouts accompanied by strong earnings, positive news, or macroeconomic support have higher reliability.
Breakdowns following negative news or sector weakness confirm downward trend.
Conclusion
Breakout and breakdown trading is a cornerstone of technical trading, blending market psychology, price action, and disciplined risk management. While the concept is simple—buy above resistance and sell below support—the execution requires attention to volume, patterns, market context, and trading psychology. Traders who master these strategies can capitalize on strong momentum moves and manage risk effectively.
Successful breakout and breakdown trading hinges on patience, confirmation, proper entry and exit points, and disciplined risk management. By combining technical indicators, volume analysis, and pattern recognition, traders can improve the probability of capturing meaningful market moves while avoiding the pitfalls of false signals.
Gold 1H – Price Reaction Ahead of U.S. Retail Sales & Fed RemarkXAUUSD – Intraday Trading Plan | by Ryan_TitanTrader
📈 Market Context
Gold is trading around the ₹4,110 mark, consolidating after a strong impulsive rally earlier this week.
Traders are now shifting focus to U.S. Retail Sales data and a series of Federal Reserve remarks due later today — both key drivers that could influence near-term expectations for the next rate decision.
After last week’s soft inflation signals, gold initially extended higher, but rising Treasury yields and cautious sentiment ahead of today’s macro releases have slowed momentum.
Any hawkish Fed tone or stronger consumer spending data could weigh on XAUUSD, triggering a liquidity sweep from the premium zones before the next accumulation phase begins.
🔎 Technical Analysis (1H / SMC Style)
• Structure shows a confirmed BOS on lower timeframes, signaling the end of the previous impulsive leg.
• Price currently sits within a Mitigation Zone (4117–4110), reacting to prior imbalance after a clean sweep of internal liquidity.
• The Premium Liquidity Zone (4217–4215) aligns with a Rejection Block and is likely to act as a short-term Sell Zone.
• Below, the 4056–4058 area marks a Buy-Side Support, overlapping with a previous ChoCH and internal discount OB.
• Expect a short-term sell reaction from premium zones before a possible bullish mitigation bounce off support.
🔴 Sell Setup: 4217–4215
SL: 4224
TP targets: 4200 → 4175 → 4160
🟢 Buy Setup: 4056–4058
SL: 4050
TP targets: 4070 → 4090 → 4100+
⚠️ Risk Management Tips
• Wait for M15 ChoCH / BOS confirmation before executing either setup.
• Be cautious during Fed remarks — volatility spikes are common around liquidity levels.
• If price reacts impulsively from 4217 with displacement, partial shorts are favored.
• Conversely, if 4056 holds and forms clean bullish structure, it could serve as the base for the next expansion leg.
✅ Summary
Gold is likely to engineer a liquidity grab in the premium zone (4217–4215) before retracing into the mitigation area near 4056–4058, where smart money may accumulate long positions.
The day’s direction will hinge on how markets interpret upcoming U.S. Retail Sales data and Fed tone — expect volatility and false breaks before the true directional move forms.

XAU/USD – Liquidity Cleared, Gold Reloads for the Next Breakout🔍 Market Context
This morning, gold price (XAU/USD) experienced a classic liquidity sweep :
The price surpassed the previous high of 4058 , touched 4060 , wicked strongly , and short-term corrected – a textbook “liquidity hunt” by major funds.
After this drop, the price recovered back to the old ATH zone (4055 – 4060) .
This indicates that short-term sellers have weakened , and buyers are reclaiming the crucial structure zone .
Therefore, selling strategy is no longer optimal , instead, the market is preparing for a re-accumulation – next breakout.
💎 Technical Analysis
Current ATH: 4060 USD
Previous High: 4058 USD
This morning's liquidity sweep “cleared out” liquidity above, paving the way for a re-accumulation phase before the next rise.
The zone 4048 – 4052 is acting as a retest zone – if it holds, this could be the “launchpad” for a breakout to higher price zones.
Overall Structure: still bullish , no signs of medium-term reversal.
⚙️ Key Price Zones
Retest Zone: 4048 – 4052 → support zone after the sweep, where the price might bounce back.
Breakout Zone: 4065 – 4070 → zone confirming buyers regain dominance.
Extended Target: 4090 – 4100 USD.
Invalidation Zone: below 4040 USD → if breached, the short-term bullish structure will weaken.
📈 Trading Scenarios
1️⃣ Buy Continuation Scenario – Buy with the main trend
Wait for the price to retest the 4048 – 4052 zone , observe bullish candle reactions or confirmation signals (Engulfing, Rejection).
Open a buy order upon confirmation of holding the support zone.
Target: 4065 → 4090 USD.
Stop Loss: below 4040 USD.
➡️ This is a trend-following scenario, with the highest probability when the market has completed the liquidity sweep and is re-accumulating.
2️⃣ Buy Breakout Scenario – Buy on confirmed breakout
If the price breaks and closes above 4065 , it signals that major funds have returned.
Open buy stop or limit retest breakout around 4065 – 4070.
Extended Target: 4090 → 4100 USD.
Stop Loss: below 4050 USD.
➡️ This scenario suits momentum traders, avoiding the risk of “fake breakout” by waiting for clear confirmation.
⚠️ Risk Management
Do not sell against the trend at the ATH zone, as liquidity above has been taken.
Maintain reasonable volume when trading around the peak zone.
Prioritize buying when there is confirmation of the bullish structure holding the 4050 zone .
💬 Conclusion
This morning's liquidity sweep has shaken out weak hands , while helping gold pave the way for the next rise .
Currently, the price is re-accumulating around the old peak zone 4055 – 4060 , and if the zone 4048 – 4052 continues to hold, there is a high possibility that gold will break out to the 4090 – 4100 USD zone in the upcoming sessions.
👉 Reasonable Strategy:
Wait to buy at the support zone or buy when the price breaks above 4065.
Avoid selling against the trend now – the risk is very high as major funds have shifted to the accumulation phase.

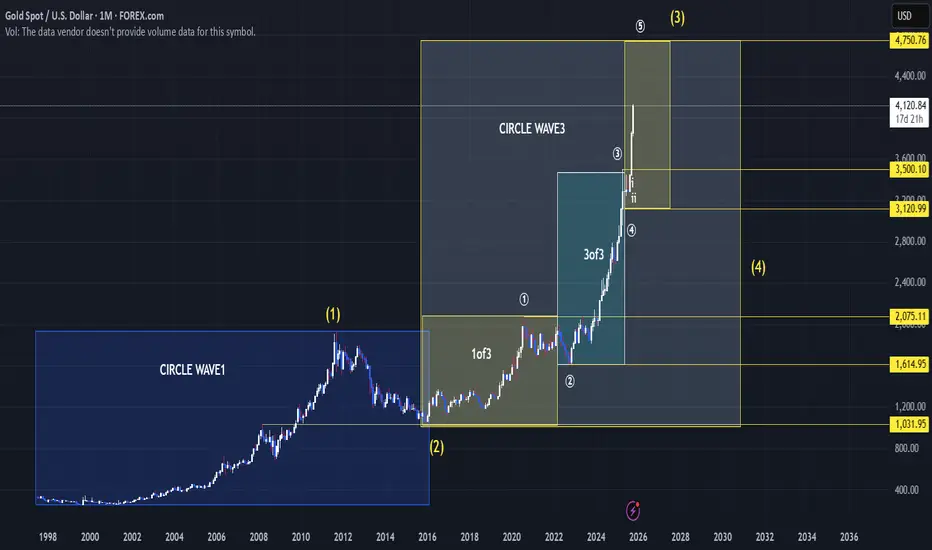
Elliot wave Gold price predictionIn my opinion that gold can hit 4700+ in next few months, as you can see my chart that circle wave 3 is going on and we are in 3 of 3rd wave right now so may be possible price will take pull back after hit 4230 or nearest it and wave 4of 3 will unfold after correction price will take bounce back near 3750 to 3700 then price will complete 5 of 3 and circle wave 3 should complete. its my idea not trading advise.
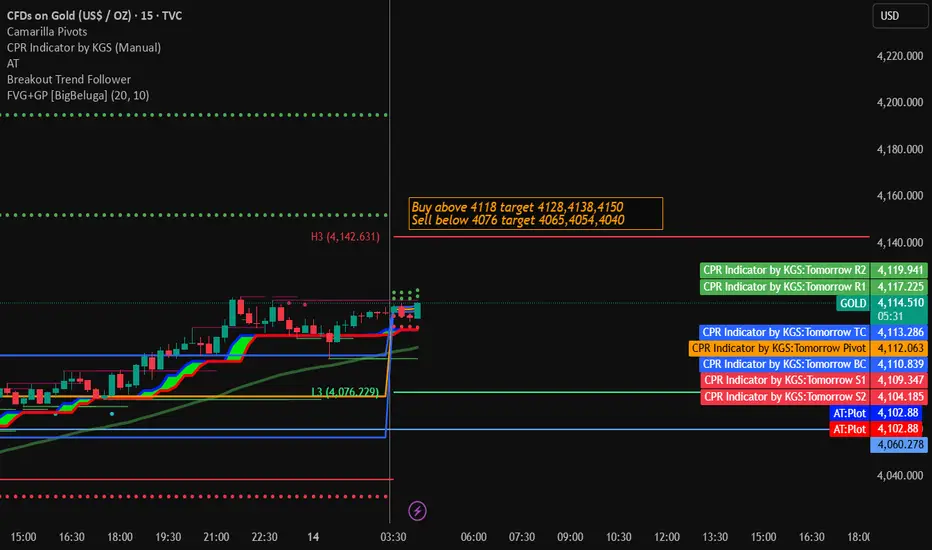
Gold Intra day Trading Strategy for 14th October 2025💰 GOLD INTRADAY STRATEGY – 5 MIN CHART SETUP 💰
(For Educational Purposes Only)
📈 BUY Setup
🔹 Entry: Buy above the high of the 5-minute candle that closes above $4118
🎯 Targets:
1st Target → $4128
2nd Target → $4138
3rd Target → $4150
🛑 Stop-Loss: 3 candles below your entry candle’s low
📉 SELL Setup
🔹 Entry: Sell below the low of the 5-minute candle that closes below $4076
🎯 Targets:
1st Target → $4065
2nd Target → $4054
3rd Target → $4040
🛑 Stop-Loss: 3 candles above your entry candle’s high
⚙️ Trading Tips:
⏱ Trade only after candle close confirmation on the 5-min chart.
💡 Always manage your risk and use a fixed position size.
📊 Wait for volume confirmation and trend direction before entry.
❌ Avoid trading during high-volatility news events.
⚠️ DISCLAIMER:
This setup is for educational and research purposes only.
Trading in Gold or any financial market involves significant risk.
You may lose your capital.
Please do your own analysis or consult a financial advisor before taking any trade.
Gold trading strategy | October 13-14✅ From the 1-hour chart, gold has pulled back from the 4117 high and is currently trading between MA5 and MA10, showing a slowdown in short-term momentum.
The moving average system shows MA5 starting to turn downward, while MA10 and MA20 remain upward, indicating short-term correction pressure but strong medium-term support.
The Bollinger upper band near 4117 is acting as resistance, while the middle band around 4077 serves as the key short-term support. If the price stabilizes above this level, a short-term rebound is likely.
🔴 Resistance Levels: 4115–4120
🟢 Support Levels: 4070–4060
✅ Trading Strategy Reference:
🔰 If gold pulls back to the 4060–4070 zone and holds steady, consider building long positions in batches, targeting 4105–4120.
🔰 If gold faces repeated resistance around 4120–4130 and momentum weakens, consider light short positions, targeting 4085–4070, with a stop loss above 4135.
🔥Trading Reminder: Trading strategies are time-sensitive, and market conditions can change rapidly. Please adjust your trading plan based on real-time market conditions.

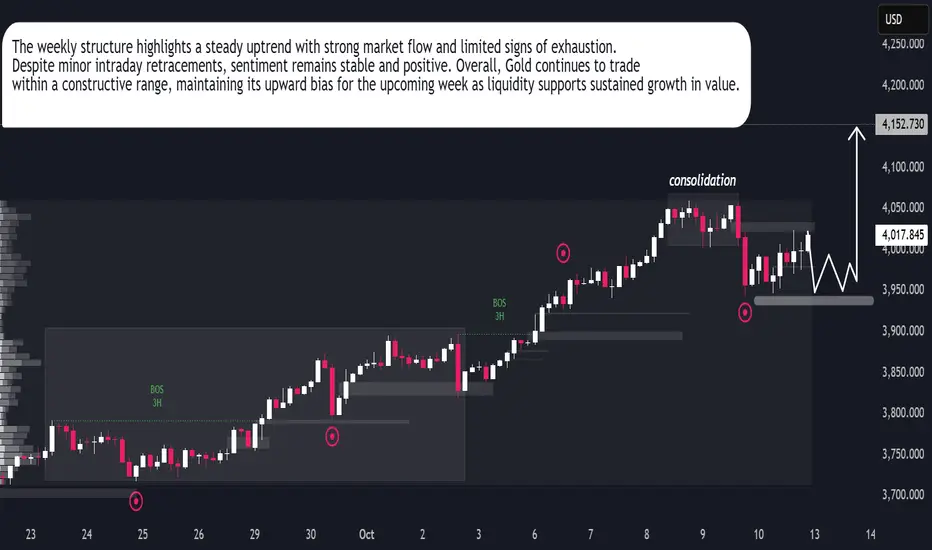
XAUUSD | Bulls Maintain Weekly ControlGold continues to display firm momentum as investor confidence remains stable despite short-term fluctuations. The latest weekly candle structure shows price holding within a steady consolidation range, signaling accumulation rather than weakness. Market behavior suggests large participants are preparing for another expansion phase after absorbing liquidity in the lower zones.
Institutional interest remains evident, with consistent buying pressure observed on dips, indicating sustained optimism for further growth. The current behavior aligns with broader market sentiment favoring safe-haven assets amid global uncertainty. Overall, Gold retains its dominance as capital flows stay supportive of the uptrend, positioning the metal for renewed strength in the upcoming sessions.
gold📊 Gold Daily — Bullish Momentum in Focus
Gold has been climbing steadily since mid-2024, forming a clean ascending channel.
The recent surge since September came with rising volume — a strong signal of increased buying interest and momentum.
Between June and August, we saw healthy consolidation with lower volume, suggesting accumulation before the breakout.
Now, all eyes are on the upper channel resistance.
If price breaks above it with strong volume, the rally could extend toward $4,200 and beyond — targeting measured moves or extrapolated resistance zones.
But if price gets rejected at the top, a correction may follow.
Key support levels to watch:
🔸 $3,800 (mid-channel)
🔸 $3,400 (lower boundary)
This setup offers a clear roadmap for both breakout traders and risk-aware swing strategies.
#Gold #TechnicalAnalysis #PriceAction #TradingSetup #VolumeAnalysis #MarketStructure #Commodities #LearningInPublic

Gold 1H – Potential Liquidity Sweep Before Fed SpeechesXAUUSD – Intraday Trading Plan | by Ryan_TitanTrader
📈 Market Context
Gold remains steady near ₹4,065, as traders eye upcoming U.S. PPI data and Fed officials’ speeches later today for new guidance on the inflation outlook.
The recent rise in Treasury yields has slightly capped gold’s upside momentum, but underlying safe-haven demand persists amid ongoing geopolitical and economic uncertainty.
If the PPI print shows softer inflation, gold could attract renewed buying; however, a hotter reading may spark another liquidity sweep lower before any sustained rally.
🔎 Technical Analysis (1H / SMC Style)
• ChoCH confirmed at 4060+, showing potential exhaustion in the current short-term uptrend.
• Price tapped the premium zone (4080–4078), aligning with previous liquidity and imbalance — ideal for a short-term sell setup.
• A BOS formed at 4017, opening the way for retracement toward the discount zone (3999–3997).
• The 3997–3999 area is a strong demand zone, overlapping with a prior ChoCH and liquidity void — a potential reversal area for bulls.
• Expect a liquidity grab at 3990 before a bullish reaction if structure holds.
🔴 Sell Setup: 4080–4078
SL: 4087
TP targets: 4040 → 4015 → 4000
🟢 Buy Setup: 3999–3997
SL: 3990
TP targets: 4035 → 4060 → 4100+
⚠️ Risk Management Tips
• Wait for M15 ChoCH / BOS confirmation before triggering entries.
• Avoid over-leverage during Fed speech hours — price may fake out around liquidity levels.
• If price sweeps 4080 liquidity and rejects impulsively, partial short entries are favored.
• Conversely, if 3997 holds firm with strong bullish structure, watch for re-entry confirmation to ride the next expansion.
✅ Summary
Gold is currently playing within a premium-to-discount framework, as smart money may engineer a sweep of 4080 liquidity before driving price down toward 3997–3999 to collect buy-side orders.
After that, a strong bullish reaction is expected from the demand zone if macro conditions (like soft PPI or dovish Fed tone) support it.
Stay patient — structure confirmation is key before entering either direction.

Gold 95 points profit booked , bought at 3995 booked at 4090Gold booked 95 points profit.
Buy on dip will be continued
How My Harmonic pattern projection Indicator work is explained below :
Recent High or Low :
D-0% is our recent low or high
Profit booking zone ( Early / Risky entry) : D 13.2% -D 16.1 % is
range if break them profit booking start on uptrend or downtrend but only profit booking, trend not changed
SL reversal zone (Safe entry ) : SL 23.1% and SL 25.5% is reversal zone if break then trend reverse and we can take reverse trade
Target : T1, T2, T3, T4 and .
Are our Target zone
Any Upside or downside level will activate only if break 1st level then 2nd will be active if break 2nd then 3rd will be active.
Total we have 7 important level which are support and resistance area
Until , 16% not break uptrend will continue if break then profit booking will start.
If break 25% then fresh downtrend will start then T1, T2,T3 will activate
1,3,5,10,15,20 minutes are short term levels.
30 minutes 60 minutes , 2 hours,3 hours, ... 1 day and 1 week chart positional and long term levels

Gold breaking new highs has become the norm, 4100 is within reacGold continues its bullish trend, breaking new highs as expected. Breaking new highs has become the norm for gold recently. So far, gold has reached a high of 4080 and is fluctuating around it. It is likely to reach 4100 tonight, and the current level of 4100 is within reach. Breaking new highs from above has become commonplace. Don't expect bears to hold out. After all, bulls are the main force. Looking at the hourly chart, various indicators are driving the bulls, and international news is also positive for gold prices. Therefore, we must maintain a bullish outlook for gold. Mr. Tian will also prioritize long positions. Keep an eye on the support at 4000. Trading strategies should focus on buying on dips.
Based on the 4-hour market trend, short-term support is currently at 4095-4100, with a focus on key support at 4075-4085. The bulls are rallying strongly and there is no end in sight. Trading strategies should prioritize buying on dips. In the intermediate range, be cautious and follow orders carefully, patiently waiting for key entry points. I will provide detailed trading strategies during the trading session, so stay tuned.
Gold Trading Strategy:
1. Buy gold at 4070-4080. Add to long positions if it dips back to 4060-65. Stop loss at 4060. Target at 4130-4150. Hold if it breaks through.

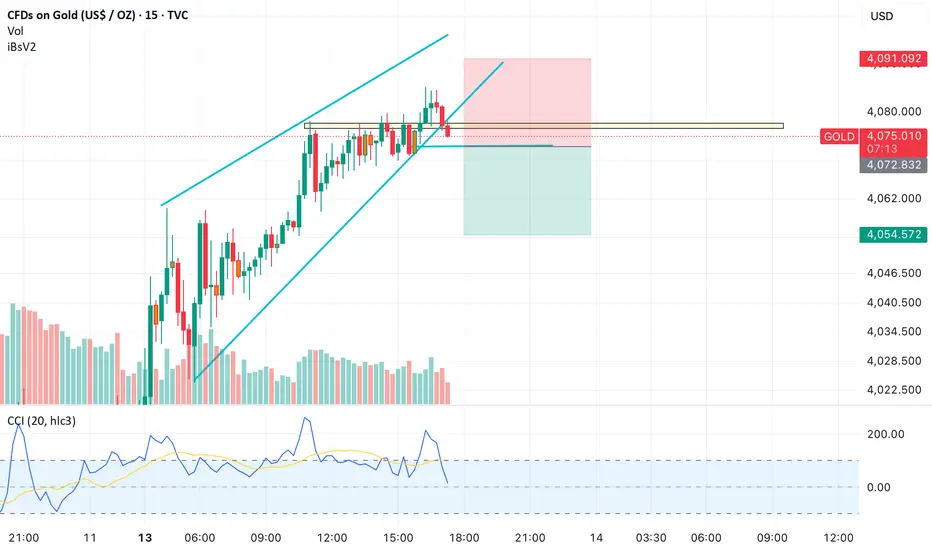
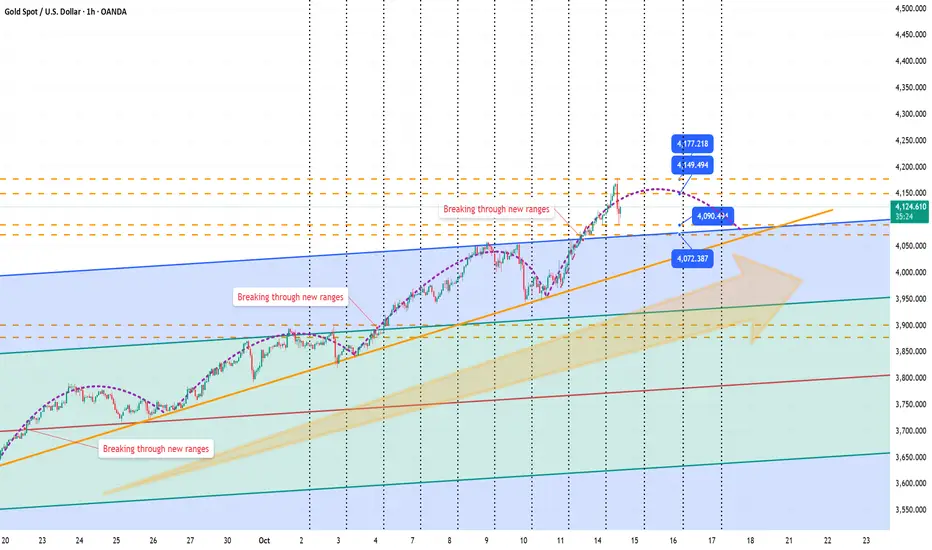
Gabling in Gold?
Technical View:
Gold has been moving within a rising channel, but the recent rejection from the upper boundary near $4,078 indicates potential exhaustion. The price has now broken below the immediate channel support, signaling the start of a corrective phase.
The CCI indicator has rolled over from the overbought zone, confirming loss of upward momentum. Volume analysis suggests weakening buying interest on each successive rally.
This structure favors a short-term pullback if $4,072 breaks decisively.
Macro View:
Broader macro sentiment remains mildly negative for gold in the near term:
• US Dollar Index (DXY) has regained strength, supported by higher US Treasury yields ahead of key inflation and retail sales data this week.
• Market expectations of an extended Fed pause are giving way to speculation of a “higher-for-longer” stance, keeping real yields positive — a headwind for non-yielding assets like gold.
• ETF inflows remain tepid, suggesting institutional money is cautious at current high levels.
• Additionally, oil price stability and easing geopolitical risk premium have reduced safe-haven demand for gold.
Together, these factors point to limited near-term upside for bullion.
Trade Setup:
• Action: Initiate short positions below $4,072 only on breakdown confirmation.
• Stop Loss: $4,091 (closing basis)
• Target 1: $4,055
• Target 2: $4,030
• Extended Target: $4,000
Execution Note:
The trade will be executed strictly as per the chart levels. It is possible that the entry level may not trigger today, in which case the setup becomes invalid and should be re-evaluated. No trade should be taken without price confirmation below $4,072.
Note:
Gold remains technically stretched, and the pattern breakdown aligns with a consolidative phase in global commodities. Short-term sentiment is tilting bearish unless the metal sustains above $4,091 on volume-backed strength.