Elliott Wave Analysis – XAUUSD 09/10/2025
________________________________________
🔹 1. Momentum
D1:
The current momentum is turning downward.
We need to wait for today’s D1 candle to close for confirmation.
➡️ If the daily candle closes bearish, it may mark the beginning of a deep and strong corrective wave.
H4:
H4 momentum is about to enter the oversold zone, suggesting the possibility of:
• A short-term bullish retracement, or
• A sideways consolidation phase before the next major move.
H1:
H1 momentum is approaching the overbought zone, indicating a potential short-term bearish correction ahead.
________________________________________
🔹 2. Wave Structure
Overview:
In the previous analysis, the COT report indicated that the market is in an overly optimistic phase — a warning sign to stay cautious with long positions or late entries.
D1:
• The yellow wave 5 has already broken above the channel (throw-over), which is a typical sign of a final impulsive phase.
• When wave 5 extends strongly, the following correction (wave 4) often drops sharply, erasing most of the previous gains.
➡️ Therefore, it’s time to prioritize a defensive strategy and avoid chasing tops.
H4:
• Price has moved beyond the upper boundary of the channel, making the exact top of wave 5 hard to pinpoint.
• We should monitor price reaction when it returns inside the channel — if price fails to make a new high when H4 momentum reaches the overbought zone, it will likely confirm the completion of wave 5.
H1:
• The wave count has been slightly adjusted compared to the previous plan.
• Within the black wave 5, there is now a clear 5-wave yellow substructure.
• The recent decline has broken below the lower trend channel and the previous wave 4 low — an early sign of a potential wave 5 top.
⚠️ The upcoming correction could be steep and fast, making this an important time to prepare for risk management and trade planning.
________________________________________
🔹 3. Outlook & Trading Plan
All timeframes (D1 – H4 – H1) are showing an extended wave 5, but there’s still no clear confirmation of a top.
Hence, we should trade cautiously and manage positions tightly.
Currently, price has broken below the lower channel and wave 4 yellow, with a liquidity area near 4038 — this offers a good opportunity to open a small sell position to anticipate a potential reversal.
Trading Plan:
Sell zone (small lot): 4037 – 4039
Stop loss: 4048
Take profit: 3985
Trade ideas

XAU/USD: Targeting $4,100! Where to Buy Before the FOMC Minutes?Hello TradingView community! 🚀
Gold (XAU/USD) continues to demonstrate incredible strength, consistently breaking past old highs and forming a solid upward price channel. This robust uptrend is not only technically reinforced but also awaits a potential catalyst from today's significant fundamental news.
In this analysis, we will combine two crucial perspectives: an in-depth look at the technical charts to identify optimal entry points, and an examination of the key fundamental event that could significantly impact Gold prices during the US session.
1. Fundamental Perspective: All Eyes on the FOMC Minutes
Today's market highlight, Wednesday, October 8, is the release of the FOMC Meeting Minutes at 2:00 PM ET
Why is this important? This document provides a detailed record of the latest policy meeting of the US Federal Reserve (FED) in September. Traders will scrutinise the text for any hints about the future interest rate path.
Potential scenarios:
"Dovish" Tone: If the minutes reveal FED officials' concerns about economic growth and the possibility of further rate cuts, the US Dollar might weaken. This would create a strong push for Gold (XAU/USD), potentially driving the next price surge.
"Hawkish" Tone: If the minutes emphasise that inflation remains a concern and the FED is not in a hurry to cut rates, the USD might see a short-term recovery, causing Gold to have a corrective dip.
This event is a top catalyst for volatility. Our strategy is to prepare technical zones to capitalise on the market's reaction.
2. Technical Analysis: Detailed Trading Plan
The bullish structure on the 2H timeframe is undeniable. Prices are creating a series of higher highs, confirmed by each "BoS" (Break of Structure), signalling that the Buyers are in full control. Here are the key zones to watch:
Potential Buy Zones (Key Points):
FVG Zone ($4,004): The nearest support is this Fair Value Gap, an area of price imbalance that the market often seeks to fill. Prices may retest this area before or during the news release.
"Buy Break BoS" Zone ($3,981): This is the nearest swing high that has been broken. Now it has turned from resistance into a crucial support level. This zone offers a solid entry point if prices correct slightly deeper.
"Bullish Order Block" Zone ($3,951): This is the last major "stronghold" of the Buyers—a powerful buy order block that initiated the latest push wave. This is an ideal area to look for buy orders if the market experiences a strong liquidity sweep downwards.
Upside Targets:
Short-term Target (Scalping): $4,070 - This level coincides with the 0.786 Fibonacci level.
Main Target: "Liquidity Sell" Zone at $4,103. This is a large "liquidity pool" where the Sellers' stop-loss orders are likely concentrated. Smart money often drives prices to such areas.
Strategy Summary
Main Trend: Bullish.
Core Strategy: Look for "Buy the dip" opportunities at the key support zones mentioned.
Critical Timing: Be cautious around the FOMC Minutes release (18:00 UTC). Volatility can be high, and the market may whip in both directions to sweep stop-losses before following the main trend.
Pro Tip: Patience is key. Waiting for prices to pull back to a confirmed support zone will provide a much better Risk/Reward ratio than chasing the market at the top.
WHAT'S YOUR VIEW?
How do you think Gold will react to today's FOMC minutes? And where are you looking to place your buy orders—at the FVG zone $4,004, the BoS level $3,981, or are you patiently waiting for the Order Block $3,951?
Share your views in the comments below!
👇 Don't forget to leave a Like 👍 and Follow the channel for the latest XAU/USD analysis updates!

GOLD: Continuing Uptrend Structure, Target 4090 Approaching LiamTrading – GOLD: Continuing Uptrend Structure, Target 4090 Approaching
Hello everyone,
Gold and US stocks are setting new records together, but don't forget — strong sell-offs often appear when everyone believes prices can only rise.
Currently, gold maintains a sustainable uptrend structure, with each subsequent low higher than the previous one, confirming a clear trend on the H1–H4 timeframe.
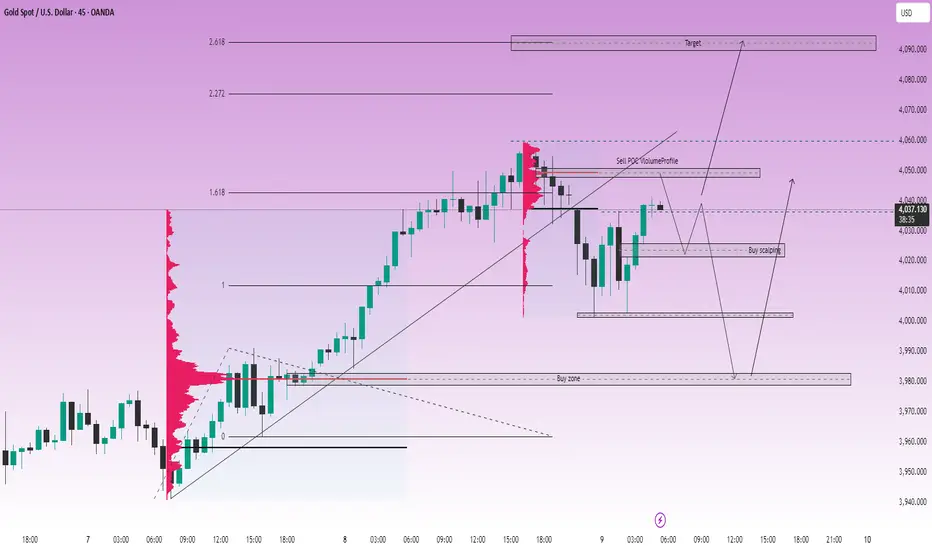
📊 Technical Analysis (Chart 45m – XAUUSD)
The price structure remains a clear Higher High – Higher Low, indicating that buyers are still in control of the market.
Key liquidity zones are around:
🔹 4050–4060 (resistance – POC Volume Profile)
🔹 4020–4025 (temporary support zone – confluence of Fibo 0.618)
🔹 3980 (technical bottom, strong previous liquidity zone)
The upward target according to Fibonacci Extension is currently in the 4090 zone, corresponding to the 2.618 extension level — likely to become a major profit-taking area for buyers.
🎯 Today's Trading Scenarios
Short-term Sell (based on resistance reaction):
📍 4048–4050
🛑 SL: 4055
🎯 TP: 4030 – 4018 – 4005 – 3980
Buy scalping:
📍 4022–4024
🛑 SL: 4017
🎯 TP: 4030 – 4045 – 4060 – 4080
Buy swing (trend-following):
📍 3980–3982
🛑 SL: 3975
🎯 TP: 3995 – 4010 – 4025 – 4040 – 4060
🧭 Fundamental & Market Sentiment View
According to the FOMC minutes from 16–17/9, most Fed officials believe that continuing to cut interest rates this year is appropriate.
This is the first time since 2020 that the Fed has officially reduced the interest rate by 0.25%, bringing the range down to 4.75% – 5.00%.
→ Cheap money + safe-haven sentiment continue to be the main drivers pushing gold higher.
However, with gold and stocks both reaching peaks, the risk of technical corrections may occur when prices hit major liquidity zones.
📌 Conclusion
Gold is still in a stable uptrend, with a short-term target towards 4090 USD/oz.
However, watch the liquidity zones around 4050–4060 and 4000–4025 to optimize entry points, avoiding FOMO when prices are already in high zones.
👉 I will continue to update details for each trading session.
Follow me to not miss the earliest gold scenarios!
Elliott Wave Analysis – XAUUSD 09/10/2025
________________________________________
🔹 1. Momentum
D1:
The current momentum is turning downward.
We need to wait for today’s D1 candle to close for confirmation.
➡️ If the daily candle closes bearish, it may mark the beginning of a deep and strong corrective wave.
H4:
H4 momentum is about to enter the oversold zone, suggesting the possibility of:
• A short-term bullish retracement, or
• A sideways consolidation phase before the next major move.
H1:
H1 momentum is approaching the overbought zone, indicating a potential short-term bearish correction ahead.
________________________________________
🔹 2. Wave Structure
Overview:
In the previous analysis, the COT report indicated that the market is in an overly optimistic phase — a warning sign to stay cautious with long positions or late entries.
D1:
• The yellow wave 5 has already broken above the channel (throw-over), which is a typical sign of a final impulsive phase.
• When wave 5 extends strongly, the following correction (wave 4) often drops sharply, erasing most of the previous gains.
➡️ Therefore, it’s time to prioritize a defensive strategy and avoid chasing tops.
H4:
• Price has moved beyond the upper boundary of the channel, making the exact top of wave 5 hard to pinpoint.
• We should monitor price reaction when it returns inside the channel — if price fails to make a new high when H4 momentum reaches the overbought zone, it will likely confirm the completion of wave 5.
H1:
• The wave count has been slightly adjusted compared to the previous plan.
• Within the black wave 5, there is now a clear 5-wave yellow substructure.
• The recent decline has broken below the lower trend channel and the previous wave 4 low — an early sign of a potential wave 5 top.
⚠️ The upcoming correction could be steep and fast, making this an important time to prepare for risk management and trade planning.
________________________________________
🔹 3. Outlook & Trading Plan
All timeframes (D1 – H4 – H1) are showing an extended wave 5, but there’s still no clear confirmation of a top.
Hence, we should trade cautiously and manage positions tightly.
Currently, price has broken below the lower channel and wave 4 yellow, with a liquidity area near 4038 — this offers a good opportunity to open a small sell position to anticipate a potential reversal.
Trading Plan:
Sell zone (small lot): 4037 – 4039
Stop loss: 4048
Take profit: 3985

Gold Neowave Update | 09/10/2025Namaskaram Everyone
Welcome to intelligent investor, we provide market insights by synchronising and combining all the price action waves from different time frames and gives you single trend.
Previous Video

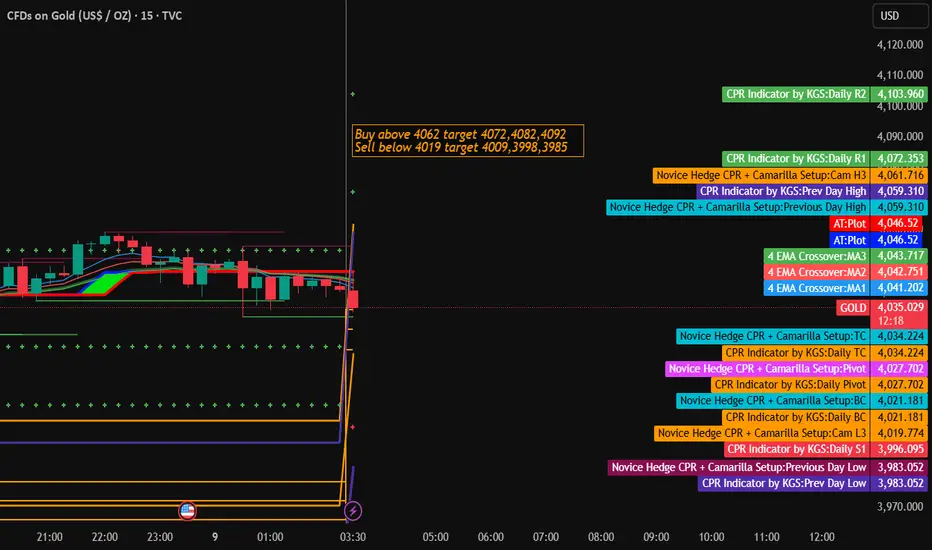
Gold Trading Strategy for 09th October 2025🎯 GOLD INTRADAY SETUP
🟢 BUY Setup:
💰 Buy Above: $4062 (1-hour candle close above this level)
🎯 Targets:
1️⃣ $4072
2️⃣ $4082
3️⃣ $4092
🔴 SELL Setup:
💰 Sell Below: $4019 (1-hour candle close below this level)
🎯 Targets:
1️⃣ $4009
2️⃣ $3998
3️⃣ $3985
⚠️ Disclaimer:
📉 This analysis is for educational purposes only. It is not a buy or sell recommendation. Always conduct your own analysis and use proper risk management before trading.
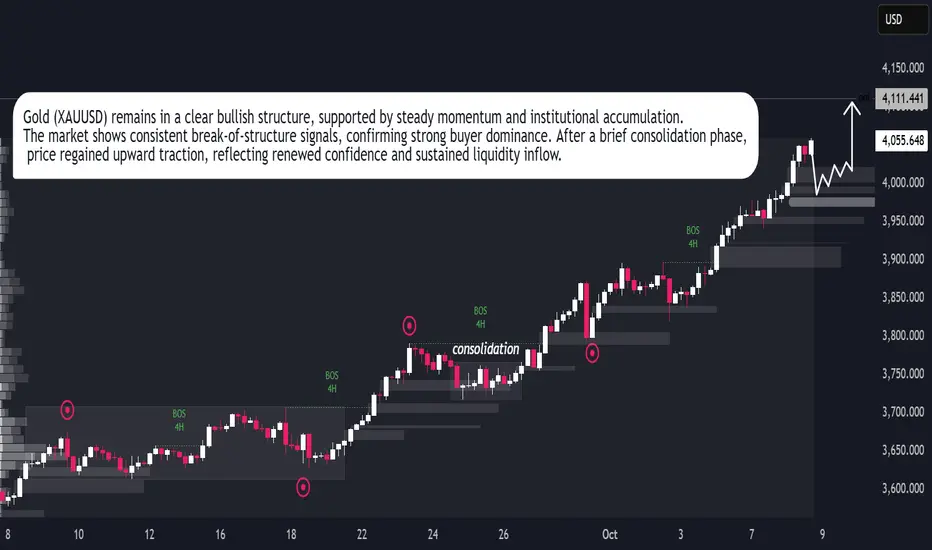
Gold Price Rally Sustains – Market Eyes Next Breakout PointGold (XAUUSD) continues to follow a strong bullish trajectory, confirming consistent market confidence and institutional participation. The chart structure reveals clear liquidity shifts and a steady series of bullish break-of-structure (BOS) points, suggesting that buyers remain in firm control. After a brief consolidation phase, gold resumed upward momentum, supported by sustained volume and steady market sentiment.
The current trend indicates controlled buying pressure rather than speculative spikes, showing the market’s preference for stability as price builds toward higher levels. If momentum maintains its present pace, gold could extend gains in the short term while maintaining its established bullish rhythm across the higher timeframe outlook.

Gold Makes History, Climbs to $4050 Despite Dollar Resilience.Strong Bullish Rally Takes Gold to Historic High $4050
.Dollar Index shows resilience, rises to 98.98
.Gold shows mild retracement consolidating above $4032
.Markets await FOMC meeting minutes.
Fundamental Drivers:
With no news of agreement in Congress for solution in US Government shutdown, political and fiscal uncertainties take centre stage.
Political turbulence in France adds to global concerns already affecting investor sentiments.
Continuous Gold buying by global central banks as well as ETF inflows creating strong structural demand and triggering FOMO driven rally.
Markets abuzz with talks of massive bubble building up in leading stocks and Indices.
Growing expectations of another rate cut by Federal Reserve in this month and also in December.
Safe haven demand causing Gold rush in run to safety boosting prices to record rally.
Technical Drivers:
$4050 acts as minor hurdle which bulls need to clear turning in to support for advance towards next leg higher $4068 followed by $4083 while major upside target sits at 2.618% Fibonacci extension aligned with $4114
Break below immediate support $4032 exposes next support $4015 followed by retracement to $4005-$3995 where buyers are very likely to re engage for renewed bullish rally.
If $3995 fails as support, decline is likely to extend to $3983 below which next downside retracement may reach $3935
What's Most Likely Scenario?
Prevailing momentum is precisely bullish and immediate price action indicates strong bullish bias while oscillators are highly stretched and any positive news of agreement on US Government shutdown will witness quick price correction as these heights are prone to profit booking at the drop of a hat.
High probability that Gold retracement approaches or mitigates $4015-$4005 or even $3995-$3983 support and breakout zone and attracts buyers again to resume main bullish rally retesting $4050 and extending advance towards $4068-$4083 followed by critical resistance $4114
On the flip side, sharp and strong break below $3983 may also indicate sellers intervention pushing prices to lower boundary $3935

XAU/USD | 15M | Smart Money Short SetupAfter a strong impulsive rally, price swept liquidity above the recent swing high and instantly rejected from a premium zone. A clear shift of structure confirms bearish intent, with supply perfectly aligning with imbalance fill.
🔹 Key Notes:
– Liquidity grab above previous high ✅
– Premium zone rejection ✅
– Market structure shift to bearish ✅
– Clean imbalance + Supply confluence ✅
Now expecting continuation to downside targeting the next demand and inefficiency below 4020 region.

XAUUSD GOLD IS HEADING TOWARDS 7000$ Cycle started when gold is around 1450$ some years ago.
1st cycle - 1000$ to 2000$
2nd cycle - 2000$ to 3000$
3rd cycle - 3000$ to 4000$
4th cycle - 4000$ to 7000$
5th cycle - 7000$ to 12000$
Every impulse has corrective phase according to price theory. you will see minor & major correction , profit bookings between level's to level's. oppurtunity will arise always so don't be greedy. This analysis based on fundamental factor's. Technically it will correct after every impulses. This analysis based on daily timeframe and it is not suitable for day trader , intraday or scalper.
OANDA:XAUUSD

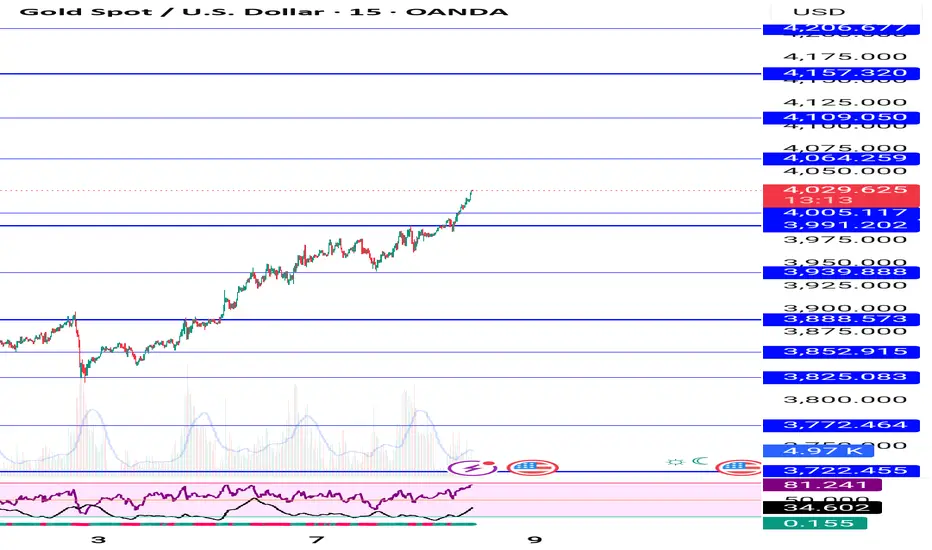
Gold Maintains Bullish Momentum Within Ascending ChannelAnalysis:
The XAU/USD (Gold Spot) 1-hour chart shows a strong upward trend within a well-defined ascending channel. Price action continues to form higher highs and higher lows, indicating sustained bullish momentum.
Currently, gold is trading near $3,959, staying comfortably above the trendline support, which has repeatedly acted as a dynamic base for buyers. The projected movement (blue arrow) suggests a potential short-term retracement toward the lower channel boundary, followed by a rebound toward the upper resistance zone around $4,000–$4,035.
As long as gold remains above the trendline, the bullish structure remains intact. A breakout above the upper boundary could signal further upside potential, while a drop below the trendline may lead to short-term consolidation.
Summary:
Trend: Bullish
Support: $3,915 – $3,925 (trendline zone)
Resistance: $3,995 – $4,035
Bias: Buy on dips near trendline support for potential continuation toward new highs.

gold silver momentum updategold silver momentum update---- silver sustain abv 148300 than looks sharp spike 150k near expect or if blw 147300 looks sharp dwn side 146500-145300+++--- gold abv 122700 sustain looks 124800--- already 123 told ---
spot gold sustain abv 4040 looks up side 4060--85-4100 expect in sudden spike 4010 strong support now for dwn correction

$4000: New Record! Correction Warning & FVG Strategy. Hello, traders!
Gold has officially set a New Record by breaching the $4,000/oz mark, hitting a peak of $4,014.60/oz. Kya baat hai! Although there was an immediate pullback after hitting this big psychological level, the rally is still getting solid support from:
Fundamentals & Market Conflict
Main Drivers: The market is pakka (sure) about two more Fed rate cuts this year (FOMC Minutes tonight are a big deal), coupled with central bank diversification and record ETF inflows ($64B) due to global gadbadi (instability) and inflation.
Reversal Warning: Bank of America (BoA), a big institution boss, is warning that Gold is facing "trend exhaustion," which could lead to a correction in Q4. Dhyan rakhna!
Technical Analysis & Clear Strategy Direction
The price got rejected straight at $4000, causing a small pullback. However, the overall trend is super strong. The safest strategy is to wait patiently for a BUY at specific support zones.
Priority Bias: BUY (Long) on Dips towards FVG (Fair Value Gap) zones to ride the main trend's momentum. Avoid unnecessary SELL attempts; if you must, use tight SL.
Key Price Levels:
Resistance: $4044, $4054, $4064
Support: $4018, $3999, $3986
Trading Strategy (Prioritize BUY on Dips)
BUY ZONE (FVG): $3994 - $3992
SL: $3984
TPs: $4002, $4012, $4022, $4032, $4042
SELL ZONE (High Risk): $4065 - $4067
SL: $4075
TPs: $4057, $4047, $4037, $4027, $4017
Do you trust BoA's warning, or do you think the FOMC Minutes will push us past $4050? Tell me your plan! 👇
#Gold #XAUUSD #4000USD #ATH #Fed #FOMC #TradingView #BUYDIPS #GoldFever

Gold 1H – Bulls Seek Re-Entry Before Fed Minutes💎 XAUUSD – Intraday Trading Plan | Ryan_TitanTrader
📈 Market Context
Gold extends its advance above $4,030 as traders position ahead of this week’s FOMC minutes and key U.S. inflation expectations data. The metal remains supported by persistent geopolitical risk and renewed central-bank demand, while Treasury yields hover near monthly lows.
However, sentiment is mixed after the IMF warned of slower global growth, keeping the dollar steady and prompting potential short-term corrections before continuation.
🔎 Technical Analysis (H1/H4)
Price structure shows a clean Break of Structure (BOS) to the upside following a higher-low formation. The market is currently reacting near premium liquidity at 4068–4066, where a rejection could trigger a retracement toward the discount buy zone at 3969–3971 before resuming the bullish leg.
🟢 Buy Zone: 3969–3971 (Discount Demand / FVG) – potential re-entry area for continuation buyers.
🔴 Sell Zone: 4068–4066 (Premium Liquidity) – possible engineered sweep zone for short-term sellers.
🔑 Key Levels
• BUY Zone: 3969–3971 (main support 3960)
• SELL Zone: 4068–4066 (liquidity pool)
• Psychological Resistance: 4070
• Intraday Pivot: 4035
💡 Trading Scenarios & Plan
🟢 BUY ZONE: 3969–3971
SL: 3960
TP: 3980 – 3990 – 4005 – 4020 – 4035+
🔴 SELL ZONE: 4068–4066
SL: 4075
TP: 4050 – 4035 – 4020 – 4000
⚠️ Risk Management Notes
Expect liquidity sweeps near 4068 before the U.S. session. Wait for lower-timeframe confirmation (ChoCH / BOS) before entry.
Volatility may spike around the Fed minutes, so partial profits and tight stop management are advised.
✅ Summary
Gold remains structurally bullish above 3960, with intraday retracements likely before continuation.
Ryan_TitanTrader anticipates buy reactions around 3970 and short-term rejections at 4068, aligning with the current SMC structure and macro catalysts ahead of FOMC updates.
🔔 Follow Ryan_TitanTrader for live setups, liquidity plays, and real-time gold structure updates!

XAUUSD- FUll Bullish momentDaily Full Bullish
4H- Structure full bulish
15M-15M FVG retracement
Entry-15M OB retracement

"Gold 'Buy the Dip' Opportunity Targeting the $4,000 Level"Technical Analysis
This is a classic bullish continuation setup. Here's a breakdown of the key elements:
Prevailing Trend: The chart shows a strong bullish impulse wave, indicated by the series of large green candles. This establishes the short-term trend as upward.
Corrective Pullback: After reaching a local high (around $3,980), the price is currently in a corrective phase, pulling back towards a potential support level. This is normal and healthy price action in an uptrend.
Support Zone: The red rectangle you've highlighted from approximately $3,950.00 to $3,956.00 is a well-defined area of potential support. This zone represents a previous level of consolidation and the base of the last major push upwards, making it a likely area for buyers to step back in.
Trade Idea: The projected path you have drawn suggests an expectation that the price will dip into this support zone, find buying pressure, and then continue its upward trajectory. This is often referred to as a "buy the dip" strategy.

Intraday Trading vs Swing TradingIntroduction
Brief overview of trading in financial markets.
Importance of choosing the right trading style for profitability and risk management.
Statement of purpose: Compare intraday trading and swing trading across multiple dimensions such as time horizon, risk, capital requirements, strategy, and psychology.
1. Understanding Intraday Trading
1.1 Definition
Buying and selling financial instruments within the same trading day.
Positions are squared off before the market closes.
1.2 Characteristics
Short-term focus (minutes to hours).
High trade frequency.
Requires constant market monitoring.
1.3 Tools & Techniques
Technical indicators: RSI, MACD, moving averages, Bollinger Bands.
Chart patterns: Flags, triangles, head & shoulders.
Level 2 data, real-time market depth.
1.4 Advantages
Potential for high profits in a single day.
No overnight risk exposure.
Quick capital turnover.
1.5 Disadvantages
High stress due to rapid decision-making.
Significant brokerage and transaction costs.
Requires advanced knowledge and quick reflexes.
2. Understanding Swing Trading
2.1 Definition
Holding positions for several days to weeks to capture medium-term price movements.
2.2 Characteristics
Medium-term focus.
Fewer trades but larger profit potential per trade.
Less time-intensive compared to intraday trading.
2.3 Tools & Techniques
Technical analysis: Trendlines, support/resistance, moving averages.
Fundamental analysis: Earnings reports, sector trends, macroeconomic indicators.
Swing patterns: Breakouts, pullbacks, reversals.
2.4 Advantages
Less stressful than intraday trading.
More time to analyze and make informed decisions.
Lower transaction costs due to fewer trades.
2.5 Disadvantages
Exposure to overnight and weekend risks.
Capital is tied up longer.
Requires patience and disciplined risk management.
3. Time Horizon and Trading Frequency
Intraday: Trades last minutes to hours; multiple trades daily.
Swing: Trades last days to weeks; limited trades but larger exposure.
Impact on lifestyle: Intraday requires active screen time; swing allows more flexibility.
4. Capital Requirements
Intraday: Leverage is often used; margin requirements are smaller but risk is higher.
Swing: Requires more capital per trade due to longer holding periods and lower leverage.
Risk of capital erosion: Intraday mistakes can wipe out a day’s gains; swing mistakes can impact several days of profit potential.
5. Risk and Reward Dynamics
Intraday: High volatility can yield high rewards but also steep losses.
Swing: Moderate volatility, potential for larger cumulative gains, but exposure to overnight gaps.
Risk management strategies: Stop-loss orders, position sizing, diversification.
6. Trading Psychology
Intraday:
Requires quick decision-making and mental resilience.
Emotional discipline is crucial; fear and greed can destroy profits quickly.
Swing:
Patience is essential to ride trends.
Ability to handle temporary drawdowns without panic-selling.
7. Strategy and Analysis
Intraday Trading Strategies:
Scalping: Quick small gains.
Momentum trading: Riding strong price trends within the day.
Swing Trading Strategies:
Trend-following: Entering trades along prevailing trends.
Reversal trading: Buying dips and selling rallies.
Technical vs fundamental analysis balance: Swing trading often incorporates both; intraday is heavily technical.
8. Costs and Tax Implications
Intraday:
Higher brokerage and STT due to frequent trades.
Short-term gains taxed differently depending on jurisdiction.
Swing:
Lower trading costs.
Gains may qualify for medium/long-term capital gains benefits.
9. Suitability for Different Traders
Intraday: Best for active, risk-tolerant, experienced traders with fast decision-making skills.
Swing: Suitable for part-time traders, working professionals, and those seeking less stressful trading.
10. Technology and Tools
Intraday: Real-time charts, high-speed internet, advanced trading platforms.
Swing: Standard charting tools, technical analysis software, news alerts.
Algorithmic trading: Both can benefit but intraday relies more heavily on automated systems.
11. Performance Metrics
Intraday:
Profit per trade is smaller but cumulative daily gains can be significant.
Key metrics: Win rate, risk-reward ratio, drawdown percentage.
Swing:
Profit per trade larger due to capturing trends.
Key metrics: Holding period returns, average gain/loss, volatility capture.
12. Case Studies
Example of successful intraday trades: High-volume stocks, news-based spikes.
Example of successful swing trades: Trend-following in indices or sectoral stocks.
Comparison of returns, drawdowns, and effort required.
13. Hybrid Approaches
Combining intraday scalping with swing trading to diversify income streams.
Portfolio allocation between short-term and medium-term trades.
Pros and cons of hybrid trading.
14. Choosing Your Style
Assess your risk tolerance, time availability, capital, and psychological comfort.
Test both styles using paper trading before committing real capital.
Flexibility and adaptation to changing market conditions.
15. Conclusion
Recap of key differences: time horizon, risk, rewards, strategies, tools.
Emphasis on personal suitability over “best style.”
Encouragement to practice disciplined trading, regardless of style.

Algorithmic AI Trading SystemIntroduction
Algorithmic AI trading systems are transforming the financial markets by combining the power of algorithms, artificial intelligence (AI), and big data to make trading more efficient, precise, and profitable. Traditional trading relied heavily on human intuition and manual execution, which was slower and prone to errors. In contrast, AI-powered trading systems leverage complex mathematical models, machine learning, and real-time data analysis to execute trades automatically, often outperforming human traders in speed and accuracy.
The integration of AI in algorithmic trading has become crucial for institutions, hedge funds, and retail traders seeking competitive advantages in highly volatile and liquid markets.
1. Understanding Algorithmic Trading
Algorithmic trading, often called algo-trading, uses predefined rules and mathematical models to execute trades automatically. These rules are designed based on market data such as price, volume, and timing. The main features include:
Speed: Algorithms can execute orders in milliseconds, capitalizing on short-lived market opportunities.
Accuracy: Reduces human errors in execution, ensuring trades occur exactly as planned.
Cost Efficiency: Automation lowers operational costs and reduces slippage in high-frequency trades.
Types of Algorithmic Trading Strategies
Trend-Following Algorithms: Identify and follow market trends to generate profits.
Mean Reversion Algorithms: Trade based on the assumption that prices will return to their historical average.
Statistical Arbitrage: Exploit price inefficiencies between correlated assets.
High-Frequency Trading (HFT): Leverages milliseconds-level execution speed for arbitrage or market making.
While these strategies are effective, AI enhances them by incorporating machine learning and predictive analytics to adapt to changing market conditions.
2. Role of Artificial Intelligence in Trading
Artificial intelligence brings adaptability, predictive power, and self-learning capabilities to algorithmic trading. AI in trading generally involves:
Machine Learning (ML): Algorithms learn from historical and real-time data to predict future price movements.
Natural Language Processing (NLP): Analyzes news, earnings reports, and social media sentiment to inform trades.
Deep Learning: Identifies complex non-linear patterns in market data that traditional models might miss.
AI Applications in Trading
Predictive Analytics: AI models forecast asset price movements and volatility based on historical data.
Sentiment Analysis: NLP models assess market sentiment from financial news, tweets, or analyst reports.
Risk Management: AI continuously monitors market exposure, portfolio risks, and liquidity constraints.
Trade Execution Optimization: Machine learning adjusts order execution to minimize slippage and transaction costs.
By combining AI with algorithms, trading systems move from rule-based automation to adaptive intelligence, enabling smarter and faster decision-making.
3. Architecture of an AI Trading System
A robust AI trading system typically consists of four key components:
Data Acquisition Layer:
Gathers structured (price, volume) and unstructured data (news, social media).
Sources include market feeds, APIs, historical databases, and alternative datasets like satellite imagery or economic indicators.
Data Processing & Feature Engineering:
Cleans, normalizes, and transforms raw data into meaningful inputs for AI models.
Feature engineering is critical to highlight relevant signals for price prediction.
AI Modeling Layer:
Machine learning models such as Random Forests, Gradient Boosting, or LSTM neural networks predict price movements or detect anomalies.
Reinforcement learning can be used to optimize trading strategies over time based on rewards and penalties.
Execution & Monitoring Layer:
Converts AI-generated signals into actionable trades using low-latency order execution engines.
Continuously monitors market conditions, system performance, and risk exposures.
4. Benefits of Algorithmic AI Trading
Speed and Efficiency: AI systems process vast datasets and execute trades far faster than humans.
24/7 Market Monitoring: AI can continuously monitor multiple markets without fatigue.
Data-Driven Decisions: Eliminates emotional bias from trading, relying on objective, statistical analysis.
Adaptive Strategies: Machine learning allows strategies to evolve with changing market dynamics.
Risk Minimization: Predictive models and real-time monitoring help prevent major losses.
5. Challenges and Risks
Despite its advantages, algorithmic AI trading comes with risks:
Overfitting: AI models trained on historical data may fail in live market conditions.
Market Impact: High-frequency trades may inadvertently affect market prices.
Data Quality Issues: Inaccurate or incomplete data can lead to wrong trading decisions.
Cybersecurity Risks: AI systems are vulnerable to hacking or manipulation.
Regulatory Compliance: Algorithmic and AI-driven trades are under strict regulatory scrutiny in many markets.
Traders must balance innovation with caution, ensuring robust risk management and compliance protocols.
6. Popular AI Trading Strategies
Reinforcement Learning for Portfolio Optimization:
AI agents learn to maximize portfolio returns while minimizing risk using reward-based learning.
Sentiment-Based Trading:
NLP algorithms analyze news and social media sentiment to predict price trends.
Algorithmic Arbitrage:
AI identifies temporary price discrepancies across exchanges for profit.
Predictive Modeling for Volatility:
AI forecasts market volatility, enabling traders to hedge positions effectively.
Hybrid Models:
Combines technical indicators, fundamental data, and sentiment analysis for holistic decision-making.
7. Case Studies and Real-World Applications
Hedge Funds and Investment Banks:
Firms like Renaissance Technologies and Goldman Sachs use AI-driven strategies to outperform traditional market approaches.
Retail Trading Platforms:
AI-powered trading bots for retail investors provide automated signal generation and trade execution.
Cryptocurrency Markets:
AI systems exploit the high volatility of crypto markets to generate consistent returns.
Alternative Data Utilization:
AI can analyze satellite imagery, weather data, or shipping patterns to predict commodity prices or stock movements.
8. The Future of AI in Trading
The AI trading landscape is evolving rapidly:
Explainable AI: Traders demand transparency in AI-driven decisions to trust automated systems.
Cross-Asset Integration: AI systems will increasingly manage multi-asset portfolios, including stocks, crypto, and derivatives.
Quantum Computing: May accelerate AI algorithms, enabling near-instantaneous market analysis.
Regulatory Evolution: Regulators are developing frameworks to monitor and manage AI-driven trading risks.
The future points toward AI-driven systems that are smarter, faster, more adaptive, and capable of operating across global markets seamlessly.
Conclusion
Algorithmic AI trading systems represent a paradigm shift in financial markets. By combining computational speed, adaptive intelligence, and vast data processing capabilities, these systems are setting new benchmarks for efficiency, profitability, and risk management. While challenges like overfitting, cybersecurity risks, and regulatory hurdles exist, the potential benefits for investors and institutions are immense.
AI in trading is not just about automation; it is about building systems that think, learn, and adapt—ushering in a new era where data-driven intelligence shapes the future of finance.

GOLD M30 – Bulls Defend $4,000, Eyes on 4,100+Gold’s historic surge above the $4,000 psychological barrier is now consolidating, with buyers defending the 3996$ support (Fibo 0.618 reaction). The structure remains bullish, while intraday traders are eyeing the next reaction zones for both continuation and scalp opportunities.
📊 Technical Levels to Watch (Fibo Matrix – M30)
3996$ Support Zone: Breakout retest + Fibo 0.618 → must-hold for bulls.
4018 – 4020: First intraday resistance, potential short-term reaction.
4043$: Expansion-based psychological barrier.
406x – 407x: Key SELL Reaction Zone (Fibo 1.5 – 1.618) → scalp rejection likely.
4095$+: Upper liquidity expansion, next major target if momentum extends.
🎯 Francis Trade Plan
✅ BUY Setup:
Entry: 3996 – 4000 zone.
Targets: 4018 → 4043 → 406x.
SL: Below 3984.
⚠️ SELL Setup (Short-term scalp only):
Entry: 406x – 407x reaction.
Targets: 4020 → 4000.
SL: Above 4096.
🔑 Francis View
The breakout at $4,000 signals strength, and bulls still dominate.
👉 Dips into 3996 support remain attractive BUY opportunities.
👉 Short-term scalpers can prepare for reaction SELLs around 406x – 407x.
📌 Bias: Bullish above $3996 – 4,100 zone remains the next liquidity magnet.

XAUUSD (Gold) Trading Ideathis is for educational purpose only
it clearly explains how to handle 2-point stop-loss and retry logic (max 3–4 times) for automation or manual trading
Wait for a green candle close above the 4088 level before entering.
Confirm the breakout with strong volume support.
The green line acts as your entry trigger zone.
Entry Level: 4088 (Green Line)
Exit Level: 4151 (Red Line)
Stop-Loss: 2 points
Max Attempts: 3–4 times per setup
The red line (4151) is the final exit target.
Keep a tight 2-point stop loss for controlled risk.
Rejection may happen 2–3 times near the entry zone — stay patient.
Avoid early entries before confirmation.
Watch for volume expansion during breakout candles.
Use 30-minute time frame for accuracy and clarity.
Once confirmed, ride the move toward the 100% level at 4117.
Partial profit booking is advised near 4117 zone.
Move SL to cost after price closes above 4100.
Avoid trading if candle closes below 4088 again.
The momentum remains bullish as long as price stays above 4088.
Red candle rejection below entry zone means wait again for setup.
Don’t chase enter only after a confirmed breakout.
Keep your chart clean and focus on price + volume behavior.
Plan your trade before execution , no impulsive entries.
Respect SL — discipline ensures long-term success.
Always analyze candle behavior near major levels before deciding.
Enter on candle close above 4088 with volume confirmation.
SL: 2 points below entry.
Targets: 4117 (first), 4151 (final).
Expect 2–3 rejections — wait for confirmation.

Gold 4000 $ upside target hit next target given on chart buy dipGood upside move will continue until US shutdown settlement news not come
How My Harmonic pattern projection Indicator work is explained below :
Recent High or Low :
D-0% is our recent low or high
Profit booking zone ( Early / Risky entry) : D 13.2% -D 16.1 % is
range if break them profit booking start on uptrend or downtrend but only profit booking, trend not changed
SL reversal zone (Safe entry ) : SL 23.1% and SL 25.5% is reversal zone if break then trend reverse and we can take reverse trade
Target : T1, T2, T3, T4 and .
Are our Target zone
Any Upside or downside level will activate only if break 1st level then 2nd will be active if break 2nd then 3rd will be active.
Total we have 7 important level which are support and resistance area
Until , 16% not break uptrend will continue if break then profit booking will start.
If break 25% then fresh downtrend will start then T1, T2,T3 will activate
1,3,5,10,15,20 minutes are short term levels.
30 minutes 60 minutes , 2 hours,3 hours, ... 1 day and 1 week chart positional and long term levels
XAUUSD – PRICE ABOVE $4000: ABSOLUTELY CRAZY FOR TRADERSXAUUSD – PRICE ABOVE $4000: ABSOLUTELY CRAZY FOR TRADERS
Gold has officially surpassed the $4000 mark, marking one of the most robust increases in recent history.
Let's take a look at the key price zones and short-term opportunities 👇
🔻 SELL Scenario
SELL 4025–4027 → SL 4033 → TP 4015 – 4000 – 3980
SELL 4042–4044 → SL 4049 → TP 4030 – 4015 – 4000 – 3980
🟩 BUY Scenario
BUY 3993–3995 → SL 3988 → TP 4005 – 4013 – 4023 – 4040
BUY 3980–3983 → SL 3975 → TP 3998 – 4005 – 4013 – 4023 – 4040
📈 Technical Analysis
The medium-term upward price channel continues to be stable.
Rising lows indicate that buying pressure remains very strong.
The nearest psychological resistance is around the 4043 zone, coinciding with the Fibonacci extension.
The expected buying zone is at the POC Volume Profile area — a high liquidity zone, once anticipated by many traders to reject gold prices, but now could become a strong demand zone.
🧭 Macroeconomic Perspective
If the Federal Reserve (Fed) continues to cut interest rates, the market may aim for the next milestone – 5000 USD/ounce.
Although short-term fluctuations may occur (such as temporary ceasefires in the Middle East or Ukraine), the core drivers of this trend remain unchanged:
US public debt is increasing
Central banks are diversifying foreign reserves
The USD is weakening
All of which support gold's medium-term upward trend.
⚡️Summary
Gold remains in a solid upward structure, even as it approaches overbought territory.
There might be strong corrections, but as long as the upward structure is maintained, buyers remain in control.
