WILL GOLD CONTINUE TO DROP?1. Market Context Yesterday, gold was almost in accumulation throughout the Asian–European session and only broke out strongly in the latter half of the US session.
After breaking out of the accumulation zone, the price dropped sharply around 4006 – a crucial key level – and surged strongly from there.
However, statements from FED members remain hawkish, affirming the stance of keeping interest rates high for longer and not considering rate cuts yet.
This creates
-Downward pressure on gold
-Cash flow leaning towards USD
------>>Market sentiment prioritises SELL on price recovery
➡️ Conclusion: Today, the main scenario remains SELL following the trend, BUY is only a secondary strategy & short scalp when reaching strong support.
🎯2. Today's Trading Scenario
(SL: 10 points TP 10 points. RR ratio:1-2/1:3/1:5)
🔻 Main SELL (priority)
SELL Zones:
4050 – 4055
4075 – 4080
4105 – 4110
🟦 Secondary BUY
BUY Zones:
3996 – 3994
3965 – 3960
3935 – 3930
3895 – 3890
Trade ideas

XAUUSD Positional Long with SL#Gold Positional Trade Outlook
Gold is currently pulling back after a sharp rally, offering #positional traders an opportunity to build entries gradually with the target upto prev ATH or rejection. Price is approaching key demand zones, so follow a scaled stop-loss (SL) structure to manage risk effectively. Consider building positions in phases as price reacts to each support level:
SL1: 4,008 – Early protective stop for light entries
SL2: 3,930 – Medium-risk level for second build-up
SL3: 3,886 – Deep stop for long-term positional holds
Stick to disciplined risk management, add positions only on confirmations, and allow the trend structure to guide your exposure.

$Gold: Breakdown or Bounce?🔻 #Gold Breakdown or Bounce? 🔺
Price tested a critical level (upward sloping trendline - Breakdown Retest ) after a bearish engulfing and is now pulling back. Will the breakdown continue, or can bulls reclaim control? 👀
Trendline break 🚨
Breakdown retest ⚠️
Key levels to watch:
🚧 Resistance: $4099.40 - $4126.08 / $4185.91 - $4195.21 / $4355.80 - $4381.44
🛡 Support: $4024.53 / $3932.10 - $3930.62 / $3953.00
Below $3953 → opens downside toward $3500.20–$3432.84 📉
Between ATH & $3953 → market likely stays trendless/choppy ⚖️
TVC:GOLD #Gold #XAUUSD #Forex #BearishEngulfing #CandleStickPatterns #BreakdownRetest #BearishReversal #PriceAction #ForexTrading
📌 #Disclaimer: This analysis is shared for educational purposes only. It is not a buy/sell recommendation. Please do your own research before making any trading decisions.

Gold Maintains Uptrend, Watch for Pullback to Buy with Cash Flow🔍 Context & Market Structure
After a strong upward impulse from a low liquidity area, the price has broken the downtrend structure and formed a bullish BoS on H1.
Currently, gold is accumulating above the Support Zone at 4,183 USD after creating a new peak and leaving a FVG just below the current price .
Above is the Liquidity Zone $$$ around 4,232 USD – a concentration of sell-side stop losses and buy-side profit-taking orders, likely to create a “final push” that attracts liquidity.
=> Overall: the main trend remains bullish , prioritising waiting for a pullback to discount levels to buy with the trend rather than chasing orders at high levels.
💎 Key Technical Zones
Liquidity Zone $$$: around 4,232 USD – upper liquidity area, prone to profit-taking reactions.
Current FVG: price gap area just below the current price (around 4.20x) – expected to “fill the gap” before continuing.
Support Zone 1: 4,183 USD – nearest support, confluence with the area where the upward impulse began to slow.
Support Zone 2: 4,140 USD – stronger support, aligning with the old structure.
Liquidity Clear: 4,101 USD – lower liquidity area, if swept, it would be a very attractive discount for swing buyers.
📈 Proposed Trading Scenarios
1️⃣ Main Scenario – Buy with the trend at FVG / 4,183 USD
Priority to wait for the price to:
Either fill the FVG around 4.20x and show a rejection candle,
Or clearly retest Support 4,183 USD with a bullish reversal signal on M15–H1.
When a confirmation signal appears:
→ Consider buying (BUY) around 4.19x – 4.18x .
Stoploss: below 4,175 USD (below the nearest low and support).
TP reference:
TP1: 4,210 USD
TP2: 4,232 USD (Liquidity Zone $$$)
TP3: trailing if the price breaks through 4,232 and maintains the bullish structure.
2️⃣ Alternative Scenario – Deeper Pullback Before Continuing Upward
If the price clearly breaks 4,183 USD and closes an H1 candle below:
→ Avoid buying hastily, wait for the price to continue adjusting to Support 4,140 USD or even Liquidity Clear 4,101 USD .
At these zones, if there appears:
strong rejection candles,
or small reversal structures (bullish ChoCH on M15),
→ Then consider buying at a discount with better RR, targeting a return to 4,183 → 4,210 → 4,232 USD.
3️⃣ Short-term Sell Scenario (for experienced scalpers only)
If the price hits Liquidity Zone 4,232 USD but shows strong rejection (long wick, high sell volume):
→ Consider short-term sell scalp back to the 4.20x – 4,183 USD area.
This is a counter-trend trade, so:
keep the volume small,
short TP,
tight SL above the newly formed peak.
⚠️ Risk Management Notes
Do not FOMO buy when the price is testing near the 4.23x area – this is a prone-to-sell area.
Prioritise waiting for a pullback to FVG / Support for a better entry point and RR.
Always adjust volume according to actual SL, avoid over-leverage during strong market volatility.
“Buy the dip in liquidity zones, do not chase orders at the peak – that's how to go with the big money flow.”

Next hit will be breakoutPrice is rejecting multiple time and if price come again it will be breakout move

Gold to make one final pushGold is falling today, but probably in wave iv of C. Gold is bouncing back in ABC or three waves inside an X wave or a counter-trend bounce. This should be the final push toward the 61.8% retracement mark near 4192. Some people want me to use hourly charts and mark the end hurriedly. Even on the hourly silver chart, I could only see wave iv yesterday. A daily time frame is a better confirmation. Wait for your turn.

XAUUSD / GOLD Analysis – Buy Opportunity Ahead!Gold has formed a strong double-bottom support zone at 4095 – 4090, signaling potential bullish momentum. As long as Gold remains above 4080, the bias stays bullish for short-term buyers.
🧭 Trading Plan:
Buy Zone: 4095 – 4090
Stop Loss: Below 4080 (close basis)
Targets: 🎯 4010, 4030, 4040
💡 Technical Reasoning:
Double-bottom pattern confirmation on 1H/4H timeframe
RSI bouncing from oversold area
Price rejecting key support zone multiple times
Potential bullish divergence forming
⚠️ Risk Management:
Always use proper risk-to-reward management and position sizing. Gold can move fast during high volatility sessions — keep your stops tight and targets realistic.
🔔 Conclusion:
If Gold holds above 4080, buyers could dominate the next leg. Watch price action closely near 4095 – 4090 for entry confirmation.

XAUUSD – PRIORITISE BUYING ON TUESDAY💛 XAUUSD – PRIORITISE BUYING ON TUESDAY 🎯
🌤 Overview
Hello everyone 💬
Gold continues its upward momentum in the first two days of the week, supported by the cash distribution policy for low-income individuals and the reopening moves by the US government under President Trump.
These factors are putting downward pressure on the USD, helping gold prices maintain a short-term upward trend.
💹 Technical Analysis
🟣 Currently, the price is touching the VAH area according to the Volume Profile and showing a slight reaction – however, the support trendline around 4110–4113 remains an ideal buying zone to continue following the trend.
🔹 The 4200–4203 area (Fibonacci Extension 2.618) coincides with the strong resistance of H4, likely to see a short adjustment reaction before continuing to extend to the 43xx area.
🎯 Trading Plan Reference
💖 BUY Scenario (priority trend-following)
Entry: 4110–4113 | SL: 4106
TP: 4132 – 4150 – 4175 – 4200 – 4250
💢 SELL Scenario (short-term reaction)
Entry: 4200–4203 | SL: 4207
TP: 4188 – 4165 – 4148
⚠️ Important Notes
Prioritise buying according to the main upward trend, especially when the price reacts at the H4 trendline.
Sell orders are only for short-term reactions, and profits should be secured early when the first TP is reached.
USD volatility remains a key factor to closely monitor this week.
🌷 Conclusion
The upward trend of gold is still maintained 💛
Be patient and wait for the price to react at the 4110–4113 area to buy according to the trend, and take advantage of pullbacks at resistance to manage orders effectively.
If you find this useful, don't forget to 💛 like – 💬 comment – 🔔 follow LanaM2 for daily gold insights ✨

XAUUSD Tape readingwaiting for a correction and a sign of continuation on htf , then i will start looking for longs

Gold Trading Strategy for 14th November 2025⭐ GOLD Intraday Levels (30-min Candle Strategy)
🟢 BUY Setup
📈 Buy Above: $4,230 (30-min candle close above the high)
🎯 Targets:
$4,240
$4,250
$4,260
🔴 SELL Setup
📉 Sell Below: $4,143 (30-min candle close below the low)
🎯 Targets:
$4,133
$4,123
$4,113
⚠️ Disclaimer
This information is for educational and informational purposes only. It is not financial advice. Trading in commodities, forex, and indices involves substantial risk. Always do your own analysis or consult with a certified financial advisor before taking any trade. Never risk more than you can afford to lose.

Premium Chart AnalysisHow to Trade Chart Patterns
To effectively trade chart patterns, follow these steps:
Identify the Pattern Early
Use clear trendlines to mark support and resistance zones.
Confirm shape and symmetry before assuming a pattern.
Wait for Breakout Confirmation
A breakout should be supported by volume expansion—this validates the move.
Avoid acting before confirmation; false breakouts are common.
Set Entry and Exit Points
Enter after a confirmed breakout (preferably with candle close beyond resistance/support).
Target = Height of pattern projected from breakout point.
Stop-loss = Just below (for bullish) or above (for bearish) the breakout level.
Use Multiple Timeframe Analysis
Confirm pattern on higher timeframes to avoid false signals.
Align short-term setups with long-term trends for stronger conviction.

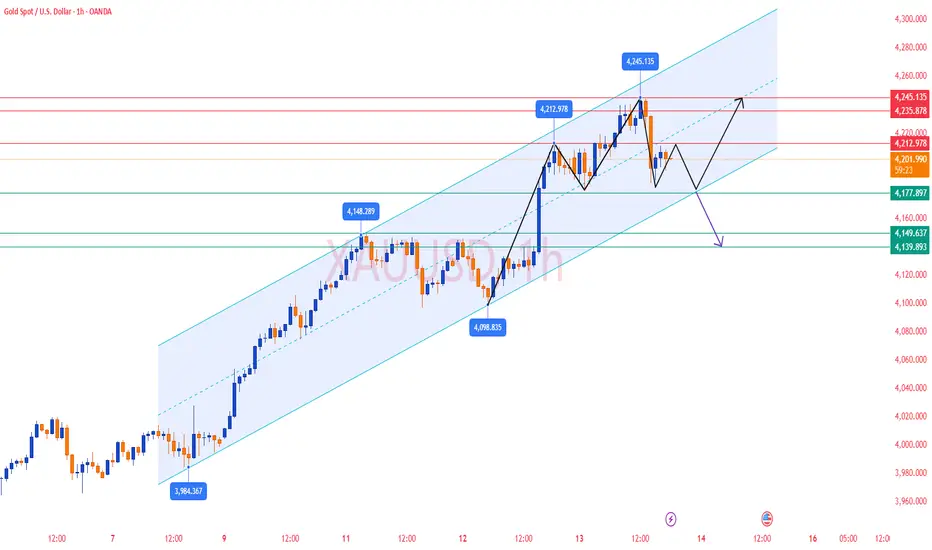
Elliott Wave Analysis – XAUUSD | 14/11/2025
1. Momentum
D1 Timeframe:
Daily momentum is showing clearer signs of reversal. We need to wait for today’s close for confirmation. If D1 momentum truly reverses, I expect a strong bearish move next week.
H4 Timeframe:
H4 momentum is preparing to turn upward, so a short-term bullish move may appear on this timeframe.
H1 Timeframe:
H1 momentum is getting ready to reverse downward, so I expect a decline from the current H1 structure.
________________________________________
2. Wave Structure
D1 Wave Structure
Price is still forming wave X. Yesterday’s D1 candle was bearish but not very strong. Today, we want to see another strong bearish candle to further confirm the possibility of a new decline on the daily timeframe. For now, we continue to observe today’s market reaction.
________________________________________
H4 Wave Structure
On the H4 chart, we’re seeing two strong bullish candles, which is not what we want to see if the market is forming a top. A proper top should show strong downward momentum, while the pullback should appear as short-bodied candles.
We now wait for the upward reversal of H4 momentum:
• If price breaks above the high, it suggests the current high is not the real top but only a temporary corrective move, and the market may form a new higher high.
• If price does not break the high, then once H4 momentum reverses downward, we can expect a stronger and deeper decline.
(This section keeps your original meaning exactly, with smoother wording.)
________________________________________
H1 Wave Structure
The recent decline resembles a clear 3-wave structure, creating three possible scenarios:
3 Possible Scenarios
Scenario 1 – Correction Completed
If the recent decline is a completed 3-wave structure, the correction may already be over. Combined with H4 momentum preparing to rise, price may form a new high once H4 enters overbought territory.
________________________________________
Scenario 2 – Wave A of a Flat or Triangle
If the decline is only wave A, then a larger Flat or Triangle correction may be forming.
• Price may revisit 4248 when H4 momentum reaches overbought.
• After that, price may decline again but not deeply:
o Flat: drop toward 4145 (wave A low).
o Triangle: a shallower drop.
• After completing this correction, price will begin a new upward swing.
________________________________________
Scenario 3 – Beginning of a 5-Wave Decline
If the previous drop was wave 1 of a 5-wave bearish sequence:
• The current rise is wave 2, meaning price must not break 4248.
• When H4 reaches overbought and consolidates below the peak, price may drop sharply into wave 3.
• Another possibility: H4 and H1 momentum “stick together”; once H1 reverses downward, price may fall aggressively — a typical wave 3 characteristic.
________________________________________
4. Overall Bias
While multiple scenarios are listed for monitoring,
our primary expectation remains bearish, based on signals observed over the past several days.
________________________________________
🎯 5. Trading Plan
Sell Zone: 4211 – 4213
SL: 4231
TP1: 4145
TP2: 4096
TP3: 4046

XAU/USD – Gold Slightly Adjusts, Monitoring Pullback to Support Hook: XAU/USD – Gold Slightly Adjusts, Monitoring Pullback to Support 4,151 USD
Body: 📊 Market Structure
After the Break of Structure (BoS) at the 4,208 USD region, gold confirms the continuation of the upward trend and is forming a technical adjustment.
The price has touched the Resistance Zone 4,208 – 4,237 USD and is currently adjusting as expected, heading towards the Support Zone 4,151 USD – which previously created an impulsive move.
Below Support 4,151, there is a strong OB at 4,104 USD.
As long as the price does not break deeply below 4,104 USD, the bullish structure remains intact.
💎 Key Technical Zones
• Resistance Zone: 4,208 – 4,237 USD → supply area + where a downward reaction occurs
• Support Zone: 4,151 USD → area awaiting upward reaction
• Strong OB + Support: 4,104 – 4,110 USD → base of the upward structure
• Liquidity Zone (Target): 4,260+ USD → next wave expansion area
🎯 Trading Plan
1️⃣ BUY Setup – Trend-following priority
If the price adjusts correctly to discount areas:
• Entry 1: 4,151 USD
• Entry 2: 4,104 USD (best area – confluence OB)
SL: below 4,090 USD
TP1: 4,208
TP2: 4,237
TP3: 4,260
→ Main strategy: wait for pullback → re-enter the upward wave → follow the strong trend.
2️⃣ SELL Scalp – Reaction at Resistance (counter-trend)
If the price retests the 4,208 – 4,237 area and creates a clear rejection:
Entry: 4,218 – 4,230
SL: 4,245
TP1: 4,180
TP2: 4,151
→ Setup only for flexible traders, short trades, no holding positions.
🧠 Vincent’s View
The current structure is very precise:
Impulsive Move → Short-term Distribution → Pullback to Support → Continue upward wave.
The 4,151 USD area is the focal point to observe.
The 4,104 USD area is the best BUY area if the market wants to hunt deeper liquidity.
As long as the price does not break 4,104 USD, buyers still hold the entire advantage.

Part 2 Master Candlestick PatternBull Call Spread – Low Cost Bullish Trade
Market View: Moderately bullish
How it Works:
Buy ATM/ITM call
Sell higher strike call
Reduces cost + reduces risk
Best For:
Controlled bullish trades
Trending markets
Bear Put Spread – Low Cost Bearish Trade
Market View: Moderately bearish
How it Works:
Buy ATM/ITM put
Sell lower strike put
Cheap alternative to buying a naked put

Gold Faces Rejection at Resistance Zone – Potential Bearish CorrAnalysis:
The gold price (XAU/USD) is currently testing a strong resistance zone near $4,235–$4,240, where previous bullish momentum appears to be slowing down. Sellers are showing interest in this area, suggesting a potential bearish reversal or correction phase.
A clear support zone lies around $4,140–$4,150, which serves as the target for the expected downward move. If price breaks below this support, further declines could extend toward the next demand zone.
However, if gold breaks and closes above the resistance zone with strong volume, it could invalidate this bearish setup and open the path to new highs.
Key Points:
Resistance Zone: $4,235 – $4,240
Support Zone: $4,140 – $4,150
Short-term Bias: Bearish correction expected
Target: Support zone near $4,145

Gold Maintains Bullish Structure Despite 4245 Rejection We have seen a sharp rejection from the 4245 level yesterday, forming a red candle . However,. Gold found solid support at the weekly R3 level around 4147 and managed to close above it, which is a significant technical development. Currently, we're witnessing a strong recovery rally on lower tf that suggests the bulls aren't ready to give up just yet.
When we zoom in to the daily timeframe, yesterday's downward move appears to be just a normal bearish candle rather than a trend reversal signal. The key factor supporting this view is that price was trading well above the weekly R3 level throughout the session. In a healthy uptrend, these kinds of pullbacks are quite normal and often provide opportunities for fresh entries. The overall bullish structure on the daily chart remains intact, which gives me confidence that this isn't the beginning of a major correction.
Looking at the current setup, the first critical support level at 4140-4150. This zone has proven its importance multiple times, and as long as price holds above this area, I'm maintaining a bullish bias. A daily close below 4140-4150 would be the first warning sign that we might be heading back into consolidation territory. That scenario would require a reassessment of the trend direction.
However, if gold continues to respect the 4140-4150 support zone and builds on today's recovery momentum, we could see price pushing toward higher levels in the coming sessions. The bulls have shown their presence at key support areas, and with the daily structure still favoring upside, the path of least resistance appears to be upward for now.

Gold Intraday Setup (XAU/USD)Price tapped into the premium zone after a sharp impulsive leg, showing signs of exhaustion near 4139–4140 levels. Expecting a potential short-term correction as liquidity above recent highs has been swept.
Bias: Short
Entry: 4134
Stop Loss: 4140
Target: 4120
R:R: ~2:1
Watching for confirmation on lower timeframes before continuation.
#Gold #XAUUSD #PriceAction #LiquidityGrab #YCGHCapital

Gold Analysis and Trading Strategy | November 13–14✅From the 4H chart, gold reached a recent high of 4245.10 before encountering clear resistance and pulling back. The upper Bollinger Band (4234.51) acted as a strong rejection zone, and the price has since retreated toward the 4200 level.
Currently, gold is consolidating between 4190–4210, with short-term moving averages (MA5 at 4204.33, MA10 at 4180.59) forming a potential narrow convergence zone. The MA20 (4150.72) provides additional dynamic support below.
This suggests that while the broader trend remains bullish, the short-term structure has entered a minor correction phase after the sharp rally.
If gold stabilizes above 4175–4180, the medium-term bullish outlook remains intact. A break below that zone could open the way toward 4150–4140, whereas a rebound above 4215–4220 could signal renewed upside momentum.
✅On the 1H timeframe, gold shows a short-term pullback structure after testing 4245. The price has broken below the short-term moving averages (MA5 4207.15, MA10 4220.06), and the Bollinger midline (4211.97) now acts as immediate resistance.
The candles indicate a loss of upward momentum, and the MACD is turning flat, confirming a short-term correction pattern. Support lies around 4179–4185, aligning with the lower Bollinger Band.
If this support holds, we may see a technical rebound toward 4210–4225. However, failure to defend 4175 would likely trigger deeper retracement toward 4150.
Overall, gold is consolidating within a healthy pullback after a strong run-up, and a base-building phase may precede another bullish leg.
🔴 Resistance Levels: 4215 / 4235 / 4245
🟢 Support Levels: 4175 / 4150 / 4138
✅ Trading Strategy Reference
🔰 If gold rebounds to 4215–4230 and shows rejection, consider light short positions, targeting 4180–4160, with a stop loss above 4248.
🔰 If gold pulls back to 4175–4185 and holds, consider buying on dips, targeting 4215–4240.
📈 Summary:
Gold remains in a broader uptrend, but short-term charts show correction and consolidation pressure after hitting 4245.
Focus on the 4175–4230 range — buy on dips near support and take partial profits near resistance.
Gold Bulls Eye Major Resistance – Can They Break Through?Gold continues to trade in an upward trend, recovering strongly from recent lows. On the 4-hour chart, price is moving closer to a falling resistance trendline, which has acted as a major barrier in the past. This makes the upcoming resistance zone very important for short-term traders.
The next key resistance lies between $4250–$4265, where profit booking can be expected. This area has multiple technical confluences, and traders should monitor how price reacts here. A successful breakout and close above this zone could lead to an extended rally toward $4320–$4350.
However, if price faces rejection from this trendline, a short-term pullback toward the $4120–$4080 support zone would be normal and healthy for the trend. Despite the short-term caution, the overall market structure for Gold remains bullish as long as the price stays above support.
Disclaimer: This analysis is for educational purposes only and should not be taken as financial advice. Please do your own research or consult your financial advisor before investing.
Analysis By @TraderRahulPal | More analysis & educational content on my profile.
If you found this helpful, don’t forget to like and follow for regular updates.

Part 7 Trading Master Class With Experts Option Pricing: Why Premium Changes
Premium is the price paid by the option buyer. It depends on:
1. Intrinsic Value
Value if exercised today.
2. Time Value
More time → more chances of profit → higher premium.
3. Volatility (IV – Implied Volatility)
When volatility increases, option premiums rise.
4. Supply & Demand
High demand increases option prices.
5. Interest Rates & Dividends
These have minor impact but still matter for pricing models.

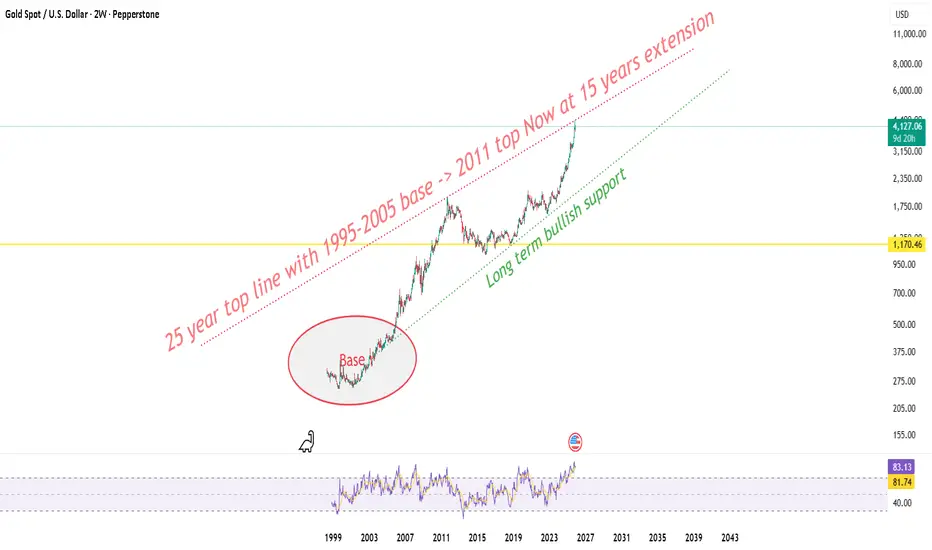
Gold at 25 year top line ! Macro view !Zooming out to the 2 week frame gold’s now touching the same top line that was drawn from the 1995-2005 base to the 2011 cycle high. This upper rail has acted like a generational ceiling and after nearly 15 years, price has stretched back into that very band again, this time near 4150–4350.
This zone isn’t just any resistance it’s the outer wall of gold’s entire super-cycle structure. Historically, whenever price came here with RSI above 80 on the 2-week frame, it marked exhaustion or at least a multi-month digestion phase before the next leg higher. And right now, RSI is sitting around 83 a clear signal of overheated momentum.
Macro context still favors gold in the long term global rate-cut expectations, slower real yields, and consistent central-bank accumulation keep the long-term green base trendline (drawn from 2005 lows) fully intact. As long as that line holds, the long-term structure stays bullish-biased.
But here’s the catch the higher we climb without a structural reset, the more fragile the rise becomes.
So 4365 stands as a major decision point.
Reject from here: we could see a healthy pullback toward 3750-3800 — still within the bullish channel.
Break and close above: that opens the door for a true macro breakout, with next expansion targets sitting around 4800–5200 over the coming years.
For now, this run feels more like a macro stretch ice sitting on sand. Looks shiny, but needs solid ground before it can hold.
Gold Holds Firm Near $4,180 as Markets Await Fed Signal Gold prices are holding steady around $4,184 per ounce, maintaining strong momentum after last week’s sharp rebound of nearly $250 from the $3,930 low. On the 4-hour chart, the uptrend remains intact with multiple Fair Value Gaps acting as key support zones. The nearest support is seen between $4,150–4,120, while resistance lies at $4,220–4,260.
According to Kitco and Reuters, the rally is largely supported by growing expectations that the Federal Reserve may cut rates in December, amid signs of a cooling U.S. economy. The reopening of the U.S. government after a 35-day shutdown means crucial data such as CPI, NFP, and GDP will soon be released — which could reinforce the market’s belief that a dovish shift is near.
Adding to the intrigue, the U.S. Supreme Court is set to review former President Donald Trump’s authority to dismiss Fed Governor Lisa Cook in early 2026. Analysts warn that if this threatens the Fed’s independence, it could trigger a sharp decline in the U.S. dollar and push gold up by as much as $500 per ounce.
Meanwhile, UBS forecasts global gold demand in 2025 could reach its highest level since 2011, as central banks continue increasing reserves. Heightened geopolitical risks — including the upcoming U.S. election in 2026, the Middle East conflict, and renewed U.S.–China trade tensions — are further strengthening gold’s appeal as a safe haven.
In the near term, gold could correct slightly towards $4,150–4,120 before resuming its advance towards $4,260. A decisive break above that level could open the path to $4,300–4,340. With a weakening dollar, potential rate cuts, and global uncertainty, gold appears well-positioned for the next medium-term bullish cycle.

Gold Gold is rising on growing bets that the Federal Reserve (Fed) may cut interest rates soon — weak US jobs data and economic softness are reinforcing this.
FXEmpire +4
• A rate cut or looser policy often favours gold (lower real yields → safer return for non-yielding Gold)
2. US dollar & yields
• A weaker USD and lower Treasury
