XAUUSD – Has the Downtrend Really Started?XAUUSD – Has the Downtrend Really Started?
Hello traders,
Gold is now showing signs of a corrective move lower. Price has already dropped by nearly 40 dollars, signalling that selling pressure is starting to build. Traders are accepting lower prices at this level, but to truly confirm a bearish shift, we need to see price action around the 3530 zone, which acts as a key level for validation.
On the higher timeframe, gold has rallied almost 250 dollars (2500 pips) in just two weeks, a very strong bullish run. However, with the upcoming NFP release today and tomorrow, the market could redistribute liquidity. Current forecasts suggest weak NFP numbers, and if that plays out, gold may still push higher – but this remains speculative.
Trading strategy for now:
Short entries: around 354x, aiming for a medium- to long-term move lower.
Potential buy zones: watch for reactions at the FVG liquidity gaps around 3510 – 3460 – 3430, where strong demand previously created imbalances.
For now, my outlook remains medium-term short, while staying flexible around key liquidity levels. Take this as reference, and share your views in the comments – let’s discuss together.
GOLD.F trade ideas

Bullish Finally we get triangle break out on this chart,now 3333 is very good support,my first short-term target is 3540
Some corrections visible at this level but trand is super bullish
My swing target is 3780 atleast and stoploss is 3333

Gold next movePresent bull run in gold that started in October of 2023 had 4 major consolidations with each lasting on average 3 to 4 months. The present 4th consolidation lasted a little over 4 month, which is quite similar to the 2nd one.
Each breakout from a horizontal resistance resulted initially in a limited rally then 3-4 week short-term consolidation (elliptic shape) followed by a stronger rally.
If the same pattern plays out, then I expect
1. Gold to reach approximately $3,600 within 2 weeks.
2. Consolidate for 3 - 4 weeks within elliptic shape.
3. Final run, in present cycle, to my to $3,900 - 4,000 price target within 3 - 4 weeks.
All in all, gold should be able to reach price target within 8 to 10 weeks, which targets late October to early November 2025.

XAUUSD – Bearish Crab hints at a corrective waveXAUUSD – Bearish Crab hints at a corrective wave
Gold is facing pressure as the USD strengthens and Treasury yields move higher, dampening expectations for near-term rate cuts. With safe-haven demand losing momentum, profit-taking has started to surface after the recent sharp rally.
On the H4 timeframe, price action has completed a Bearish Crab harmonic pattern right at a critical extension zone, with early reversal signals showing up near 3,550. This increases the likelihood of a corrective phase unfolding in the short term.
Price zones in focus:
Resistance : 3,540–3,555
First support area : 3,475–3,450
Next support area : 3,350–3,330
Deeper support zone : 3,290–3,270
Momentum now favors the bears in the short term. Any rebounds should be seen as potential entry points for sellers.
Do you expect gold to hold at the first support, or extend deeper into the lower zones?

GOLD(XAUUSD) Forming a pennant / ascending triangle 📌 Gold (XAUUSD)
Forming a pennant / ascending triangle with strong resistance near $3,390 – 3,400.
Volume is declining, suggesting indecision.
RSI holding above 50 but not powering higher → momentum is slowing.
MACD flatlining, no fresh bullish impulse yet.
👉 Breakout above $3,400 needed for continuation. Breakdown below $3,340 risks correction.
XAU/USD – Market awaits JOLTS, Gold holds safe-haven role⚓️ Captain Vincent – XAU/USD: US–Venezuela tensions push Gold as safe haven
1. Market News 🌍
US Secretary of State Marco Rubio confirmed that the US military attacked a drug ship departing from Venezuela, as Washington steps up pressure on the Maduro government.
Earlier, Trump offered a $50 million bounty to force Venezuela’s President out of power, while deploying military forces near the Caribbean coast.
👉 These moves raise fears of a potential regional conflict, making Gold the top safe-haven asset. The strong rally this morning reflects safe-haven flows returning to GOLD.
📌 Tonight’s focus (3/9 – 21:00): JOLTS Job Openings report – a key gauge of US labour market health.
If the data comes weaker than expected → USD may face more pressure → Gold could accelerate higher.
2. Technical Analysis ⚙️
On the H1 chart, Gold has formed multiple BOS (Break of Structure), showing the bullish trend remains in control.
Buy Zone 3,478 – 3,480: Aligns with a major Order Block, strong support for pullback entries.
Sell Zone 3,577 – 3,579: Near fib extension 1.618, potential resistance where profit-taking may appear.
Key Support – Resistance zones:
Support: 3,528 – 3,507
Resistance: 3,562 – 3,585
3. Trade Scenarios 📌
🔺 BUY Zone (Priority)
Entry: 3,478 – 3,480
SL: 3,470
TP: 3,483 → 3,486 → 3,489 → 349x → 35xx
🔻 SELL Zone (Resistance)
Entry: 3,577 – 3,579
SL: 3,586
TP: 3,573 → 3,570 → 3,567 → 3,560 → 35xx
4. Conclusion ⚓
Gold continues to benefit from US–Venezuela geopolitical tensions, while maintaining a bullish structure with consecutive BOS signals.
In the short term, traders may:
Look to BUY around 3,478 – 3,480 to follow the main trend.
Watch for short-term SELL at 3,577 – 3,579 if price retests strong resistance.
👉 With geopolitical risks rising and US economic data (JOLTS) due tonight, Gold remains the No.1 safe-haven asset.

Part 4 Learn Institutional TradingBasics of Options (Calls & Puts)
There are two main types of options:
Call Option: Gives the holder the right to buy the underlying asset at a fixed price (called the strike price) before or on the expiry date.
Example: You buy a Reliance call option with a strike price of ₹2500. If Reliance rises to ₹2700, you can buy at ₹2500 and gain from the difference.
Put Option: Gives the holder the right to sell the underlying asset at the strike price before expiry.
Example: You buy a Nifty put option with a strike price of 22,000. If Nifty falls to 21,500, your put gains in value since you can sell higher (22,000) while the market trades lower.
In simple terms:
Calls = Right to Buy
Puts = Right to Sell
How Options Work (Premiums, Strike Price, Expiry, Moneyness)
Every option has certain key components:
Premium: The price you pay to buy the option. This is determined by demand, supply, volatility, and time to expiry.
Strike Price: The fixed price at which the option holder can buy/sell the asset.
Expiry Date: Options are valid only for a certain period. In India, index options have weekly and monthly expiries, while stock options usually expire monthly.
Moneyness: This defines whether an option has intrinsic value.
In the Money (ITM): Already profitable if exercised.
At the Money (ATM): Strike price equals the current market price.
Out of the Money (OTM): Not profitable if exercised immediately.

XAUUSD (GOLD) NEXT TARGET PRICE $4000 OR $2755 XAUUSD (GOLD) NEXT TARGET PRICE $4000 OR $2755 THE Real Commodity King Neal Bhai Forecast.

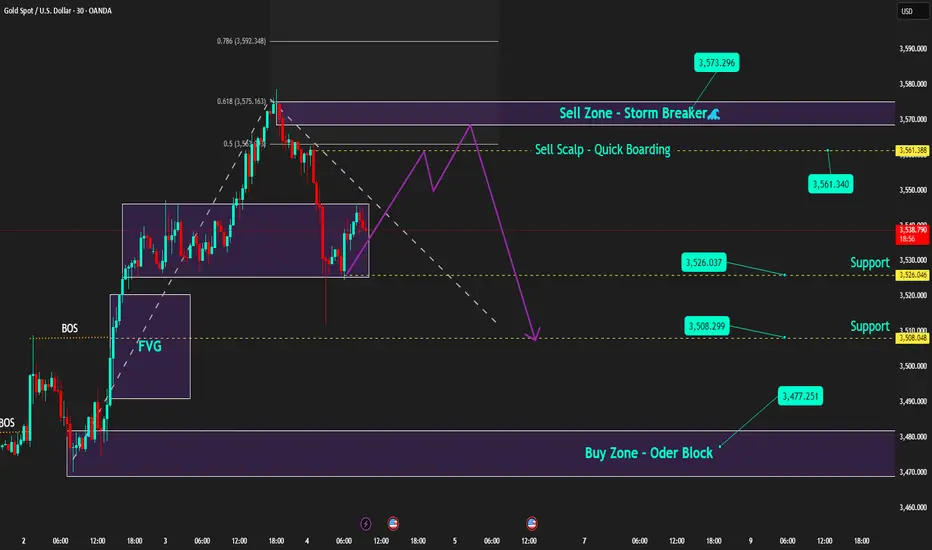
FED dovish, Gold stays bullish; SELL only for scalps⚓️ Captain Vincent – Gold Plan XAU/USD
1. Market Wave 🌍
The probability of a FED rate cut in September surged to 96.6% (vs 90.4% earlier) after the JOLTS report showed weakening job prospects.
Several FED officials, from Kashkari to Bostic, shifted dovish. Only Musallim maintained a hawkish stance with a scenario of just one cut.
👉 Result: Capital flows returned to Gold as the No.1 safe haven, pushing prices strongly higher overnight.
📌 Key data today (04/09 – US time):
ADP Nonfarm (7:15)
Jobless Claims (7:30)
ISM Services PMI (9:00)
➡️ This trio of data will be crucial catalysts for GOLD volatility.
2. Technical Analysis ⚙️
On M30/H1, Gold continues to form bullish BOS, keeping the main trend upward.
Golden Harbor 🏝️ (Buy Zone 3,477 – 3,479): Old Order Block, strong support if price pulls back.
Quick Boarding 🚤 (Sell Scalp 3,561 – 3,563): Only for short-term scalps.
Storm Breaker 🌊 (Sell Zone 3,573 – 3,575): Aligned with Fibo 0.618–0.786, strong resistance with potential selling pressure.
Captain’s Shield 🛡️ (Support): 3,526 – 3,515 – 3,508
3. Captain Vincent’s Map – Trade Scenarios 🪙
🔺 Golden Harbor 🏝️ (BUY – Priority)
Entry: 3,477 – 3,479
SL: 3,470
TP: 3,480 → 3,483 → 3,486 → 3,491 → 349x → 35xx
🚤 Quick Boarding (SELL Scalp – Short Ride)
Entry: 3,561 – 3,563
SL: 3,569
TP: 3,558 → 3,555 → 3,552 → 354x
🌊 Storm Breaker (SELL Zone – Strong Resistance)
Entry: 3,573 – 3,575
SL: 3,581
TP: 3,570 → 3,565 → 3,560 → 3,555 → 35xx
4. Captain’s Note ⚓
"The golden sail is filled with wind as the FED turns dovish. Golden Harbor 🏝️ (3477) remains the safe haven to align with the bullish trend. SELLs are just Quick Boarding 🚤 scalps at Storm Breaker 🌊 , not long voyages."
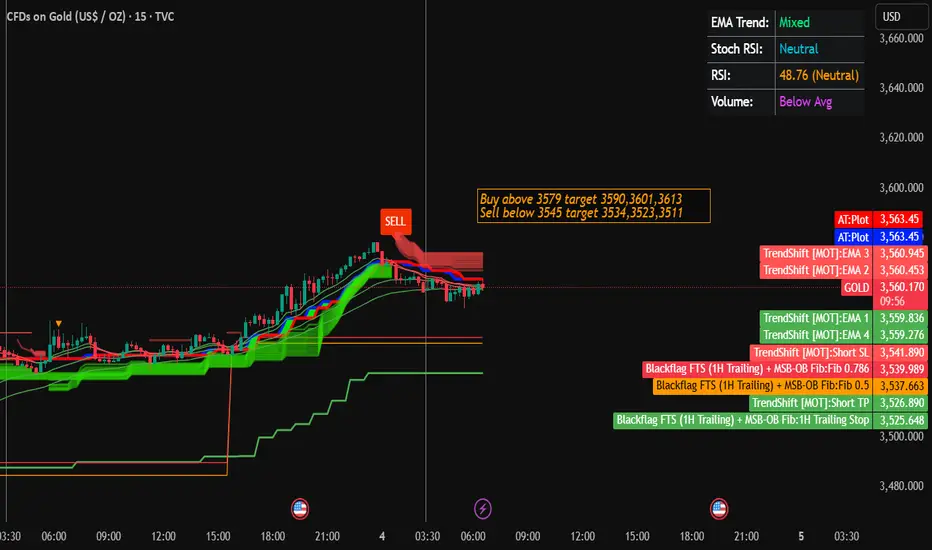
Gold Trading Strategy for 04th Sep 2025📊 Gold Intraday Trading Plan
✅ Buy Setup (Long Position)
Condition to Enter:
Wait for the 15-minute candle to close above $3579.
Buy Entry: Above $3579.
Targets:
First Target – $3590
Second Target – $3601
Third Target – $3613
Stop Loss (SL): Below recent 15-min support (e.g., $3570).
Example:
If the 15-min candle closes at $3581, you can enter a buy trade at around $3582–$3583.
If price moves to $3590, you book your first profit.
If it continues higher, trail your stop-loss to lock in profits while aiming for $3601 and $3613.
✅ Sell Setup (Short Position)
Condition to Enter:
Wait for the 1-hour candle to close below $3545.
Sell Entry: Below $3545.
Targets:
First Target – $3534
Second Target – $3523
Third Target – $3511
Stop Loss (SL): Above recent 1-hour resistance (e.g., $3555).
Example:
If the 1-hour candle closes at $3543, you can enter a sell trade around $3542–$3544.
If price falls to $3534, that’s your first target.
If it keeps dropping, trail your stop-loss and aim for $3523 and $3511.
⚠️ Important Notes for Beginners
Always wait for candle close confirmation. Don’t jump in before the candle closes, as fake breakouts can trap traders.
Use strict stop-loss. This protects you if the market moves opposite.
Trade with small lot size in the beginning to control risk.
Risk-Reward Ratio (RRR): Always aim for at least 1:2 RRR (risk $1 to gain $2).
📌 Disclaimer
This analysis is for educational purposes only and not financial advice. Trading in gold or any market involves significant risk, and past performance does not guarantee future results. Please consult with a financial advisor before making trading decisions. Trade at your own risk.
“Gold Shines Bright | Bullish Momentum Targeting $3,700🔎 Technical Analysis – XAU/USD (1H Chart)
Trend: Strong bullish trend confirmed, with price making higher highs and higher lows.
Buy Zone: Around 3,590 – 3,600 USD, where buyers stepped in aggressively.
Short-Term Target 🎯: 3,650 – 3,700 USD (already highlighted on chart).
Key Support Levels:
3,561 USD (near-term support)
3,490 USD (major support, bullish structure invalidation if broken)
📌 Outlook: As long as price holds above the buy zone, momentum favors bulls with potential continuation toward 3,700+ USD.
🌍 Fundamental Drivers for Gold Bullishness ✨
Federal Reserve Rate Cuts Expectations 🏦⬇️ – If the Fed signals easing or holds a dovish stance, real yields fall → Gold strengthens.
Weakening US Dollar (DXY) 💵📉 – A softer dollar makes gold more attractive to global investors.
Geopolitical Risks 🌍⚠️ – Rising global tensions increase demand for safe-haven assets like gold.
Central Bank Demand 🏦🔒 – Many central banks are adding gold reserves to hedge against currency risks.
Inflation Hedge 📊🔥 – Gold remains attractive when inflationary pressures stay elevated.

Elliott Wave Analysis XAUUSD – 03/09/2025
Momentum
• D1: Momentum is still overlapping. As mentioned in the previous plan, with 6 consecutive daily candles in this condition, a reversal may occur today or tomorrow.
• H4: Momentum is preparing to turn bearish. If a confirming candle closes, we may see a downward move on H4.
• H1: Momentum is also turning bearish but right above the oversold zone. This suggests the correction on H1 may be near completion, followed by another upward move.
________________________________________
Wave Structure
• D1: Price is still in an uptrend, possibly wave 1 of wave 5 or the final larger wave 5. Current wave targets are 3602 or 3667. This aligns with momentum on D1, which has been overlapping for 6 candles, signaling that in 1–2 more candles a reversal is likely.
• H4: A 5-wave purple structure is forming – the dominant structure of the current rally. Price is currently running in wave iii (purple).
o Inside wave iii purple, a 5-wave green structure has already formed and is nearing its final stage.
o Wave iii and iv green appear completed, and price is now in wave v green, which has broken the previous high of wave iii green, confirming its development.
• H1:
o The first target of wave v green was hit at 3542. The second target remains at 3585.
o Within wave v green, a 5-wave black sub-structure is visible.
o The Asian session opened with a breakout above the previous high, implying 2 scenarios:
1. Wave 5 black has completed after reaching the first target (3542).
2. Or it is forming a wave 4 black flat, holding above 3525 before heading to 3570–3585.
If price drops below 3525, it means wave 5 black has completed. Then, wave iv purple will target the zones 3498 and 3469 – areas to look for the next buy opportunity.
________________________________________
Trading Plan
• Buy Zone 1: 3500 – 3498
o SL: 3400
o TP1: 3524
• Buy Zone 2: 3471 – 3469
o SL: 3459
o TP1: 3500

Gold on Fire – Will XAUUSD Keep Breaking Higher?Gold (XAUUSD) is showing unstoppable momentum this month. With the US Dollar Index (DXY) weakening and markets expecting the Federal Reserve to cut interest rates, investor sentiment is shifting away from holding cash. For Indian traders, this means one thing: Gold is the ultimate safe-haven play right now.
🔎 Macro View
FED rate cut expectations → Pressure on USD → Bullish for Gold.
Risk sentiment: Investors worldwide are running to gold for safety.
With strong global inflows, gold could continue to make new all-time highs (ATHs) in the coming months.
📊 Technical Outlook (H1/H4)
Gold has been forming sideway accumulation zones followed by strong breakouts. This shows volume and market flow still favor bulls.
BUY ZONE:
3482 – 3480
SL: 3474
TP: 3486 – 3490 – 3495 – 3500 – 3505 – 3510 – 3520 – 3530 – 3540 – ???
SELL ZONE (only for short-term counter-trade):
3540 – 3542
SL: 3548
TP: 3530 – 3520 – 3510 – 3500 – ???
At the moment, there are no strong signals for selling. Trend bias = BUY on dips until we see sentiment reversal.
⚠️ Risk Note
The market is highly volatile right now with sudden liquidity sweeps. Always stick to TP/SL discipline to protect your account.
💡 Conclusion:
Gold remains in a powerful bullish trend, supported by both macro and technical factors. For Indian traders, the best strategy is to stay aligned with the bulls — buy dips and ride the wave.
✅ Follow MMFLOW TRADING for daily market plans and gold insights. Let’s capture this historic rally together!

XAU/USD – GOLD 08/09 | Captain VincentObserving JPY & USD | Buy still holds dominance
🔎 Captain’s Log – News Context
This morning there were no major new updates.
The US session tonight (08/09) will also not release big data.
The latest impact on the market is Japanese PM S. Ishiba’s resignation , which pressured JPY downward and slightly lifted the Dollar.
However, Gold only made a small correction and maintained strong stability.
➡️ Captain’s Summary: Dollar and JPY currently only have indirect influence, not enough to push Gold deeply lower. The main trend is still supported for a bullish rebound.
📈 Captain’s Chart – Technical Analysis
Captain’s Shield (Main Support):
Golden Harbor OB: 3542 – 3549
Main Buy Zone: 3549 – 3551
Liquidity Dock: 3573 – 3575
Storm Breaker (Resistance):
Quick Boarding: 3602 – 3604 (Short-term Sell scalp)
Storm Breaker Peak: 3632 – 3634 (Sell zone – may form a new ATH)
⏩ Price structure remains bullish (continuous BOS). Corrections are mainly liquidity grabs before pushing up to higher resistance zones.
🎯 Captain’s Map – Trade Scenarios
✅ Golden Harbor (BUY – Priority)
Buy Zone: 3549 – 3551 | SL: 3542 | TP: 3553 → 3557 → 3560 → 3563 → 35xx
Liquidity Dock: 3573 – 3575 | SL: 3565 | TP: 3578 → 3581 → 3583 → 35xx
⚡ Quick Boarding (SELL Scalp – Short-term)
Entry: 3602 – 3604
SL: 3610
TP: 3600 → 3597 → 3594 → 3591 → 3588 → 35xx
🌊 Storm Breaker (SELL Zone – New ATH)
Entry: 3632 – 3634
SL: 3640
TP: 3629 → 3625 → 3623 → 3619 → 361x
⚓ Captain’s Note
“The golden ship sails steadily as the seas remain calm this morning, with no big news waves. Golden Harbor 🏝️ (3549 – 3551) together with OB near 3542 is the safe anchorage for sailors riding the bullish trend. Liquidity Dock ⚓ (3573 – 3575) is just a temporary anchor before the bullish winds carry the ship further. Quick Boarding 🚤 (3602 – 3604) is for those who want to ride short-term waves. And if the ship touches Storm Breaker 🌊 (3632 – 3634) , it may be a new wave peak – but the grand journey is still headed North with the bullish sails full of wind.”

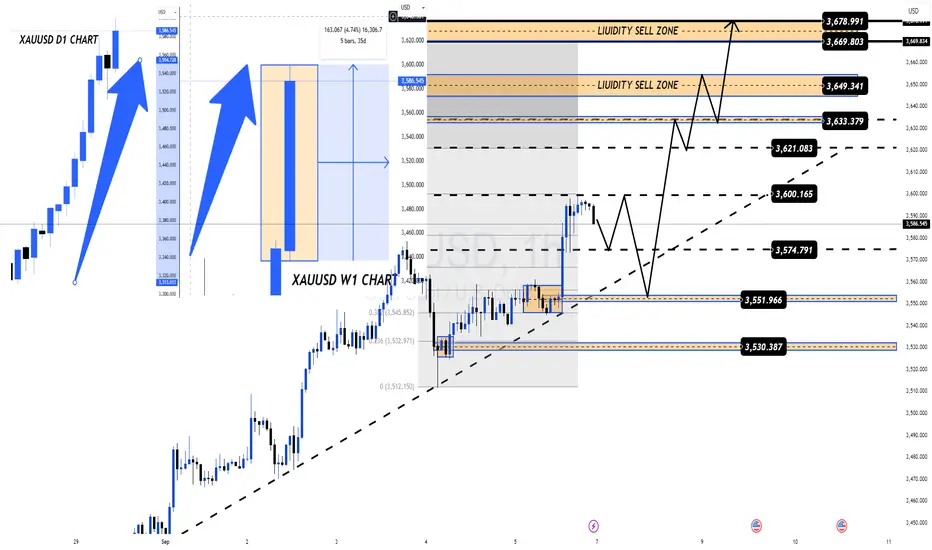
Weekly Outlook: Big Bullish Move + Key US DataMarket View:
Gold (XAUUSD) finished the week with strong momentum after Nonfarm pushed price close to $3600/oz ATH. On the daily chart, the candle closed almost full body (only ~30% wick), showing no profit-taking yet. The weekly chart is also strongly bullish – confirming that buyers are in control. This signals more upside likely in the coming week and month.
Key US Events This Week:
Wed, Sep 10: Core PPI & PPI m/m → If higher than expected, USD may strengthen short-term, creating pressure on gold.
Thu, Sep 11: CPI (Core, m/m, y/y) + Jobless Claims → the most important release. Lower CPI + higher claims = bullish for gold. Higher CPI = hawkish Fed = pressure.
Fri, Sep 12: UoM Consumer Sentiment & Inflation Expectations → could shift Fed outlook further.
👉 Fundamentals may bring volatility, but overall medium-term trend remains bullish.
Technical Outlook (H1 Chart):
After the Nonfarm breakout, gold is consolidating sideways. Levels to watch:
Support: 3574 – 3551 – 3530 – 3516
Resistance: 3600 – 3621 – 3633 – 3649 – 3669 – 3678
Trading Plan:
BUY bias (preferred):
Long on dips near 3574–3550
SL: below 3530
TP: 3600 → 3621 → 3633 → 3649 → 3669 → 3678
SELL scalp (alternative):
Only if 3530 breaks with strong CPI surprise → target 3516/3527
Summary:
✅ Gold stays in a strong uptrend on Daily & Weekly charts. Macro factors support more upside if inflation keeps easing.
👉 Watch 3592 (bullish trigger) and 3575 (bearish trigger) as the key decision levels.
Follow MMFLOW TRADING for daily plans and quick updates.
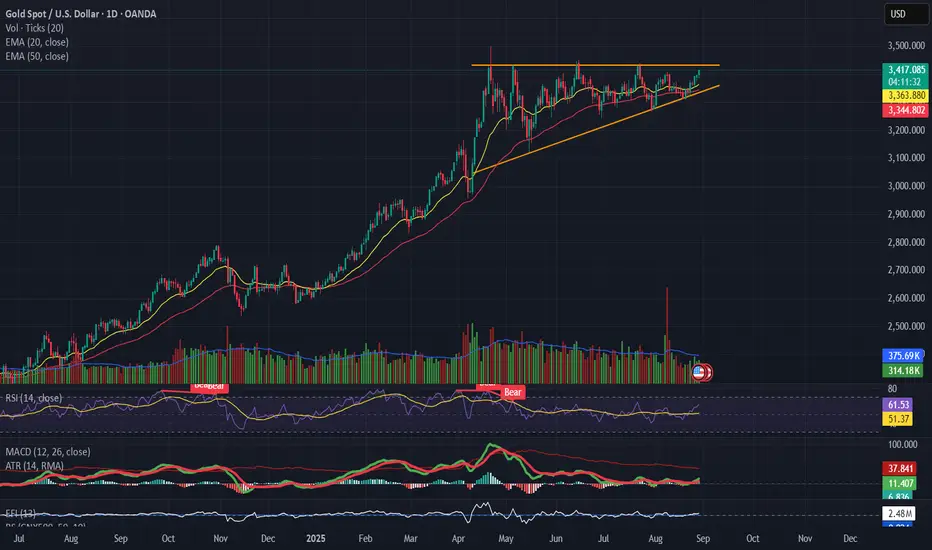
9.3 Gold Analysis9.3 Gold Analysis
Spot gold prices have now stabilized above $3,500/oz, continuing their historic upward trend.
The main factors driving the gold price increase include: rising market expectations for a September Federal Reserve rate cut and increased safe-haven demand. Furthermore, holdings of the SPDR Gold Trust, the world's largest gold-backed exchange-traded fund (ETF), increased by 1.32% on Tuesday to 990.56 tons, reaching their highest level since August 2022, reflecting strong investor demand.
Technically, the gold daily chart has closed higher for six consecutive days, demonstrating strong bullish momentum. However, after this consecutive rise, the market has shown signs of being overbought. Based on historical trends, a correction typically occurs after five to six consecutive days of gains. Key short-term support is the $3,508-3,500/oz range.
Trading Strategy
Gold: The market is closely watching Friday's release of US non-farm payroll data for further confirmation of the extent of the Fed's interest rate cut. After a continuous rise in gold prices, the risk of a technical pullback is increasing. Avoid chasing high prices and consider waiting for a pullback to support levels to enter the long position.
Trade with caution and manage risk. Best wishes for successful trading!

Gold (XAUUSD) 1:4 intraday buy scenario.Gold is in up move and forming a good buy scenario on 30/15-minute chart. It can be a very good intraday trade if everything goes as per plan.
1. 30/15m bullish FVG is pending and price is showing pull back towards it.
2. Most probably price will take liquidity of FVG and OTE zone and create MSS in LTF.
3. Order flow confirming bullish bias.
4. Price should show rejection/reversal in LTF at FVG zone.
All these combinations are signalling a high probability and high Risk and Reward (1:4) trade scenario.
Note – if you liked this analysis, please boost the idea so that other can also get benefit of it. Also follow me for notification for incoming ideas.
Also Feel free to comment if you have any input to share.
Disclaimer – This analysis is just for education purpose not any trading suggestion. Please take the trade at your own risk and with the discussion with your financial advisor.

Healthy Pause in Gold’s Rally, Bulls Still in ControlGold has finally started to show a healthy daily correction after its sharp rally and breakout above 3500. This pullback was not unexpected, as intraday charts were looking overstretched in the last sessions. Despite today’s dip, the broader structure remains strong with momentum still favoring the upside as long as key supports hold. For the short term, 3500 (previous high) will be the immediate level to watch, followed by 3450 as secondary support. Holding above these levels will keep the bullish trend intact, and any stabilization here can set the stage for another leg higher. Overall, the correction looks more like a consolidation phase rather than a reversal, keeping the bigger picture positive.

Gold Price Analysis – Testing Resistance near Sell ZoneAnalysis:
Gold (XAU/USD) is currently trading around 3,551.40, showing minor intraday losses (-0.03%). The chart indicates a strong resistance zone between 3,556–3,563, identified as the “sell zone,” with an All-Time High (ATH) slightly above at 3,578.12. Price is consolidating beneath this resistance, struggling to break higher.
The Fair Value Gap (FVG) below suggests a potential retracement toward 3,511–3,520 if sellers gain momentum. The Ichimoku cloud shows mixed signals, with price hovering around the equilibrium, indicating indecision in the short term.
A break above 3,563 could trigger bullish continuation toward ATH, while rejection at this level may lead to a pullback into the highlighted FVG region.

Gold - Buy near 3540, target 3558-3578Gold Market Analysis:
The market's greatest allure lies in its ever-changing nature. Yesterday, gold plummeted in the Asian session, plummeting to around 3510. It then hit the 5-day moving average on the daily chart and rebounded rapidly. It then went on to not only rebound, but also rise in a V-shaped pattern. Your supposed sell-off was a lie. The daily chart ultimately closed with a bearish hammer candlestick pattern. The long lower shadow suggests yesterday's sharp drop was fleeting. Gold has not yet shifted its buying trend. Today is the time for the non-farm payroll report, and I predict a period of volatile correction with a buying bias. If gold can rally to a new high in the Asian session today, consider buying directly. Our approach in the Asian session is to buy low and then wait for the non-farm payroll data. It's difficult to determine whether 3578 on the daily chart is the high point, and the pattern doesn't signal a peak. The 1-hour chart shows a new support level near 3540. Buying in the Asian session is possible based on this support level. Furthermore, support from moving averages and indicators is near 3531. This level, which represents daily support, presents a buying opportunity. If gold reaches 3578 during the Asian session, do not consider selling. The strategy of buying at low prices can be maintained until the release of the non-farm payroll data.
Support levels are 3531 and 3540, while resistance levels are 3578 and 3560. The dividing line between strength and weakness is 3540.
Fundamental Analysis:
Recent fundamentals have not significantly stimulated the market. Today, we will focus on the US non-farm payroll data.
Trading Recommendation:
Gold - Buy near 3540, target 3558-3578

Simple Support & Resistance Strategy on XAUUSDThis chart illustrates a simple but effective support and resistance trading approach.
Support Levels:
Support 1: Acts as a key demand zone where buyers may step in if price revisits this area.
Support 2: A minor intraday support that can provide short-term bounce opportunities.
Resistance Levels:
Resistance 1: The broader supply zone where sellers previously pushed price lower.
Resistance 2: A closer level that may act as a barrier for short-term upward moves.
What’s Happening:
Currently, price has broken below Support 2 and is testing downward momentum. Two possible scenarios are highlighted:
Price retests Support 1, holds, and then bounces back toward Resistance 2.
Price fails to hold at Support 1, leading to further downside continuation.
Probability Outlook:
If buyers defend Support 1 strongly, probability favors a bounce toward Resistance 2.
If Support 1 breaks with volume, probability favors a bearish continuation move to lower levels.
This setup shows how simple zone-to-zone trading can provide clear potential paths without overcomplication.
👉 Always remember: This is not financial advice, but an educational demonstration of support/resistance principles.

Gold Surges 37% YTD: Fed Cuts, Jobs Slump & Trade Setups!Namaste, traders! Gold (XAU/USD) has skyrocketed 37% in 2025, building on a 27% rally in 2024, fueled by a weakening USD, central bank buying, loose monetary policies, and global economic/geopolitical unrest. With US jobs growth tanking in August 2025 and unemployment climbing to 4.3%, markets are betting big on Fed rate cuts: 90% chance of 0.25% and 10% for 0.5% in September. Let’s dive into today’s (08/09/2025) action and uncover trading opportunities tailored for Indian investors! 💰
Fundamental Analysis: Why Gold Keeps Shining Bright 🌟
Massive Rally: Gold thrives in low-rate, high-uncertainty environments—perfect for India’s gold-loving market! Weak USD and central bank purchases are key drivers. 📈
US Jobs Slump: August data shows a sharp slowdown in hiring and a 4.3% unemployment rate, boosting Fed rate cut expectations and safe-haven demand.
Fed Drama Fuels Gold: Trump’s attempt to sack Fed Governor Lisa Cook and pressure for rate cuts has sparked legal battles, shaking USD confidence. Tariff tensions (Trump’s appealing to the Supreme Court after lower court losses) further drive gold as a hedge. Standard Chartered sees more upside amid these uncertainties.
Demand Dip in India: Record-high prices have slowed physical gold demand in India and China this week, but the bullish outlook remains strong for Indian investors chasing safety.
Gold’s your ultimate bet in this volatile market—will the Fed’s next move keep the rally alive?
Technical Analysis: Breakouts & Liquidity Grabs—Stay Sharp! 📉
In today’s early Asian session, gold dipped to 358x before a swift rebound, smashing last week’s ATH resistance at 3600 and hitting 361x. No major news triggered this spike, but continuous ATHs mean fast liquidity sweeps—beware of traps! Avoid FOMO: Focus on broken round levels for BUY setups or structure breaks at round numbers for SELL, but watch out for false breakouts.
Key Resistance: 3614 - 3624 - 3634 - 3644
Key Support: 3597 - 3581 - 3574 - 3566 - 3560 - 3550
Trading Opportunities:
Sell Scalp: 3624 - 3626
SL: 3630
TP: 3621 - 3616 - 3611 - 3606
Sell Zone: 3634 - 3636
SL: 3644
TP: 3626 - 3616 - 3606 - 3596
Buy Scalp: 3596 - 3594
SL: 3591
TP: 3599 - 3604 - 3609 - 3614
Buy Zone: 3581 - 3579
SL: 3571
TP: 3589 - 3599 - 3609 - 3619
Gold’s breaking out, but fakeouts are everywhere—wait for confirmations at key levels! If supports hold, bulls could push for new highs. 📊💡

XAU USD WEEKLY CHART Xau USD gold given massive return in last some months . U can Check on our chart . It's given buy on weekly chart near 1932 . Now Xau USD standing near 3560+ that's a massive return. You can check my old views on Xau USD of 15 min Chart.
Still we can see good movement from here on 15 min Chart . Good Support near 3550 .
Consult Your Financial Advisor Before Making any position in stock market/ XAU USD .
