XAUUSD – Maintaining the Core Uptrend (BUY Bias)
Hello traders,
On the H4 timeframe, gold continues to show a steady upward trend. After testing the upper trendline, price bounced back and is now consolidating around the 386x region. This suggests the market may be in an accumulation phase, awaiting major news.
Fundamental Context
Tomorrow, the market will look towards the release of the Nonfarm Payrolls (NFP) data, an event that often brings strong volatility to gold prices.
In addition, concerns around the potential US Government shutdown are adding to the macro uncertainty, further supporting gold’s safe-haven appeal.
At present, there is little evidence to suggest gold will decline, particularly when other markets are also breaking higher.
Technical Analysis
Price continues to trade within the ascending channel on H4, with buyers holding the advantage.
MACD remains above the zero line, showing no clear signs of weakness.
Price is likely to consolidate further in the 3860 – 3870 range before a sharp move triggered by news.
Trading Plan
Buy Setup (preferred – trend following)
Entry: 3829 – 3832
SL: 3825
TP: 3845 – 3862 – 3877 – 3890
Sell Scalping (counter-trend, higher risk)
Entry: 3927 – 3930
SL: 3934
TP: 3915 – 3900 – 3882 – 3865
Note: Sell setups should be treated only as short-term scalps, as the primary bias remains on the buy side.
Conclusion
Gold is holding firmly within the uptrend structure, with no significant weakness yet. Given the backdrop of political uncertainty and the upcoming NFP release, the priority remains buying at suitable support zones. Any sell trades should be viewed as quick reactions rather than core positions.
👉 Follow me to get the latest updates as soon as price structure changes.
Trade ideas

Gold Trading Strategy for 02nd October 2025📊 Gold Intraday Trading Plan
👉 Timeframe: 15-Minute Candle Strategy
🟢 Buy Setup (Long Trade)
✅ Condition: Enter only if a 15-min candle closes above ₹3878
🎯 Targets:
₹3889
₹3899
₹3905
🛑 Stop Loss: Place below the candle low that gave the breakout
💡 Explanation
Wait for a 15-minute candle to fully close above 3878.
Do not enter if the price just spikes above – wait for the close to confirm.
Once confirmed, buy with the targets mentioned.
🔴 Sell Setup (Short Trade)
✅ Condition: Enter only if a 15-min candle closes below ₹3853
🎯 Targets:
₹3842
₹3831
₹3823
🛑 Stop Loss: Place above the candle high that gave the breakdown
💡 Explanation
Wait for the candle to close below 3853 before selling.
Enter only after confirmation, not during the dip.
Keep stop loss strict to protect capital.
⚖️ Key Notes
⏳ Be patient — confirmation matters more than speed.
🛑 Always use stop loss — never trade without it.
📉 Risk only a small portion of your capital (1–2%).
Record your trades and review them daily.
⚠️ Disclaimer
This is educational information only and not financial advice. Trading in gold or any market involves risk of capital loss. Please consult your financial advisor before making any investment or trading decisions.

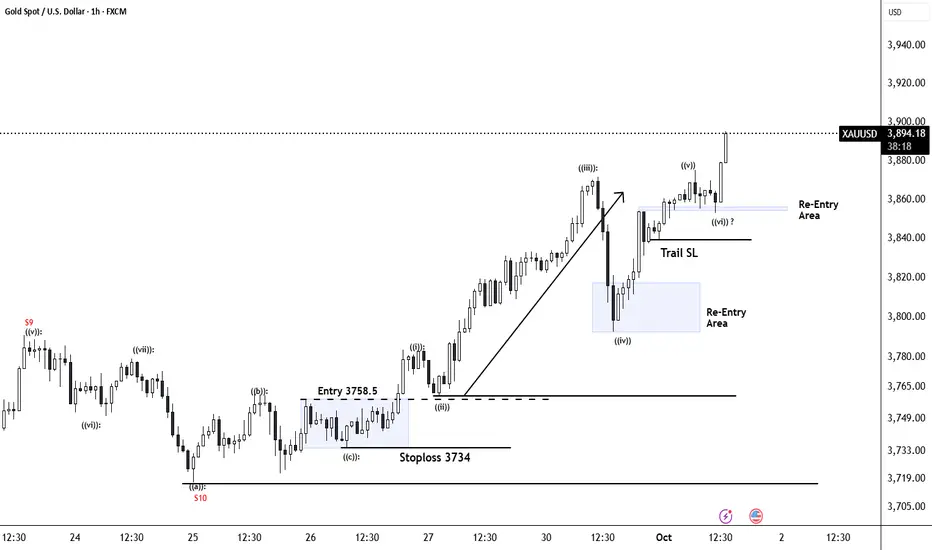
Gold Market Analysis – Sell Opportunity Emerging in XAU/USDGold has been climbing with strong momentum, but the current leg is showing signs of transition. After a period of consolidation, the market expanded upward, taking liquidity from previous highs and creating an extended run. This behavior often reflects the final stage of a bullish cycle before rebalancing begins.
What stands out now is the engineered path of price: a push into untested liquidity zones above, followed by a potential shift as large players unwind positions. Once liquidity is collected at the extremes, price tends to rotate back into inefficiencies left behind during the rapid climb.
This suggests gold is not simply trending higher, but moving through a liquidity cycle. The near-term structure favors a sweep of higher levels, then a corrective phase where price retraces to refill imbalances and reset order flow for the next directional move.

Gold holding buy from 3820 , upside 3910,3955,3990Gold holding buy trade from 3820 , upside target 3910,3955,3990
How My Harmonic pattern projection Indicator work is explained below :
Recent High or Low :
D-0% is our recent low or high
Profit booking zone ( Early / Risky entry) : D 12.3% -D 16.1 % is
range if break them profit booking start on uptrend or downtrend but only profit booking, trend not changed
SL reversal zone (Safe entry ) : SL 23.1% and SL 25.5% is reversal zone if break then trend reverse and we can take reverse trade
Target : T1, T2, T3, T4 and .
Are our Target zone
Any Upside or downside level will activate only if break 1st level then 2nd will be active if break 2nd then 3rd will be active.
Total we have 7 important level which are support and resistance area
Until , 16% not break uptrend will continue if break then profit booking will start.
If break 25% then fresh downtrend will start then T1, T2,T3 will activate
1,3,5,10,15,20 minutes are short term levels.
30 minutes 60 minutes , 2 hours,3 hours, ... 1 day and 1 week chart positional and long term levels

spot gold or mcx gold update as per chartgold spot looks stair pattern or now news in focus usa shut down--
technical lvl- spot gold abv 3883 looks again up side 3900-3920--3945$ where support 3860$ which break blow with volume than more down fall 33852--42--34$ expect.
mcx gold sustain abv 118300 looks 119k near where support 117700 which can be create down correction in evening side.

ATH $3871: Shutdown Fear & 97% Fed Cut Fuel Gold Surge
Hello, investors and traders!
Gold continues to show phenomenal strength, setting a new ATH at $3,871.45/oz (on Sept 30), and closing at $3,843.43/oz. This gain confirms the strongest September since 2011, solidly confirming the explosive growth trend for the yellow metal.
Fundamental Analysis: Politics and the Fed Drive Buying Wave
Two core drivers are pushing gold prices higher, making any attempt to short (call the top) extremely risky:
Political Instability: The risk of a looming US Government shutdown is ratcheting up uncertainty and strongly boosting safe-haven demand.
Low-Rate Expectations: Weakening US jobs data has nearly locked in the probability that the Fed will cut interest rates in October. The market is currently pricing in a 97% chance of a Fed rate cut.
Technical Analysis & Trading Strategy
After a recent shock drop of 70 points, Gold quickly absorbed the selling pressure and created a new ATH, proving that buying pressure is overwhelming. The strong upward bias is undeniable.
Outlook: Continue to Prioritize Buy given the powerful trend and supportive fundamentals. Only attempt Sell strategies near psychological resistance levels with an extremely tight Stop Loss (SL).
Key Resistance: $3894, $3904, $3914, $3924
Key Support: $3869, $3843, $3834
Suggested Trading Strategy (Absolute Risk Management):
BUY SCALP
Zone: $3870 - $3868 / SL: $3864
TP: $3875 - $3885 - $3900
BUY ZONE
Zone: $3834 - $3832 / SL: $3824
TP: $3842 - $3862 - $3892
SELL SCALP (High Risk)
Zone: $3904 - $3906 / SL: $3910
TP: $3901 - $3891 - $3876
SELL ZONE (High Risk)
Zone: $3925 - $3927 / SL: $3935
TP: $3917 - $3907 - $3897 - $3887 - $3877 - $3867
The market is running on fear and rate-cut anticipation. Are you betting on the $3900 mark this week? 👇
#Gold #XAUUSD #ATH #Fed #GovernmentShutdown #TradingView #InterestRates #FinancialMarkets

XAUUSD – Gold Smashes to New ATH: Bulls in Full Control📊 Market Overview
Gold has surged into uncharted territory, breaking through to a fresh All-Time High (ATH). The earlier dip toward 3,800 USD acted as nothing more than a springboard, allowing buyers to reload before launching this powerful breakout.
Safe-haven demand continues to fuel the rally, as concerns over a potential US government shutdown and expectations of more Fed rate cuts strengthen bullish momentum.
📍 Crucial Levels to Watch
🔴 SELL Reaction Zone
3,911 – 3,915 (Liquidity Resistance) → Potential short-term ceiling, profit-taking may appear here.
🟢 BUY Reaction Zones
3,830 – 3,820 (Fibo Support) → First pullback level for intraday buyers.
3,808 – 3,810 → Secondary support zone for a deeper correction.
3,747 – 3,752 (Liquidity BUY Zone) → Stronger base for swing buyers.
🎯 Trading Setups
1️⃣ Buy the Dip (Primary Play)
Entry: 3,830 – 3,820, confirmation needed.
Targets: 3,900 → 3,915, extend toward 3,950+ if momentum remains strong.
Stop: Below 3,808.
2️⃣ Sell the Spike (Countertrend)
Entry: 3,911 – 3,915, only on visible rejection.
Targets: 3,871 → 3,830.
Stop: Above 3,922.
3️⃣ Swing Buy Opportunity
Entry: 3,752 – 3,747 (Fibo confluence).
Targets: 3,830 → 3,900.
Stop: Below 3,735.
⚡ Pro Tips
Trend bias = Strongly Bullish, prioritize long setups.
Countertrend shorts are tactical; keep stops tight.
Headlines from the US political scene and Fed could trigger extra volatility at highs.
💬 Discussion
Will gold extend to 3,950 – 4,000 USD, or is a sharp pullback around the corner? Drop your views and charts below 👇

Gold |Power of Neowave AnalysisIf you have any doubts related to your stocks and portfolio, ask in the comments we will provide you Neowave Chart for that.
To understand my view Kindly watch the videos-
Video Analysis 01/10/2025
Video Analysis 30/09/2025
Video Analysis 29/09/2025
US Government Shutdown, Gold Benefits & FOMO BUY Continues📊 Market Context The gold market kicks off Q4/2025 with great enthusiasm as safe-haven flows continue to surge.
Not only that, the potential delay of the NFP employment report this week further fuels the market's "thirst" for directional information, positioning gold as the central asset in everyone's sights. Meanwhile, the USD is under pressure from political uncertainties and expectations that the Fed is moving closer to further rate cuts.
Combined, the current picture shows that gold is not only maintaining its strength after a breakout rally but also has the opportunity to expand and conquer new high price territories, as safe-haven capital and FOMO momentum from the BUY side continue to amplify.
🔎 Technical Analysis (H1/H4)
The price maintains the main upward trend, staying above the support structure.
Important BUY ZONE: 3833–3831 (Fibo + CP zone) – this area is likely to react strongly.
Secondary BUY ZONE: 3817–3815 (OBS zone) – stronger support, suitable for accumulating additional BUY orders.
Resistance area 3919–3923 (Liquidity Sell Zone) may be where liquidity traps appear.
✅ BUY ZONE 1: 3833–3831
SL: 3827
TP: 3838 - 3842 - 3846 - 3850 - 3855 - 3860 - 3870 - ???
✅ BUY ZONE 2: 3817–3815
SL: 3810
TP: 3822 - 3826 - 3830 - 3835 - 3840 - 3850 - 3860 - 3870 - ???
✅ Summary Gold is directly benefiting from political instability and the delay in US economic data. The main trend remains BUY with safe-haven flows, with strategic zones at 3833–3831 and 3817–3815. The expansion target aims for 3870–3880 and beyond to 3920+ if buying momentum remains strong.

Gold 1H – Correction or Continuation After Supply Test?Gold on the 1H timeframe is trading near 3,861 after consolidating below a premium supply zone at 3876–3874. Structure shows a recent BOS to the upside, but current rejection signals potential engineered liquidity sweeps into the nearby FVG and discount demand zones. The first support rests at 3796–3798, aligning with discount territory and previous accumulation, offering scope for continuation if price reacts positively.
From the macro side, today’s headlines point to persistent U.S. dollar strength as traders await fresh Federal Reserve guidance on inflation and rate path. Meanwhile, heightened geopolitical concerns in energy markets are maintaining safe-haven flows, adding volatility to gold’s intraday swings.
This dual backdrop sets up a tactical approach: fading rejections at supply while being prepared to enter on discounted dips at demand.
________________________________________
📌 Key Structure & Liquidity Zones (1H):
• 🔴 SELL GOLD 3876–3874 (SL 3883): Premium supply zone, downside targets at 3850 → 3835 → 3815.
• 🟢 BUY ZONE SUPPORT 3796–3798 (SL 3790): Discount demand zone aligned with BOS, upside targets at 3820 → 3845 → 3860+.
________________________________________
📊 Trading Ideas (Scenario-Based):
🔻 Sell Setup – Supply Rejection (3876–3874)
• Entry: 3876–3874
• Stop Loss: 3883
• Take Profits:
TP1: 3850
TP2: 3835
TP3: 3815
🔺 Buy Setup – Demand Mitigation (3796–3798)
• Entry: 3796–3798
• Stop Loss: 3790
• Take Profits:
TP1: 3820
TP2: 3845
TP3: 3860+
________________________________________
🔑 Strategy Note
Gold remains in a corrective phase after testing supply. Expect liquidity sweeps into discount levels before continuation. With the dollar strengthening and Fed commentary in focus, intraday traders should:
• Fade supply rejections at 3876–3874.
• Scale into buys around 3796–3798 if liquidity is cleared.

XAUUSD Daily Plan – Gold’s Pullback Before the Next Leg Higher📊 Market Overview
Gold has pulled back from its fresh record highs but the move looks more like healthy accumulation than a reversal. The 3,800 zone has acted as a strong support, absorbing selling pressure and keeping the broader bullish trend intact. Immediate rebounds confirm that buyers are still in control, preparing for the next breakout.
📍 Key Levels to Watch
🔴 SELL Reaction Zone
3,871 – 3,872 → First resistance level, possible short-term rejection.
3,915 – 3,920 (Fibo Liquidity Zone) → Stronger sell wall where profit-taking may appear.
🟢 BUY Zones
3,808 – 3,810 (Fibo 0.786 Support) → Important reaction zone for intraday buy setups.
3,747 – 3,752 (Fibo Liquidity Buy Zone) → Deep correction level, strong long-term demand area.
🎯 Trading Scenarios
1️⃣ Bullish Continuation Setup
Entry: Buy near 3,808 – 3,810 on bullish candlestick confirmation.
Targets: 3,871 → 3,900+
Stop: Below 3,795
2️⃣ Deep Pullback Opportunity
Entry: 3,747 – 3,752 if price flushes lower.
Targets: 3,808 → 3,871
Stop: Below 3,735
3️⃣ Countertrend SELL Setup
Entry: 3,915 – 3,920 only with strong rejection.
Targets: 3,871 → 3,808
Stop: Above 3,928
⚡ Trading Notes
Gold remains in a strong bullish channel – selling should only be tactical and short-term.
Watch US political headlines and end-of-month flows, as they could trigger volatility.
Stick to defined Fibo zones for best risk-to-reward setups.
💬 Community Discussion
Do you think Gold will test 3,900+ this week or will we see a deeper correction first? Share your charts and ideas below 👇

GOLD ATH: US Shutdown Drama! Buy The Dip, Yaar? Gold just smashed a new record at $3,833.37/oz (Sept 29) on high safe-haven demand due to the impending US Govt shutdown (Oct 1) and solid FED rate cut hopes. USD pullback (0.2%) also playing its part.
The sudden dip to $3,794 looks like pure end-of-month profit-booking, not a proper reversal. If US tensions worsen, the Buy opportunity is still very much active!
📈 Technical View & Intraday Trade Setup
Gold has done a major flush, stopping out the weak hands. Selling pressure is there, but the drop without big news suggests caution. Look for a technical bounce to fill the FVG before a potential continuation lower.
Key Levels:
Resistance: $3827 / $3846 / $3870
Support: $3787 / $3778 / $3763
Detailed Trading Strategy (US Session):
1. BUY Zone (Aggressive Dip Buy):
Entry: $3784 - $3782
SL: $3774
TP: $3792 / $3812 / $3832
2. SELL Scalp (Quick Short):
Entry: $3827 - $3829
SL: $3833
TP: $3824 / $3814 / $3804
3. SELL Zone (Main Short Entry):
Entry: $3866 - $3868
SL: $3876
TP: $3858 / $3838 / $3818
⚠️ Alert! The US Government Shutdown news is the main event. If budget talks are positive, Gold might see a sharp fall. Manage risk (SL) like a boss!
Kya lagta hai? Will Gold fly to $4K or take support near $378x? 👇
#XAUUSD #Gold #MCX #TradingStrategy #USShutdown #FED #TechnicalAnalysis #Intraday #MarketUpdate #Commodities

Elliott Wave Analysis XAUUSD – 01/10/2025📊
________________________________________
🔹 Momentum
• D1:
Momentum is still rising but already entering the overbought zone → buying power is weakening. Price may continue to rise or move sideways in the short term, but the risk of reversal is increasing.
• H4:
Momentum is still pushing upward. Until it reaches the overbought zone and reverses, price can continue to rise or consolidate sideways.
• H1:
Momentum is moving into oversold territory and preparing to turn upward. This aligns with H4, suggesting another short-term push higher.
________________________________________
🔹 Wave Structure
• D1 Wave:
Price is still within Wave 5. Yesterday it reached the second target zone – a strong resistance area and potential top.
Once D1 momentum reverses in overbought territory, a major correction will be confirmed.
Note: If a correction occurs on D1, it will likely last longer than Wave 2 and Wave 4 → avoid catching swing bottoms too early.
• H4 Wave:
A strong drop yesterday gave sellers momentum, but price quickly recovered and is now testing highs.
With both D1 and H4 momentum showing more room to rise, price may still push higher.
→ Use the H4 price channel as a key observation tool.
• H1 Wave:
A 5-wave structure (12345 black) is forming. Wave 5 is usually the hardest to predict due to FOMO-driven buying.
As warned yesterday, long swing trades are risky. After a sharp drop, price rebounded but momentum signals weakness.
Multiple Wave 5 structures are converging near 3885, making this a high-probability reversal zone.
________________________________________
🔹 Trade Plan
• Sell Zone: 3885 – 3887
• Stop Loss: 3895
• Take Profit:
o TP1: 3830
📌 Notes:
• This is a sensitive potential top zone → volatility is usually unpredictable.
• If selling at 3885, use small position size and strict SL discipline.
• Best approach: wait for further confirmation before committing heavily.

Gold Sets Record Close, Will Bulls Push Toward 3900 Next?Gold printed another all time high yesterday and closed with the strongest daily, monthly, and quarterly close on record. As expected with month-end and EOQ flows, we saw a phase of profit booking, but price quickly found support around the psychological 3800 level and Weekly R1 (3806), which is holding as a key demand zone for now. The overall structure remains bullish, and today gold is attempting to break above the previous day high / previous month high. A confirmed H4 close above this level would likely fuel continuation toward the next psychological milestone at 3900. On the downside, a breakdown below 3800 could open room for a corrective move into lower supports. For the near term, the market is trading within a range of 3810–3865/70, and a decisive breakout from this band will likely define the next directional leg.

XAUUSD / GOLD / GC Analysis 01-OCT-2025LTP 3863
Supports: 3355/3110/2721/1921
As long as Gold supported by the above levels, we can see 3991-4385 next.
Bigger picture targets: 3748(done)-3991-4385 (Min target)
Further targets:
4934
5420-5655-6036 (Normal target)
7082-7334-8116 (ultimate target)
Extension 11225.
NOTE: I expect big correction between 3748-3991-4385 levels to 3355-3110-2721 before next bull run towards 5K+.
BUY ON DIPS VIEW

XAUUSD – US Government Shutdown Pressure on Gold
Hello Traders,
For the first time since 2018, the US Government is facing the risk of a shutdown. This can only be avoided if Congress passes new funding legislation, but the timing remains uncertain. This political backdrop is exerting strong pressure on the financial markets, and gold – the traditional safe haven asset – has become the focal point for investors.
Technical Outlook
Gold continues to set new ATHs right in the Asian session today, indicating the uptrend remains intact.
The upward price channel on H4 maintains a beautiful structure, with the main trend continuing to favour buying.
Yesterday's dip was merely a "liquidity sweep," after which the price quickly returned to its upward momentum.
Short positions can be considered when the price hits strong resistance, combining Fibonacci + Trendline, to optimise winning probabilities.
Trading Scenario
Sell (short-term at resistance):
Entry: 3884 – 3886
SL: 3890
TP: 3872 – 3860 – 3845 – 3830
Buy (aligning with the main trend):
Entry: 3820 – 3823
SL: 3816
TP: 3835 – 3850 – 3862 – 3880
Conclusion
Gold remains strongly supported by the political instability in the US.
The medium-term strategy continues to prioritise Buying at support zones, while Selling should only be considered when there is a clear reaction at resistance zones.
Traders need to closely monitor political news, as any developments related to the US government could alter the short-term structure of gold.
Follow me for the quickest updates on new scenarios as the price path changes.

LiamTrading – Follow the Buy trend, target ATH 3915
The gold market continues to demonstrate the strength of an upward trend. After yesterday's shakeout, we witnessed a very clear Long Squeeze: all buying forces were forced to exit, but immediately after, the price quickly rebounded. This is the hallmark of a strong trend – the more it shakes out, the more momentum it creates for a new peak.
Today's perspective:
Continue to follow Buy, do not SELL against the trend.
The Buy position from 3797 is still being held, if the price returns to retest, we will continue to add orders.
Prioritise observing the POC of the Volume Profile to place Buy orders; if the price adjusts deeper, the VAL area coinciding with the rising trendline will be an extremely safe buying point.
Trading scenario
Buy 3847–3844, SL 3840, TP 3868 – 3880 – 3900 – 3915
Buy 3821–3819, SL 3814, TP 3835 – 3850 – 3868 – open
In summary: The upward trend remains extremely strong, the short-term target is ATH 3915. Stick to the trend, prioritise Buy to maximise profits.
This is my personal view on XAUUSD. Please follow the scenario and stay tuned for my updates.

LiamTrading – Gold continues to be “crazy”LiamTrading – Gold continues to be “crazy”: Strong trend, but awaiting reaction at 3900
Gold has just recorded its 39th all-time high in 2025, now approaching the 3,900 USD/oz mark. This is not only a significant psychological threshold but also coincides with extended Fibonacci levels, making this area a sensitive point in the market.
Trend & Trendline
On the H4 chart, gold remains firmly within the upward channel formed since early September. The price continuously bounces off the lower trendline and expands its range towards the upper boundary.
The lower trendline around 3760–3780 acts as a dynamic support. If the price breaks below this area, a deeper correction scenario towards 3720–3730 will be triggered.
The upper trendline is currently “pressing” the price right at the 3897–3900 area, confluencing with the 2.618 Fibonacci. This is a strong resistance, potentially causing profit-taking reactions and creating a technical pullback.
Volume Profile & Liquidity
The 3800 and 3720 areas are dense volume clusters, indicating significant capital is positioned here. These are also potential Buy zones when the price corrects.
The 3640–3650 area is a larger liquidity cluster, but will only be activated if a strong breakdown occurs from the current trendline.
Reference Trading Scenarios
Sell zone: 3897 – 3900, SL 3905, TP 3885 – 3862 – 3850 – 3833
Short-term Buy zone: 3797 – 3800, SL 3793, TP 3822 – 3840 – 3855 – 3872 – 3890
Medium-term Buy: 3720 – 3730, SL 3710, TP 3760 – 3800 – 3850
Conclusion
The upward trend remains very strong, but the 3897–3900 area will be a crucial challenge. If the price is rejected here, we might witness a correction back to the lower trendline before gold continues towards the larger target of 4000 USD.
This is my personal view on XAUUSD. Please manage risks carefully and stay updated with the latest scenarios.

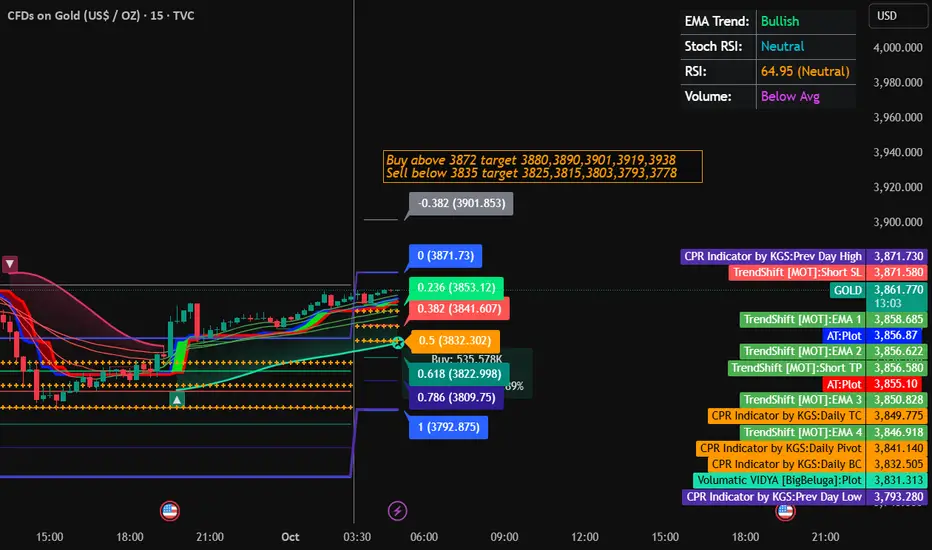
Gold Trading Strtegy for 01st October 2025📈✨ Gold Trading Setup (XAU/USD)
🔑 Buy Setup
✅ Buy above the high of the 1-hour candle if price closes above $3872
🎯 Targets: $3880,$3890,$3901,$3919,$3938
🔑 Sell Setup
✅ Sell below the low of the 1-hour candle if price closes below $3835
🎯 Targets:$3825,$3815,$3803,$3793,$3778
⚠️ Risk Management
Always use a Stop-Loss (SL) to protect capital.
Recommended SL for buys: just below $3865.
Recommended SL for sells: just above $3845.
Do not risk more than 1–2% of your capital per trade.
📌 Additional Notes
This setup is based on 1-hour candle close confirmation.
Patience is key – wait for the candle to close above/below levels before entering.
Manage trades by booking partial profits at each target 🎯 and trailing SL.
⚖️ Disclaimer
📌 This is not financial advice. Trading gold (XAU/USD), forex, or commodities involves significant risk and may not be suitable for all investors.
💰 Prices are highly volatile and can move quickly against your position.
🧾 Always do your own research (DYOR), consult with a professional financial advisor, and trade responsibly.
Gold Trading Strategy | October 1✅ 4-Hour Chart Analysis
Gold surged to 3871 before pulling back sharply, showing strong resistance at that level.
Support was found in the 3790–3800 zone, followed by a rebound. Currently, the candlesticks are fluctuating above the mid-band (around 3837), but remain capped by the upper band at 3855–3860.
The MACD histogram has contracted significantly, indicating weakening bullish momentum and stronger pressure at the highs.
The 4-hour chart shows gold is still in a high-level consolidation range, with strong resistance above and solid support below, reflecting clear range-bound characteristics.
✅ 1-Hour Chart Analysis
The MA5 has crossed above the MA10 again, showing short-term stabilization.
The Bollinger Bands are narrowing, with price trading above the mid-band, signaling a short-term consolidation pattern.
The MACD histogram is shrinking, showing that bearish momentum is weakening and bulls may gradually recover.
🔴 Resistance Levels: 3855–3860 / 3870–3872
🟢 Support Levels: 3825–3830 / 3790–3800
✅ Trading Strategy Reference
🔰 If gold faces resistance around 3855–3860 and fails to break through, consider short positions with targets at 3830–3825, and further down to 3800 if broken. Stop-loss above 3872.
🔰 If price pulls back to 3825–3830 and finds support, light long positions can be considered with targets at 3855–3860. Stop-loss below 3815.
🔰 If price breaks above 3872 effectively and holds, it could open the door for further upside. Light long positions may be taken with targets at 3890–3900.
✅ Conclusion
Gold is currently fluctuating within the 3800–3870 range, with a short-term bias toward rebound recovery but facing clear resistance above. Trading is best approached with a range-bound strategy (sell highs, buy lows) as the main plan, and breakout-following as secondary, while strictly controlling stop-loss levels.

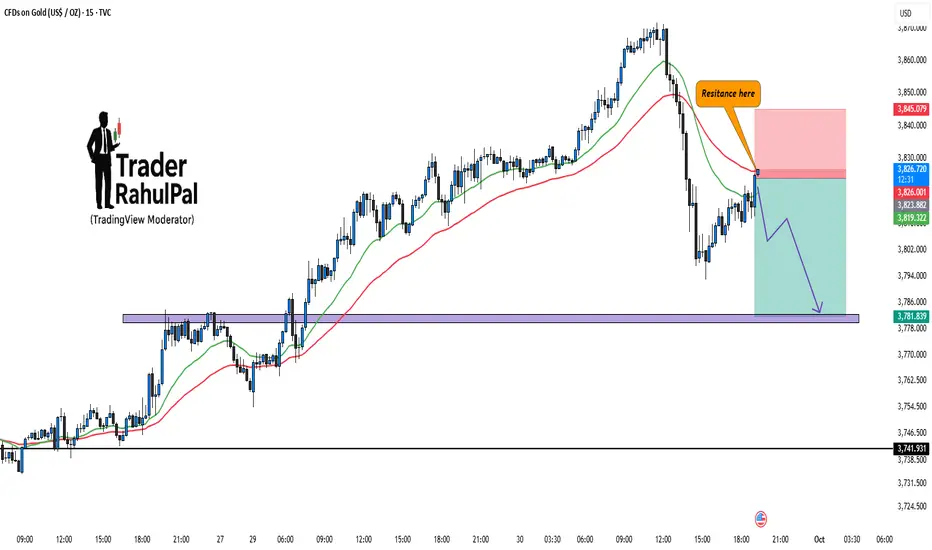
Gold – Resistance at 3840, Contra Move in Play?Gold has approached the 3825 and at high around 3840 resistance zone where sellers are likely to step in. Price rejection from this area can trigger a downside move toward the 3775–3780 support zone.
Currently, the setup favors a contra play, with risk defined above the resistance zone and reward potential aligning with the lower support.
Disclaimer: This analysis is for educational purposes only and should not be considered financial advice. Please do your own research or consult your financial advisor before trading.
XAUUSD – Gold Daily Plan | Sharp Drop, What’s Next?Gold printed a sudden 70+ point drop from 388x to 380x, leaving traders questioning:
– Was this a big player manipulation?
– Or simply institutional profit taking?
Key reaction zones will define if Gold holds above 3800 or dives deeper.
📍 Critical Levels
🔴 SELL Reaction Zone
387x → Strong resistance where sellers may step in.
🟢 BUY Zones
3780 (Retest Breakout + Trendline) → First demand zone.
375x (Fibo Support Zone) → Strong liquidity pocket, potential reversal.
🎯 Trading Scenarios
1️⃣ SELL Idea
Entry: 387x
Targets: 3800 → 3780
SL: Above 3888
2️⃣ BUY Idea
Entry: 3780 – 375x
Targets: 3838 → 387x
SL: Below 3745
⚡ Trading Notes
High volatility expected near 3800 psychological mark.
Stick to zone trading – avoid mid-range traps.
Monitor USD strength; any spike could pressure XAU further.
💬 Discussion
Do you think Gold will break below 3800 or bounce back to test 387x? Drop your views 👇

The Unstoppable Rise of GoldTechnical Analysis (XAU/USD):
Gold is trading around $3,816, showing continued bullish strength along the upward trend line. Price has respected higher lows, confirming buyers remain in control. Key short-term support levels are visible at $3,797, $3,759, and $3,718. As long as price stays above the $3,718 zone (major support), the bullish structure remains intact.
The chart indicates two bullish scenarios:
A direct continuation higher from current levels.
A potential retest of the $3,797 – $3,759 zone before another push upward.
Upside targets in the coming sessions stand between $3,860 – $3,900, with further momentum potentially extending beyond $3,925.
Fundamental Analysis:
Safe-Haven Demand: Persistent geopolitical uncertainties and global economic slowdown fears are keeping gold attractive as a safe-haven asset.
Central Bank Policies: If the Fed maintains a dovish stance or signals rate cuts, real yields may decline, further boosting gold.
Inflation Hedge: Despite cooling in some regions, sticky inflation supports long-term gold demand.
Central Bank Purchases: Record gold buying by global central banks continues to provide a solid floor under prices.
Conclusion:
Gold remains in a strong bullish phase, with technicals showing steady upward momentum and fundamentals reinforcing demand. Any dips toward $3,759–$3,718 may offer buying opportunities as long as the trendline holds, while the broader outlook points toward further gains.
