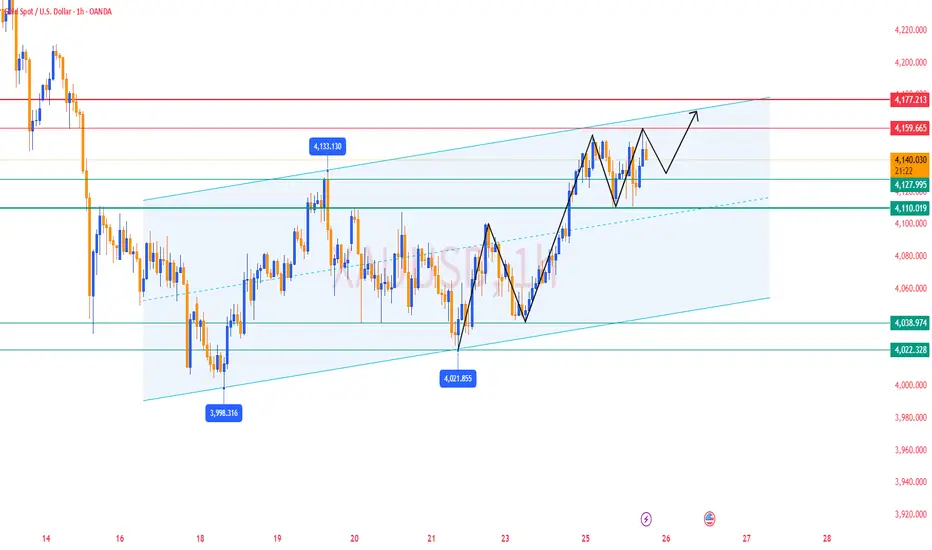
My Gold Trade Plan Gold is moving in a Triangle 🪭
Possible a short trade move can be made till tomorrow
Trade ideas

USD Stunned: Buy Gold at the Adjustment Bottom!1. Fundamentals Quick Take
US Data: Positive (Jobless Claims 216K, lowest in 7 months, Durable Goods +0.5%).
Fed Policy: Extremely Dovish. Fed officials hint at a 25bps rate cut as early as December.
Impact: Low interest rate expectations push DXY down: Strong support for Gold.
2. Technical Outlook - H1
Trend: Strong Uptrend.
Position: Price is below Resistance/Supply (CP Zone - around 4,175 - 4,195). High likelihood of short-term adjustment.
Strategy: Focus on BUY (Long) at strong Demand/Support zones, do not Short based on short-term reactions.
Ideal Long Zone: Around 4,129 or 4,096.
Conclusion: Wait for price to adjust to the Demand zone to enter Long orders following the main trend, based on the USD's decline momentum from Fed signals.
#XAUUSD #Gold #Fed #DXY #TradingView

Gold may continue rising — Trading around 4,150–4,200 range📊 Market outlook:
• Spot gold is currently around 4,150 USD/oz.
• It is up roughly +0.20% (≈ +8 USD) over the past 24 hours.
• The rise is supported by expectations that the Federal Reserve (Fed) may cut interest rates soon, making non-yielding assets like gold more attractive.
📉 Technical view (short-term):
• Support zone: ~ 4,130 – 4,140 USD/oz — watch for a retracement bounce.
• Resistance zone: ~ 4,180 – 4,200 USD/oz — a breakout could trigger further gains.
• In a low-interest environment and with ongoing macro uncertainties, gold remains a safe-haven asset — bullish bias continues.
📌 Interpretation:
• In the short term, gold is likely to rise further if expectations of rate cuts remain strong.
• If U.S. economic data comes in stronger and the Fed turns hawkish → a minor correction is possible.
• Current bias: upside, but sensitive to U.S. economic data and Fed signals.
💡 Trading Strategy:
🔺 BUY XAU/USD: 4,135 – 4,132
🎯 TP: 40 / 80 / 200 pips
🛑 SL: 4,129
🔻 SELL XAU/USD: 4,185 – 4,188
🎯 TP: 40 / 80 / 200 pips
🛑 SL: 4,192

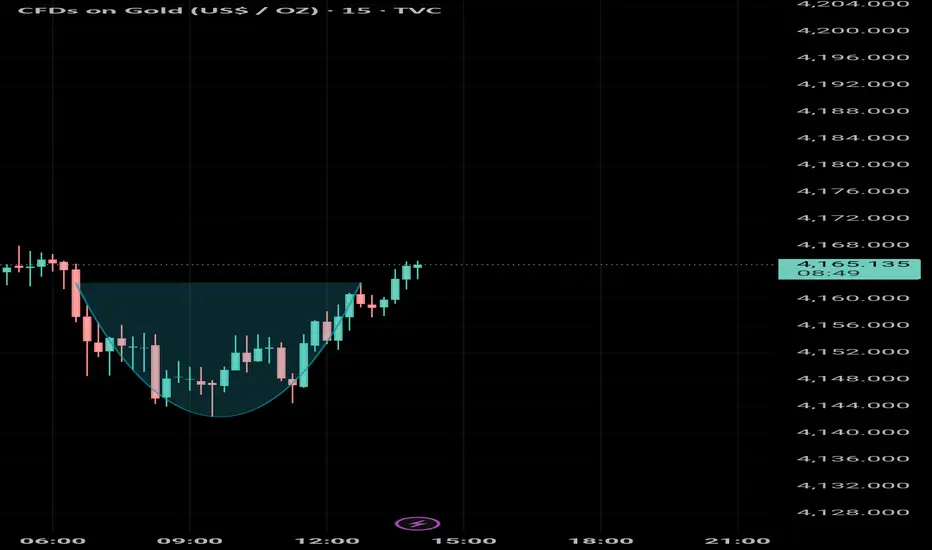
Round Bottom BreakOut Above 4162 more RISE awaited 🤞
Expected to hit :
TP 1: 4174
TP 2: 4180
TP 3: 4184+
XAU/USD: Gold Stagnates, Poised for a Strong Surge📊 Market Structure
Gold is moving in a tight accumulation phase (compression) between two important zones:
• OB Support: 4,130 – 4,126
• Resistance – Small Supply: 4,148 – 4,166
The previous trend remains a strong uptrend (clear BoS sequence from 4,089), and currently, the price is retesting the newly formed peak-bottom structure.
The BUY side is still in control as long as the price stays above:
• 4,130 – Main OB Support
• 4,104 – Discount FVG
• 4,089 – Key Low Confirming Trend
If gold holds these zones, the next targets will be the upper liquidity levels:
• 4,166
• 4,181
• 4,207
• 4,243
💎 Key Technical Zones
• OB Support 1: 4,130 – 4,126
• FVG Zone: 4,104 – 4,089 (best discount)
• Deep Bearish OB: 4,060 – 4,045 (if price drops sharply)
• Upper Liquidity Targets: 4,166 → 4,181 → 4,207 → 4,243
🎯 Trading Plan (Priority BUY)
1️⃣ BUY 1 – Retest OB 4,130
When the price touches the OB support zone 4,130 – 4,126 and shows a bounce signal (rejection / engulfing).
• Entry: 4,130 – 4,126
• SL: below 4,115
• TP1: 4,166
• TP2: 4,181
• TP3: 4,207
• TP4: 4,243
→ Quick setup, good RR, trend aligned.
2️⃣ BUY 2 – Discount FVG 4,104 – 4,089
This is the best BUY zone if the market drops sharply before rising.
• Entry: 4,104 – 4,089
• SL: 4,070
• TP1: 4,166
• TP2: 4,181
• TP3: 4,207
• TP4: 4,243
→ Strong confluence: FVG + fibo discount + key liquidity.
3️⃣ BUY 3 – Deep Accumulation at Bearish OB Shift
• Entry: 4,060 – 4,045
• SL: 4,020
• TP: 4,104 → 4,166 → 4,207
→ Only activate if “flush liquidity” appears.
🎯 SELL Scalp (secondary – not priority)
Only SELL when there is a clear rejection reaction at:
• 4,166 – first liquidity sweep zone
• 4,181 – strong reaction zone
• 4,207 – main bearish OB
• 4,243 – large liquidity peak
• SL: 10–15 USD
• TP: 4,148 → 4,130
→ For scalpers only, not a main setup.
🧠 Vincent’s View
The market structure remains completely bullish. The market is accumulating energy in a narrow range before breaking strongly to the upper liquidity targets.
As long as gold stays above 4,089 – the uptrend remains dominant.
“Patience builds the entry – liquidity completes the move.” ⚜️
⏰ Timeframe: 1H
✍️ Analysis by: Captain Vincent

Gold H1 - Can Gold reject 4167 and fall to 4133 today?🟡 XAUUSD – Intraday Smart Money Plan | by Ryan_TitanTrader (27/11)
📈 Market Context
Gold is trading inside an intraday consolidation after a strong H1 displacement. The session is now primed for liquidity engineering before the next leg.
Key narrative drivers traders must respect today:
• Stronger USD expectations continue to shape risk sentiment
• Institutional desks frequently exploit sweep zones during consolidation
• Range-bound conditions favor fakeouts → displacement → expansion mechanics
• Headlines around U.S. monetary tone amplify intraday volatility
The current chart highlights balanced liquidity both above and below structure, supporting a two-way SMC playbook.
🔎 Technical Framework – Smart Money Structure (H1)
Market is holding a rising channel, but internally ranging — a typical liquidity map scenario:
• Buy-side liquidity pocket: 4180 → 4182 (premium extreme)
• Sell-side liquidity pool: 4110 → 4133 (discount extreme / origin zone)
• Internal equilibrium zone: 4150–4170 chop region (no-trade area)
We expect this sequence:
Sweep → CHoCH/BOS → Displacement → Retest → Expansion.
🎯 Trade Plans for Today
🔴SELL GOLD 4180–4182 | SL 4190
Thesis: Premium liquidity sweep above local highs before downside displacement.
Activation rules:
• Price sweeps 4182 liquidity
• Bearish CHoCH/MSS + BOS down on M5–M15
• Imbalance retest / FVG entry after structure break
Targets:
• 4167 (nearest reaction)
• 4150 (equilibrium raid)
• 4135–4133 (discount retest)
🟢 BUY GOLD 4135–4133 | SL 4125
Thesis: Sell-side liquidity sweep into the origin zone before upside impulse.
Activation rules:
• Price taps 4133 pool (sweep below structure)
• Bullish CHoCH/MSS + BOS up on M5–M15
• FVG fill / bullish rejection wick confirmation
Targets:
• 4155+
• 4167 (reclaim zone)
• 4180+ (premium raid target)
⚠️ Risk Management
• Do NOT trade inside 4150–4170 without clear displacement
• Wait for CHoCH + BOS before execution
• Treat the upper and lower zones as liquidity traps, not trend entries
• Reduce size during news spikes unless structure confirms
• SL = wave invalidation, no averaging in chop
📝 Summary
Gold is in accumulation/redistribution mode. Desks may:
• Run buy-side liquidity at 4182, then displace down → retest discount
or
• Sweep sell-side liquidity at 4133, confirm CHoCH up → expand with impulse
Today is a liquidity session, not early trend chasing. Execute only after confirmation.
📍 Follow @Ryan_TitanTrader for daily Smart Money updates.

XAUUSD BUY OR SELL TODAY?1. Main Market Context for Today
Jobless claims came in better than expected → USD strengthens, but gold did not drop — it continued to move sideways → the market is in accumulation and waiting for a breakout.
Today’s priority strategy is range trading:
Lower range: 4130–4135
Upper range: 4170–4175
Once price breaks clearly out of either range → switch to trend-following (pursuit) trading.
2. Range-Trading Plan (Primary Strategy for Today)
(A) Buy at the Lower Range – 413X Zone
Buy area: 4130–4135
SL: 100 pips
TP: 100 pips
Reason: This is the main demand zone and aligns with the ascending trendline shown on your chart.
➡️ Strategy:
Wait for price to “sweep” the lows → show confirmation → then take a quick BUY trade.
(B) Sell at the Upper Range – 417X Zone
Sell area: 4170–4175
Reason: Strong supply zone with repeated reactions.
➡️ Strategy:
Wait for a rejection candle (pin bar / bearish engulfing) → then SELL.
3. Current Reaction Zone – 414X
This is the zone price is currently testing.
Do not enter immediately; just observe:
If price bounces strongly from 414X → target is to retest 417X
If 414X breaks → price will likely retest 413X → better BUY entries there.
4. Deeper BUY Zones (If Price Breaks Downward)
Here are the levels you mentioned, organized clearly:
BUY Zone
4110–4108
4102–4100
4096–4094
→ These are deeper liquidity zones below the main range, activated only if gold breaks below 413X.
5. SELL Zones if Price Breaks Upward (Above 417X)
SELL Zone
4202–4200
4194–4190
4183–4180
→ These are upper supply retest zones, activated only after price breaks above 417X.
🟨 6. Main Scenarios for Today
Scenario 1 – Expected Sideway (Highest Probability)
Price moves within 413X – 417X, bouncing between the range limits.
→ Trade the range (scalp/intraday).
Scenario 2 – Break Below Range
If 4130 breaks → price will head to 4110 → 4100 → 4094
→ BUY at deeper zones.
Scenario 3 – Break Above Range
If 4175 breaks → price will aim for 4183 → 4194 → 4200–4202
→ SELL at higher zones.
✅ One-Line Trading Summary
Trade primarily within the 413X–417X range (buy low – sell high). If the range breaks, switch to trend-following using the deeper BUY zones or higher SELL zones provided above.

Plan the day - Trade the plan Hello traders , here is the full multi time frame analysis for this pairs, let me know in the comment section below if you have any questions , the entry will be taken only if all rules of the strategies will be satisfied. wait for more price action to develop before taking any position. I suggest you keep this pair on your watchlist and see if the rules of your strategy are satisfied.

Gold Analysis and Trading Strategy | November 26–27✅ From the 4-hour chart, gold pulled back noticeably after forming a short-term high at 4173, indicating strong selling pressure above. The price has repeatedly failed to hold above 4170, confirming the effectiveness of the upper resistance. The price is currently trading above MA5 and MA10, but short-term bullish momentum is weakening. The Bollinger Bands are slightly narrowing, showing that the market has entered a high-level consolidation range. Overall, gold remains in a high-level sideways structure, with limited bullish continuation and a tendency for pullbacks after pushing higher.
✅ From the 1-hour chart, gold rebounded quickly after gaining support at 4136, but once again showed a long upper shadow after testing 4173, indicating rejection. Although MA5 and MA10 remain upward-sloping, the candlesticks are repeatedly being pushed down, suggesting a short-term choppy structure. The Bollinger upper band is suppressing the price, and multiple attempts to break through have failed.
The 1-hour chart shows a weak upward attempt followed by consolidation, and price action above 4170 shows a lack of willingness from buyers to chase higher levels—short-term momentum remains weak.
🔴 Resistance Levels: 4170–4175 / 4182–4190
🟢 Support Levels: 4136–4140 / 4109–4115
✅ Trading Strategy Reference
🔰 1. Short on Rebounds (Main Strategy)
📍 Sell lightly in the 4170–4175 zone
🎯 Targets: 4156 / 4145 / 4136
⛔ Stop-loss: Above 4182
Reason:
H4 and H1 both show repeated failure to break higher
Long upper shadows indicate strong selling pressure
This zone is the top of the high-level consolidation range
🔰 2. Buy on Pullbacks (Secondary Strategy)
📍 Consider long positions near 4136–4140
🎯 Targets: 4160 / 4170
⛔ Stop-loss: Below 4128
Reason:
4136 is today’s key support and the previous rebound point
Short-term moving averages provide support below
As long as 4136 holds, price remains in a buy-the-dip zone within the consolidation structure
📌 Summary
Gold remains in a high-level consolidation structure:
Strong resistance at 4170–4175 → easy to pull back after testing
Solid support at 4136–4140 → buyers tend to step in on dips
📌 Short-term rhythm:
Sell high, buy low — trade within the 4136–4175 range.


Gold (XAU): Fed Cut Incoming? Breakout Time!I. 📰 FUNDAMENTAL ANALYSIS (FA)
The Vibe: The US Dollar (DXY) is facing serious heat! The US Fed's recent dovish signals are a major tailwind for non-yielding Gold.
Fed's New Tune: Big guns like Governors Williams and Waller are now talking about rate cuts soon. Why? Because US economic data (Retail Sales, Consumer Confidence) is getting weaker, boss.
Market Buzz: The market is pricing in a strong nearly 85% probability of a 25bps rate cut in December. Picture clear, right?
Takeaway: This shift is Massively Bullish for Gold because lower interest rates make the Dollar less attractive.
II. 📈 TECHNICAL ANALYSIS (TA)
The Scene: Gold is currently bumping heads with a major hurdle – the Discount Zone (our supply zone). The real action is here!
Crucial Resistance: Gold is testing the Discount Zone (the main resistance area). This is the make-or-break level.
The Short Game (Bearish): Wait for a clear rejection signal at this resistance zone. If it holds, a correction is coming.
The Long Game (Bullish): For Gold to go on a proper rally, it needs a Strong Breakout and Close above the entire resistance area.
💡 THE STRATEGY
Focus on the Resistance Level: Trade based on Confirmation, whether that's a reversal signal for a short correction, or a strong breakout for a fresh long position.
Don't miss the US data tonight (Durable Goods/Jobless Claims) – it will be the real fire starter!
#GoldTrading #XAUUSD #ForexIndia #FedRates #DovishFed #TechnicalAnalysis #MarketUpdate #FinanceIndia

XAU/USD – Gold Maintains Uptrend, Monitor Reaction at FvG⏰ Timeframe: 30m
📅 Update: 25/11/2025
🔍 Market Context
After breaking the downtrend structure and creating consecutive bullish CHoCH, gold is maintaining above the Break–FvG zone at 4,107 USD, indicating that buying pressure is still controlling the recovery phase.
The price is in a reaccumulation phase after the break, and it is likely to need a short pullback to "gain momentum" towards the extended resistance zone above.
📊 Technical Structure
FvG Zone (4,107 USD): newly formed balance zone – acts as the main BUY Zone, where price reactions can be observed for quick scalping opportunities.
Break Structure: confirms active buying flow after a series of CHoCH, shifting short-term bias to bullish.
Target Expansion: the 4,188 → 4,228 USD range is an extended resistance band, coinciding with Fibonacci 1.272–1.618.
💎 Key Levels
🟢 Main Support (Support Zones):
• 4,067 USD – technical balance bottom, the last defense zone.
• 4,084 USD – secondary support, confluence with Fibo 0.382.
• 4,107 USD – main FvG zone, monitor reaction for buy scalp.
• 4,131 USD – dynamic support in the recovery cycle.
🔴 Resistance (Resistance Zones):
• 4,155 – 4,165 USD → intermediate resistance zone, potential short-term profit-taking when price reacts.
• 4,188 USD → confluence with Fibo 1.272 – short-term SELL Zone.
• 4,203 – 4,211 USD → extended supply zone, monitor reaction before the US session.
• 4,228 USD → extended resistance, the final target of the current uptrend.
🎯 Market Outlook
1️⃣ Priority Scenario:
– Price may retest the FvG zone – 4,107 USD, then bounce to test resistances 4,155 → 4,188 → 4,228.
– Prioritize monitoring reactions – quick scalping at resistance zones, avoid holding long positions as price approaches 4,211–4,228.
2️⃣ Alternative Scenario:
– If price closes below 4,107 USD, it may reopen the lower balance zone around 4,067 USD.
🧠 Analyst’s View
The market structure leans towards bullish continuation, but the upper zone is approaching a dense resistance cluster – suitable for reactive trading strategies:
→ Observe reactions at each zone to "scalp with the flow," rather than trying to hold the trend.
As long as price maintains above 4,107 USD, the priority remains buy-the-dip – take-profit-on-resistance.
🛡️ Risk Note
Short-term volatility is expanding – clear candle reaction confirmation is needed before taking action.
Analysis is for technical and educational purposes, not investment advice.

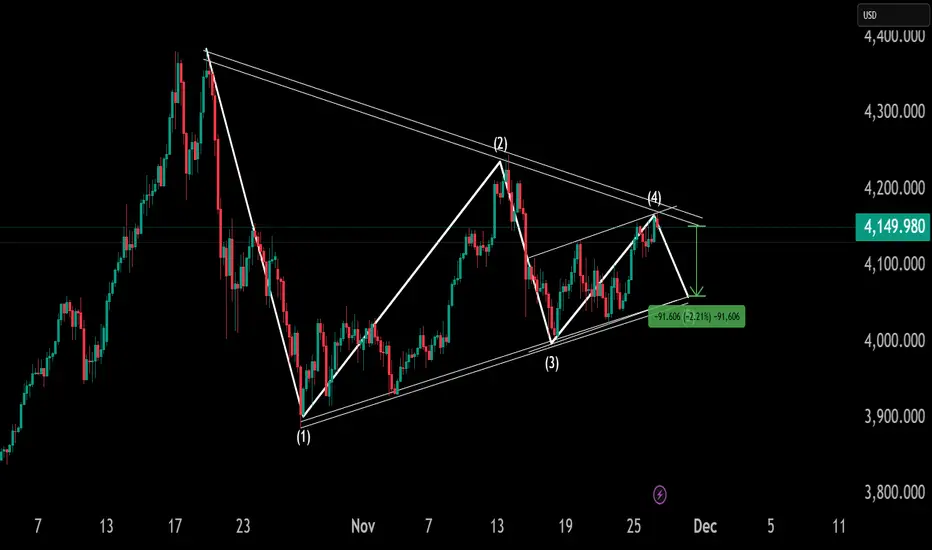
GOLD is making Symmetrical Triangle PatternGold is currently making Symmetrical triangle pattern
If GOLD doesn't cross 4180 then it has very high probability to come down
Also if GOLD breaks 3995 level then
We may witness 3700-3800 level in coming weeks
Keep and eye on 4180 level for the upside
Upside is possible till 4300-4350 range if GOLD breaks the resistance
Thank You !!
XAUUSD – H4 Trend Structure Awaiting BreakoutXAUUSD – H4 Trend Structure Awaiting Breakout
Brian – Strategy to Buy on Pullback in Uptrend Channel
I. Strategy Summary
Gold continues its uptrend on H4, supported by the upward trendline from the 3,880–3,900 region.
The price is testing the resistance zone of 4,133–4,150, coinciding with the H4 supply and descending trendline, making short-term corrections likely.
Main strategy: wait for a pullback to support/FVG to buy with the trend, avoid FOMO buying at resistance.
Key levels to note: closing below 4,000 weakens the uptrend structure; below 3,884 risks shifting to a medium-term downtrend.
II. Macro Context
Unemployment Claims (weekly unemployment benefits):
Forecast: 226K
Previous: 220K
Higher-than-expected figures → indicate a weakening labor market, cooling economy, increasing the likelihood of the Fed easing sooner → real yields decrease, supporting gold.
Better-than-expected figures (lower than forecast) → support USD and bond yields, potentially causing short-term pressure on gold.
Geopolitical:
Trump's statement on easing "deadline" pressure for Russia–Ukraine negotiations ("the deadline will be when the issue is resolved") helps the market worry less about a hard deadline, but conflict risks remain. The demand for gold as a safe haven remains stable, not overly inflated but also unlikely to disappear entirely.
III. Fundamental Picture
Expectations for a rate cut cycle in 2025 continue to support gold as the market gradually prices in lower real interest rates in the medium to long term.
The demand for holding defensive assets persists amid slowing global growth and unresolved geopolitical hotspots.
In the short term, USD and US bond yields remain the two leading variables; any USD recovery can pull gold back to technical support areas, creating opportunities for buy-on-dip strategies.
IV. Technical Structure – H4 Trend Channel & FVG Zone
On H4, the price is moving within an uptrend channel, with the support trendline respected multiple times since the end of last month.
Above is the descending trendline connecting the nearest peaks, creating a price compression zone as the market approaches the 4,133–4,150 area. This is a confluence resistance zone:
The nearest swing high.
H4 supply zone.
Intersection with the descending trendline.
Notable price zones:
Resistance: 4,133–4,150 – a zone that may trigger short-term profit-taking and create a correction.
Near support/FVG: 4,078–4,080 – FVG zone combined with support after the previous breakout.
Psychological support: 4,000 – if H4 closes below this area, the uptrend structure weakens.
Medium-term reversal level: 3,884 – closing below here opens the risk of shifting entirely to a medium-term downtrend.
V. Trading Plan
Scenario 1 – Buy with the Trend (Priority)
Idea: wait for a shallow pullback to near support in the H4 uptrend channel and then buy.
Entry: 4,111–4,114
SL: 4,005
TP: 4,133 – 4,150 – 4,172 – 4,190
Scenario 2 – Buy Deep at FVG Zone
Idea: if a stronger pullback to FVG 4,078–4,080 occurs, take advantage of the good price zone to buy.
Entry: 4,078–4,080
SL: 4,073
TP: 4,100 – 4,115 – 4,142
VI. Risk Management & Notes
Limit opening new orders at the time of Unemployment Claims announcement due to potential volatility and spread widening.
If H4 closes below 4,000, reassess all current buy positions.
If H4/Daily closes below 3,884, consider the medium-term uptrend structure broken; prioritize staying out to observe or wait for a new downtrend scenario instead of continuing to look for buying points.

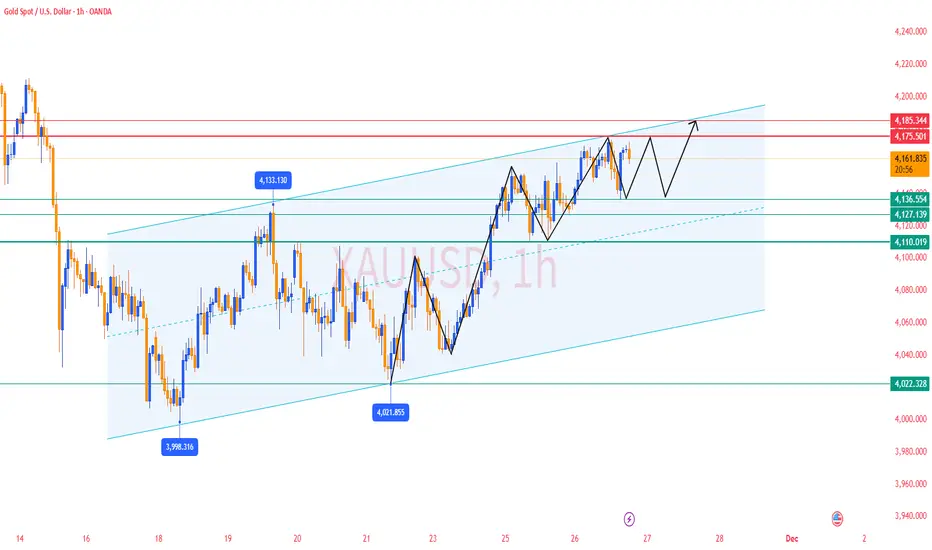
Gold Holds Near 2-Week Highs as USD Softens Ahead of Fed CutsGold continues to trade firmly near recent highs as the USD weakens amid growing expectations of a Fed rate cut in December.
The earlier pullback was mostly driven by stronger risk appetite in equities, not by gold weakness itself — meaning the macro bullish backdrop remains intact.
With markets now pricing:
76% chance of a December rate cut,
and almost 90 bps of cuts by end-2026,
the broader environment continues to favour upside on dips.
📊 Technical Outlook – MMF Style (H1/H2)
Price has respected the ascending trendline drawn from the early-week swing low and is now pushing above the 0.618–0.786 retracement zone.
Key Levels
BUY Zone 1: 4,132 – 4,149 (Fibo 0.382–0.618 + demand)
BUY Zone 2: Trendline retest area
Target Zone: 4,188 – 4,195 (1.272–1.618 Fibo extension)
Structure is currently bullish, with clear higher highs and higher lows.
A retracement into 4,14x before continuation higher is the most probable scenario.
🎯 MMF Trading Plan (Intraday)
Primary Setup – BUY Dip Continuation
BUY: 4,132 – 4,149
SL: 4,121
TP:
→ 4,168
→ 4,185
→ 4,192 – major extension target
Alternative Scenario – Break & Hold Above 4,170
If price consolidates above 4,170, expect a direct push toward 4,19x without a deep pullback.
Bearish Scenario (Low probability for now)
Only valid if price breaks below trendline + closes under 4,128.
Target would be a deeper correction toward 4,10x — but this is not the base case.
🧠 MMF View
Gold’s structure + macro narrative → bullish trend intact.
The market is clearly positioning ahead of possible December policy easing — dips into 4,13x–4,14x remain attractive opportunities.
“In a rate-cut environment, gold tends to trend — the only task is to buy from strength, not chase.”

XAU/USD: Gold Bullish, Watch for Pullback to 4,150-4,130⏰ Timeframe: 30m
📅 Update: 26/11/2025
🔍 Market Context
After a strong upward trend and breaking the resistance zone of 4,096 USD, gold enters a technical correction phase to reaccumulate liquidity.
The price is currently fluctuating around the 4,150 USD area, serving as a crucial pivot to confirm whether the bullish structure will continue or require a deeper retracement.
📊 Technical Structure
4,150 USD (Mid Support): quick reaction zone, potential for short-term buy orders (scalp).
OB (4,130 USD): priority BUY Zone, confluence with 0.5 Fibo – main rebalancing area.
Support Base (4,096 USD): Break–Resistance zone, maintaining the medium-term bullish trend structure.
Target Expansion: 4,181 → 4,202 → 4,211 → 4,235 – 4,242 USD.
💎 Key Levels
🟢 Support Zones:
• 4,096 USD – main structural base.
• 4,130 USD – main OB (priority BUY).
• 4,150 USD – intraday pivot, quick reaction for scalping.
🔴 Resistance Zones:
• 4,181 USD – short-term resistance.
• 4,202 USD – intermediate balancing zone.
• 4,211 USD – expansion zone (1.272 Fibo).
• 4,235 – 4,242 USD – extended supply zone (1.618), prone to profit-taking reactions.
🎯 Market Outlook
1️⃣ Priority Scenario:
– Price lightly pulls back to the 4,150 USD area, potential for quick reaction.
– If it breaks through 4,150, the 4,130 USD (OB) zone will be the balancing point for a stronger recovery.
– Expansion targets: 4,181 → 4,211 → 4,242 USD.
2️⃣ Secondary Scenario:
– If the price breaks below 4,096 USD, the short-term bullish structure becomes invalid, shifting to a neutral state.
🧠 Analyst’s View
4,150 USD is the "stepping stone" between the OB zone and short-term resistance – where the market decides to continue or accumulate deeper.
A reasonable strategy is to monitor quick reactions at 4,150 (scalp) and prioritize clear buy opportunities at 4,130 (OB) if the price retraces deeply.
🛡️ Risk Note
The market is rebalancing within an uptrend – avoid hasty actions without clear candle or cash flow confirmation.
Analysis is technical & educational, not investment advice.

LANA_M2 XAUUSD – WAIT FOR A PULLBACK TO BUY WITH THE UPTREND ...LANA_M2 XAUUSD – WAIT FOR A PULLBACK TO BUY WITH THE UPTREND
1. Fundamental Analysis
Gold continues its bullish momentum and has just formed a two-week high as expectations for an early FOMC rate cut strengthen.
Weaker U.S. economic data, cooling bond yields, and pressure on the USD are supporting gold, both from real-yield dynamics and safe-haven demand.
With this outlook, Lana prefers waiting for a mild correction before buying with the trend, instead of chasing buys at higher prices.
2. Technical Analysis
On the H1 chart, the market structure has shifted to bullish with consecutive BOS, confirming buyer control.
FVG demand zones around 4100 and 4080 are acting as support, aligning with key swing lows after BOS.
The upper zone around 4180–4200 is an FVG supply area and a premium/ resistance zone where price may react with a short-term pullback.
With Fibonacci confluence, 4103–4105 and 4086–4088 match the 50–61.8% retracement of the latest bullish leg — ideal for waiting for a pullback to buy.
3. Key Price Zones
Support / Discount (Demand & FVG):
4103 – 4105
4086 – 4088
Resistance / Premium (Supply & FVG):
4165 – 4194 – 4202
4. Trade Setups
⭐ Primary Scenario – Buy with the Trend
Buy entry: 4103 – 4105
SL: 3998
TP: 4115 – 4130 – 4165 – 4190
⭐ Alternative Scenario – Deep Buy at Lower FVG
Buy entry: 4086 – 4088
SL: 4080
TP: 4100 – 4125 – 4146 – 4170 – 4190
⭐ Short-term Reversal – Sell at Premium Zone
Sell entry: 4194
SL: 4202
TP: 4177 – 4150 – 4132 – 4110
👉 Follow Lana on TradingView to get the earliest gold analysis updates. 💛

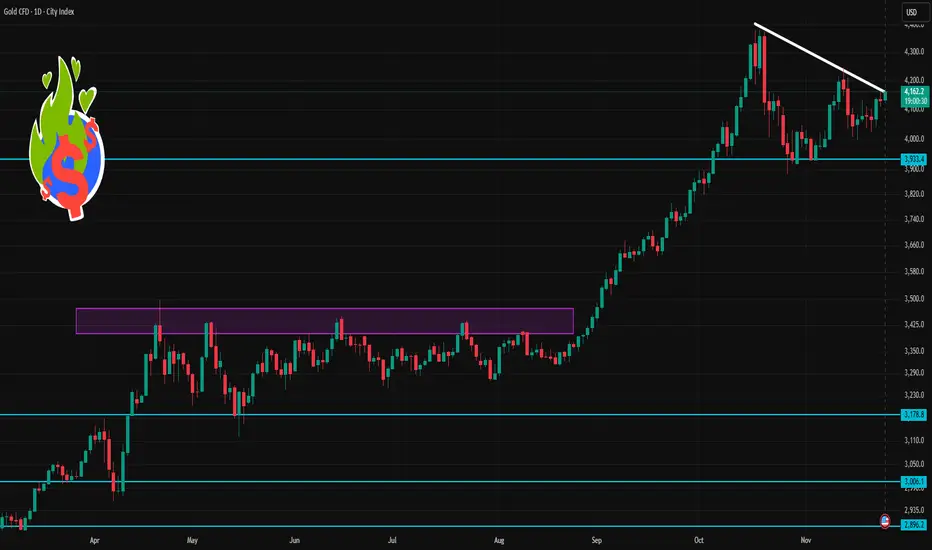
Gold 1 Day Time Frame 🔎 Current Context
1. Gold currently trades around US $4,160–4,165/oz.
2. Many technical-analysis services show daily momentum as bullish: moving averages, RSI/MACD and other indicators point toward a positive bias.
3. But macro factors (strong USD, Fed policy, global risk sentiment) remain important and may cause sharp swings.
⚠️ What to Watch Out For
Volatility: Gold remains sensitive to macro events — USD strength, rate expectations, major economic data — so price can easily break support/resistance zones.
False Breakouts: Even if price crosses a level, it may revert quickly. Combine with other indicators (volume, price action, confirmations) before acting.
Trend Shifts: A major change in global risk sentiment or central-bank moves can rapidly change trend direction, invalidating technical levels.
Elliott Wave Analysis XAUUSD – November 26, 2025
1. Momentum Analysis
D1 (Daily)
Daily momentum is deeply inside the overbought zone, meaning the probability of a bearish reversal is very high—possibly today or tomorrow. This upcoming downward phase will align with the next downward cycle of D1 momentum.
H4
H4 momentum is currently rising. Therefore, price may:
• Continue with another upward push, or
• Move sideways to push H4 momentum into the overbought zone.
H1
H1 momentum is preparing to turn downward, suggesting that a short-term bearish move on H1 may appear very soon.
________________________________________
2. Wave Structure
D1
The overall D1 structure remains unchanged from the previous plan.
The only difference is that D1 momentum has pushed deeper into the overbought region, increasing the likelihood of a reversal either today or tomorrow.
H4
Price is forming a green ABC corrective structure, and it appears price is approaching the final stage of wave C (green).
With H4 momentum turning upward, price may still produce:
• One more small push upward, or
• A mild sideways upward drift to complete wave C.
H1
On H1, price is forming a 5-wave structure (1–2–3–4–5, black). This creates two possible interpretations:
Scenario 1 (Primary Expectation)
This 5-wave pattern represents wave C (green) inside the ABC correction of wave 2 (red).
→ Since wave C is always a 5-wave structure, this scenario is fully consistent with Elliott Wave rules and remains our main working count.
Scenario 2
The 5-wave structure is actually the beginning of a new trend, potentially forming wave 1 of a larger bullish cycle.
Although there isn’t enough evidence to support this scenario yet, the mere presence of a clean 5-wave structure means we must keep this possibility in mind.
________________________________________
3. Relationship Between D1 Momentum & Wave Structure
The previous downward and upward swings inside wave Y (purple) on D1 correspond almost perfectly with the downward and upward cycles of D1 momentum.
D1 is now overbought and preparing to turn down.
➡️ Therefore, the upcoming corrective decline is extremely important.
Case 1 – Price holds above 4021
If D1 momentum reaches oversold territory and turns upward without price breaking below 4021, then:
• The current 5-wave structure may represent wave 1,
• The upcoming decline will be wave 2,
• When D1 momentum turns upward → wave 2 finishes.
Case 2 – Price breaks below 4020
If D1 momentum reverses upward from oversold but price breaks below 4020:
• The current 5-wave structure is wave C (green),
• Price will extend downward to complete wave Y,
• Wave Y completes when D1 momentum turns upward again.
🎯 In both scenarios, the next key move is still a downward leg.
________________________________________
4. Wave C Target Levels
Yesterday, two targets were provided:
• 4158
• 4184 – 4193
Price already hit 4158, then reversed strongly, producing 300 pips profit.
We now expect the remaining target 4184 – 4193 to act as the primary sell zone.
________________________________________
5. Trading Plan
📍 Sell Zone: 4184 – 4185
• SL: 4205
• TP1: 4123
• TP2: 4081
• TP3: 4020

WHICH SIDE TO CHOOSE TODAY — BUY OR SELL?1. Quick Market Context
PPI, Core PPI, and Retail Sales came in weak → low inflation → Fed may cut rates in December.
Price has broken out of the H4 accumulation zone → BUY bias for today.
Tonight we have Unemployment Claims → if the data is higher → XAU tends to continue rising.
✅ MAIN STRATEGY – BUY ON DIP
📌 All setups follow SL 100 pips – TP 100 pips
🎯 BUY ZONE 1 (Primary Entry)
4130 – 4136
→ Open BUY.
→ Retest zone after breakout.
→ SL: 10 pips | TP: 10 pips
🎯 BUY ZONE 2 (Major Support Zone)
4108 – 4113
→ Strong BUY zone.
→ If broken → deeper correction possible.
→ SL: 10 pips | TP: 10 pips
🔵 POTENTIAL BUY ZONES (SWING ENTRIES)
Use for bottom-picking with flexible RR (1:1, 1:2, 1:3, 1:4...)
4100 – 4102
4092 – 4094
4088
4060 – 4066
→ For swing setups: SL/TP depends on larger RR (not fixed 10 pips).
❌ SECONDARY STRATEGY – SELL REACTION (COUNTERTREND / QUICK SCALP)
📌 SELL setups also follow SL 10 pips – TP 10 pips.
🎯 SELL ZONE 1 (Strongest Reaction Area)
4192 – 4195
→ Short SELL for quick reaction.
→ SL: 10 pips | TP: 10 pips
🎯 SELL ZONE 2
4200 – 4202
→ Psychological resistance → SELL scalp.
→ SL: 10 pips | TP: 10 pips
🎯 SELL ZONE (Fibo Extension)
4180 – 4187
→ Short-term SELL for a small pullback.
→ SL: 10 pips | TP: 10 pips
🔶 BI / INVALIDATION ZONES
If price breaks these levels → short-term trend shifts:
Break below 4108 → BUY invalid → potential drop to 4100 / 4092.
Break above 4202 → SELL invalid → upside extension toward 4215 – 4220.
⚠️ Risk Management
Manage your capital strictly, observe market reactions, and adjust accordingly.
This plan is for reference only, not financial advice.
Trade responsibly.
Have a good day, guys!

Gold Analysis and Trading Strategy | November 25–26✅ From the 4-hour chart, gold is still in a post-rebound consolidation range. After quickly rebounding from the 4022 level, the price is currently running above the MA5 and MA10. Short-term bulls still have momentum, but the upside pressure remains strong. The price is fluctuating above the Bollinger middle band, and the bands are slightly narrowing, indicating the market is entering a range-bound consolidation phase.
✅ From the 1-hour structure, the market is in a bullish upward-shifting structure, with higher lows and higher highs. Although MA5 and MA10 show slight convergence, the price has moved back above the short-term moving averages, indicating that the bullish momentum is still dominant.
🔴 Resistance Levels: 4156–4160 / 4170–4180
🟢 Support Levels: 4110–4120 / 4070–4080
✅ Trading Strategy Reference
🔰 Focus on Shorting on Rebounds
📍 Sell lightly around 4156–4160
🎯 Targets: 4135 / 4120
⛔ Stop-loss: Above 4170
This zone is a strong H4 resistance area that has been tested multiple times without breaking, making it a priority area for short entries.
🔰 Buy on Pullbacks
📍 Consider long positions around 4126–4130
🎯 Targets: 4155 / 4160 /4170
⛔ Stop-loss: Below 4115
The H1 moving-average system provides clear support. As long as 4115 holds, the bullish trend can continue.
🔥Trading Reminder: Trading strategies are time-sensitive, and market conditions can change rapidly. Please adjust your trading plan based on real-time market conditions.
Gold H1 – Pre-NFP Liquidity Hunt as US–China Tone Warms🟡 XAUUSD – Intraday Smart Money Plan | by Ryan_TitanTrader (25/11)
📈 Market Context
Gold is approaching a key premium zone while markets react to fresh geopolitical headlines. Earlier today, Donald Trump confirmed he had a “very good call” with President Xi of China, highlighting strong bilateral relations and continued cooperation.
This matters for gold because:
• Warmer US–China relations often reduce geopolitical risk premiums, pressuring gold.
• The timing is critical: markets are entering NFP week, a period where institutions frequently engineer liquidity grabs.
• Traders may see a USD-supportive environment ahead of NFP, especially if risk sentiment stabilizes.
In short, gold is sitting in a zone where liquidity sweeps are highly probable before a larger move develops.
🔎 Technical Analysis (1H – SMC Structure)
• Market Structure
Price is climbing toward a major liquidity cluster around 4170–4172, aligning with previous equal highs and an unmitigated supply block.
Below, the FVG demand zone at 4102–4100 serves as today’s discount reaction zone.
• Premium Sell Zone (1H Supply)
4170 – 4172
• Buy-side liquidity sits above prior highs
• Clear premium zone relative to current swing structure
• Likely target for engineered sweep ahead of NFP volatility
• Discount Buy Zone (1H Demand)
4102 – 4100
• FVG imbalance + BOS origin
• Confluence with discount retracement levels
• Strong RR for bullish reaction after sell-side sweep
• Liquidity Map
• Buy-side: 4172 → 4180
• Sell-side: 4100 → 4092
Expect the classic SMC sequence:
Sweep → CHoCH → Displacement → Retest → Expansion.
🔴 Sell Setup – Premium Reaction
Entry: 4170 – 4172
Stop-Loss: 4180
Take-Profit:
→ 4138 (imbalance fill)
→ 4115 (mid-range liquidity)
→ 4102–4100 (discount zone retest)
📌 Must wait for liquidity sweep + bearish CHoCH on M5–M15.
🟢 Buy Setup – Discount Reaction
Entry: 4102 – 4100
Stop-Loss: 4092
Take-Profit:
→ 4135 (intraday reaction)
→ 4160 (premium edge)
→ 4170 (buy-side liquidity sweep)
📌 Valid only after sell-side liquidity is taken.
⚠️ Risk Management Notes
• Expect extra volatility as markets price in US–China optimism ahead of NFP.
• Liquidity traps are common during Asian/London sessions—wait for confirmation.
• Avoid taking positions inside the chop zone 4125–4150 without structure shifts.
• Treat both scenarios as liquidity plays, not trend continuation trades.
📝 Summary
Gold is approaching a major liquidity pocket as geopolitical sentiment improves following Trump’s positive call with President Xi.
With NFP approaching, institutions are likely to sweep liquidity above 4170 or below 4100 before establishing direction.
Key Levels Today
🔴 Sell Zone: 4170–4172
🟢 Buy Zone: 4102–4100
Prepare for the typical pre-NFP pattern:
Accumulation → Sweep → Displacement → Retest → Target.
📍 Follow @Ryan_TitanTrader for daily Smart Money updates.
