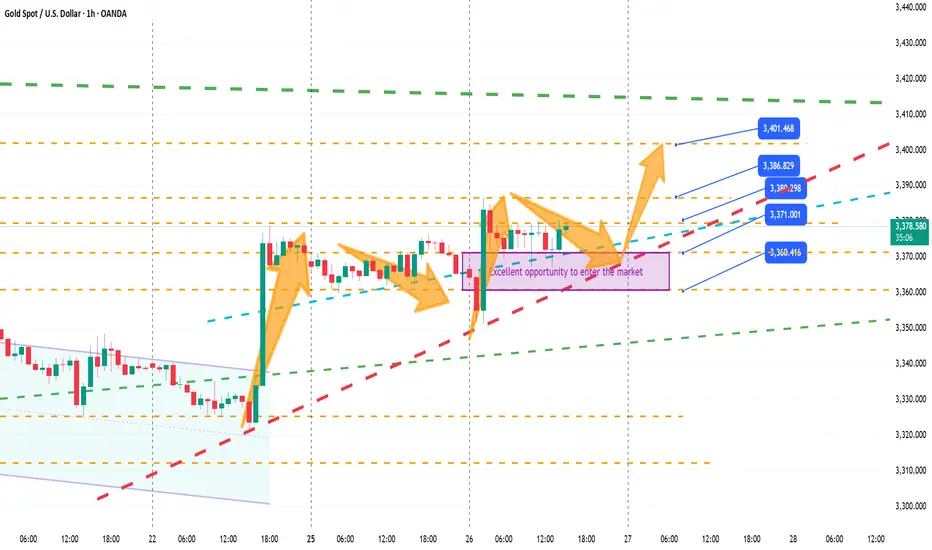
Gold’s Relentless Rally – A Lesson for Every TraderIn the past week, Gold surged strongly without any meaningful pullback, leaving many traders who were holding sell positions trapped. Without a retracement based on technical analysis, countless accounts went into heavy drawdown – some even facing complete wipeouts.
👉 What happened here?
Markets don’t always follow textbook technicals.
In volatile phases, traders often let losing trades run, ignoring their Stop-Loss.
This “hope mindset” is exactly what destroys capital faster than anything else.
💡 The key lesson for us all:
Risk management is not optional – it’s the foundation of survival in trading. A single trade without an SL may not seem dangerous, but over time, it’s the biggest reason traders lose their hard-earned money.
The market will always be unpredictable. But these are the moments where discipline and patience separate serious traders from those who get punished by the market.
🔑 MMFlow Insight for Indian Traders:
Markets don’t owe us profits. They reward only those who respect risk, stay calm, and stick to their trading rules. Protect your capital first – opportunities will always come.
👉 Stay disciplined. Respect your stop. Trade smart, trade safe.
GOLD.F trade ideas
XAU/USD – Short-Term Structure & Key ZonesXAU/USD – Short-Term Structure & Key Zones
✨ Technical Outlook
✅ Breakout Confirmed: Price broke out of the downward channel and retested 3370 as new support.
📈 Momentum: Higher lows forming → buyers in control.
🎯 Upside target: 3425–3450 (major resistance zone).
⚠️ Risk: Failure at 3450 may trigger retracement back toward 3370 / 3320.
🌍 Fundamental Drivers
💵 USD Weakness: Market pricing in softer Fed stance → supports Gold.
🏦 Yields Stable: Lower real yields = bullish for non-yielding assets like Gold.
📉 Global Risk Factors: Central bank accumulation & geopolitical uncertainty continue to add safe-haven demand.
📌 Trading Plan (Pro View)
As long as price holds above 3370, bias remains bullish.
Watch for rejection signals near 3450 → potential short setup.

Captain Vincent | Gold holds 3400, breakout or pullback next?” FED turns dovish, Gold challenges a new Storm Breaker
1. News Wave 🌍
FED – Waller: “Tariffs are a kind of tax and do not increase inflation. I’m back with the ‘transitory team’ on inflation.”
👉 A clear dovish hint supporting a 25bps rate cut in September, with potential for 1–2 more cuts in the next 3–6 months.
US Senate: Hearing scheduled on Sept 4th for FED nominee S. Miran → Political–monetary spotlight.
Tonight: Market awaits PCE data, FED’s preferred inflation measure.
➡️ Summary: FED leaning dovish = mid-term bullish for Gold.
But short-term, Gold faces profit-taking pressure near resistance.
2. Technical Outlook ⚙️
On H1, Gold has repeatedly formed bullish BOS and crossed above 3,400.
Golden Harbor 🏝️ (Buy Zone 3375 – 3373): Large volume accumulation, aligned with FVG → Attractive entry if price pulls back.
Storm Breaker 🌊 (Sell Zone 3432 – 343x): At old ATH zone, high probability of supply pressure if tested.
Key Levels:
3,375 → Critical support “anchor”.
3,438 → Resistance target if bullish momentum continues.
3. Captain Vincent’s Map – Trade Scenarios 🪙
🔺 Golden Harbor 🏝️ (BUY Zone – Priority)
Entry: 3375 – 3373
SL: 3365
TP: 3378 → 3381 → 3384 → 3387 → 33xx
🔻 Storm Breaker 🌊 (SELL Zone – Old ATH Reaction)
Entry: 3432 – 343x
SL: 3442
TP: 3428 → 3425 → 3423 → 3420 → 33xx
4. Captain’s Note ⚓
"The Gold ship has sailed past 3400, but Storm Breaker 🌊 at 343x remains a tough challenge. If corrective waves appear, patiently wait at Golden Harbor 🏝️ to board for a more bullish September journey."

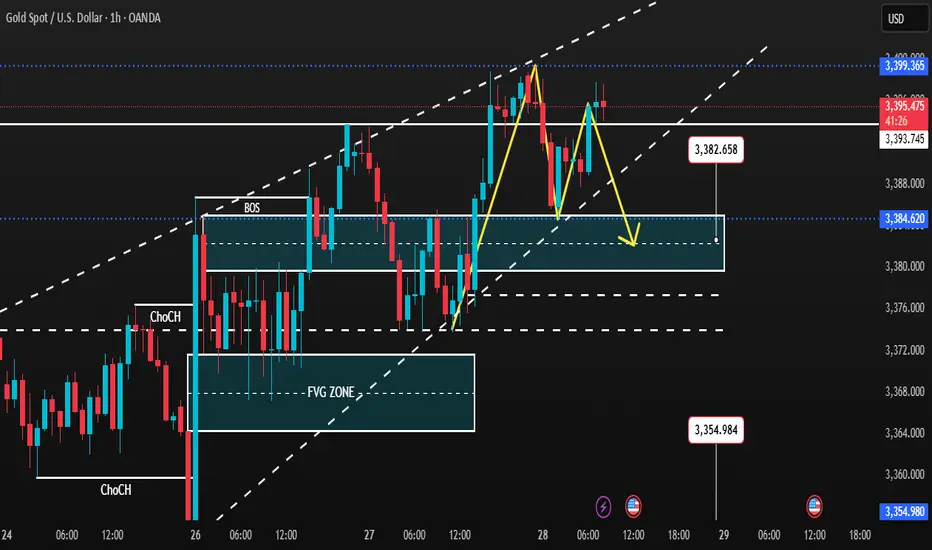
Divergence has appeared at H4 – TOP IS ABOUT TO BE FORMEDGold SMC Daily Plan – 28/08
Market Context (SMC view):
Gold is trading near 3395–3396 after a sharp bullish rally. Early bearish divergence is visible on H4, hinting at a short-term top.
Key resistance is at 3400 – a clean breakout above may trigger liquidity sweep towards 342x–343x, retesting the old ATH.
On the downside, if 3370 support breaks, price may correct deeper into 335x BUY zone for a strong bullish setup.
Key Levels:
Resistance: 3396–3400 (Sell Zone), 342x–343x (Liquidity sweep area)
Support: 3370, 3354–3352 (Buy Zone), 3325 (SL for longs)
SMC Zones & Liquidity Pools:
BUY ZONE 1: 3354–3352 (below liquidity sweep under 3370)
SL: 3347
TP: 3365 → 3375 → 3385 → 3395 → 3400+
BUY ZONE 2: 3380–3382
SL: 3374
TP: 3390 → 3400 → 3415 → 3430 → 3450+
SELL ZONE: 3408–3410 (above recent high)
SL: 3416
TP: 3390 → 3380 → 3375 → 3360
Trading Plan & Scenarios:
Sell Setup (Primary Bias – Divergence Play):
Look for liquidity grab above 3396–3399 (into resistance).
Enter short with SL above 3403.
Partial profits at 3390–3380–3375; keep runner towards 3360 if support breaks.
Buy Setup (Counter Play – Break & Retest):
If price dips into 3354–3352 BUY zone, wait for bullish confirmation (choch/BOS on lower TF).
Enter long with SL below 3347.
Targets: 3365 → 3375 → 3385 → 3395 → 3400+
Confluences:
H4 bearish divergence signalling possible exhaustion at top.
Liquidity pools above 3396 and below 3370 remain untapped.
FVG and imbalance align with 335x buy zone.
Xau USD 15 min Bullish Chart Xau USD is bullish on 15 min Chart entry given on 3395 now 3407 is running, a small hurdle near 3310 -11 if crossed then good move possible. My views are for educational purposes only. No buy sell Reccomendation. Consult your financial advisor before making any position in stock market / Crypto/ Forex market .

Gold Analysis and Trading Strategy | August 28✅ Fundamental Analysis
🔹 Political Risk: Trump’s attempt to dismiss Federal Reserve Governor Cook has raised concerns about the Fed’s independence.
🔹 U.S. Dollar Performance: The U.S. Dollar Index closed slightly lower on Wednesday, now trading around 98.19. The relative weakness of the dollar is providing some support for gold prices.
🔹 Economic Data: Multiple U.S. economic data releases are scheduled for today, which may bring volatility to the market.
🔹 Trade Relations: The EU plans to propose a tariff reduction on U.S. goods to ease trade tensions. The easing of geopolitical risks may slightly weaken gold’s safe-haven demand.
✅ Technical Analysis
🔸 On the daily chart, gold has rebounded from recent lows with consecutive bullish candles. It is currently trading between the middle and upper Bollinger Bands, near the 3395–3400 zone.
🔸 On the 4-hour chart, gold has repeatedly tested the 3395–3400 resistance area but remains in high-level consolidation. Prices are trading above the MA20 and MA60, with a bullish crossover providing support. Gold is consolidating above the Bollinger mid-band, with the upper band capping gains near 3405. The trend remains biased to the upside, but the 3400–3405 zone is a critical resistance that needs confirmation.
🔸 On the 1-hour chart, gold found support around 3375 and rebounded, reaching as high as 3399 before pulling back. This shows short-term bullish momentum is weakening, with signs of pressure at higher levels. Key focus is on the 3380–3375 support zone — a break below this level could trigger a further drop toward 3360.
🔴 Resistance Levels: 3400–3405 / 3409–3415 / 3425
🟢 Support Levels: 3383–3380 / 3373–3370 / 3360
✅ Trading Strategy Reference:
🔻 Short Position Strategy:
🔰Consider entering short positions in batches if gold rebounds to the 3395-3399 area. Target: 3375-3365;If support breaks, the move may extend to 3355.
🔺 Long Position Strategy:
🔰Consider entering long positions in batches if gold pulls back to the 3355-3360 area. Target: 3370-3380;If resistance breaks, the move may extend to 3390.
🔥Trading Reminder: Trading strategies are time-sensitive, and market conditions can change rapidly. Please adjust your trading plan based on real-time market conditions. If you have any questions or need one-on-one guidance, feel free to contact me🤝
XAU/USD – Big Move Loading? Liquidity Grab Before the Next RallyGold has been holding strong at higher levels, consolidating near resistance without showing a real liquidity sweep yet. With key US data coming in (Prelim GDP q/q & Unemployment Claims), the market could be setting up for a sharp correction first – before the next bullish leg in September, especially as USD weakens and Fed rate cuts get closer.
🔑 Key Levels to Watch
Resistance: 3400 → A breakout can quickly push Gold to 342x – 343x, retesting old ATH.
Support: 3370 → A breakdown can send price into the 335x BUY Zone for a clean long setup.
📌 MMFLOW Trading Plan
✅ BUY ZONE
3356 – 3354
SL: 3349
TP: 3360 → 3365 → 3370 → 3375 → 3380 → 3390 → 3400+
❌ SELL ZONE
3424 – 3426
SL: 3430
TP: 3420 → 3395 → 3390 → 3385 → 3380 → 3370
🎯 MMFLOW View
End of month often comes with liquidity flushes before the market decides its next big move. Watch for a potential drop into 335x as a golden buying opportunity before Gold makes a run at new highs.
👉 Trade with discipline. Stick to Key Levels. No FOMO.
🔥 What do you think traders?
Will Gold break 3400 first or flush to 335x for the perfect buy?
👇 Drop your views in the comments – let’s analyze together!

Gold (XAU/USD) Targets $3,397 – $3,406 Amid Bullish MomentumAnalysis:
The 4H chart of Gold (XAU/USD) shows strong bullish momentum after a corrective phase. Price has broken above consolidation and is currently trading around $3,382, with upside targets at $3,397 and $3,406 (highlighted resistance zone).
The supply zone on the higher timeframe remains intact below $3,280, acting as a long-term support.
Immediate support levels lie at $3,371, $3,356, and $3,348. A break below these could shift momentum bearish.
Current bullish structure suggests that as long as price holds above $3,371, buyers may drive the price higher toward the resistance levels.
A rejection from $3,406 may lead to a pullback toward the mid-support zone before another attempt higher.

GOLD 15 Chart Buy Stop🛎 Trade Suggestion
✅ XAUUSD 15M Chart BUY STOP
(watch for bullish engulfing or rejection wick on 5M/15M.)
Entry: 3396.50
Targets: 3399 / 3402 / 3405
Stop: 3389.50 (Risk 1-2%)
Reasoning: Break above premium PD array + bullish MSS + upside liquidity above 3400
⚠️ Risk Disclosure applies

Gold expected reaction from 1 H fvggold expected to react from 1 H fvg and then aim for liquidity created previous days
XAU/USDThis XAU/USD setup is a buy trade, showing a bullish short-term outlook for gold. The entry price is 3388, the stop-loss is 3384, and the exit price is 3396. The trade looks to capture an 8-point gain while risking only 4 points, offering a solid 1:2 risk-to-reward ratio.
Buying at 3388 indicates the trader anticipates upward momentum, possibly supported by dollar weakness, declining bond yields, or increased demand for gold as a safe-haven asset. The entry zone may also represent a minor support level where buyers are expected to step in, pushing prices higher.
The exit price at 3396 is positioned just below a potential resistance area, allowing profits to be booked before any selling pressure develops. Meanwhile, the tight stop-loss at 3384 ensures losses are limited if the market turns against the trade.
This setup is well-suited for intraday strategies, emphasizing disciplined execution and risk management while targeting consistent, short-term gains.

XAU/USD – Bulls Eye $3,400 as Technicals and Ichimoku Support HoHello friends, on the H1 chart, gold has rebounded sharply from the $3,360 support and is now testing the $3,380–$3,385 resistance zone. The FVG areas at $3,375 and $3,380 are creating short-term barriers, but a clean break above them could reinforce the uptrend.
The Ichimoku cloud remains supportive, with Senkou Span A staying above Span B, confirming that buyers still hold control. Trading volumes also remain healthy, indicating strong buying interest. As long as the price stays above $3,360–$3,375, this zone should act as a solid base for further gains.
From the news side, traders await the US PCE index, a key inflation gauge. A stronger-than-expected reading could weigh on the dollar and boost gold further. Meanwhile, ongoing geopolitical tensions continue to fuel safe-haven demand.
If gold breaks $3,385, the next target is $3,400, and possibly higher levels. On the flip side, any pullbacks to $3,375–$3,360 would likely be healthy corrections to strengthen the bullish structure.
Do you believe gold is ready to break $3,385 and head toward $3,400?

XAUUSD Price Action Analysis Current Market Overview
Price is trading at 3,371.67 🟢, showing bullish momentum after bouncing from the highlighted support zone (purple box).
The support zone (3,358 – 3,348) is currently holding strongly, converting old resistance into support 🔄.
🔑 Key Levels to Watch
Support Zone (3,358 – 3,348) 🛡️ → Price respected this area, confirming it as a demand zone.
Immediate Support: 3,358.65 🟪
Secondary Supports: 3,348.60 📉 | 3,325.99 📉 | 3,311.63 📉
📈 Bullish Scenario
If buyers maintain momentum above 3,358, price may attempt a move toward 3,380+ 🚀.
Break above 3,380 could signal continuation to new highs 📊✨.
📉 Bearish Scenario
A strong break back below 3,358 could re-test 3,348 → 3,325 → 3,311 ⬇️.
Failure to hold support may trigger deeper correction.
✅ Professional Takeaway
Market sentiment is bullish as long as price stays above 3,358 support zone 🟩.
Traders may look for buy opportunities on dips near support with targets toward 3,380 – 3,390 🎯.
Watch price reaction closely at the purple zone for confirmation before entering.

XAU/USD Trading Plan – Gold Eyes 3400! 🚀Gold continues to hold its bullish momentum as the USD weakens, and buyers are stepping in with strong FOMO-driven demand. However, a short-term correction (1–2 days) is still possible before the next big leg higher.
The smart play? ⚡ Wait for clean pullbacks into strong liquidity zones — buy low, hold, and ride the trend.
📊 Short-Term View (M15–H1)
Break below 337x could push Gold quickly down to 335x–334x to fill liquidity gaps.
Bigger picture remains bullish with a potential run to 3400 and beyond.
🔑 Key Levels
Support: 3363 – 3356 – 3349 – 3335
Resistance: 3385 – 3391 – 3402 – 3425
🎯 Trading Plan
✅ Buy Setups
Scalp Buy: 3356 – 3354
SL: 3350
Targets: 3360 → 3365 → 3370 → 3375 → 3380 → 3390 → 3400+
Swing Buy Zone: 3336 – 3334
SL: 3330
Targets: 3340 → 3350 → 3360 → 3380 → 3400+
❌ Sell Setups
Scalp Sell: 3385 – 3387
SL: 3390
Targets: 3380 → 3375 → 3370 → 3365 → 3350
High-Risk Sell Zone: 3401 – 3403
SL: 3407
Targets: 3396 → 3390 → 3380 → 3370
📌 Takeaway
Gold is still bullish overall, but short-term dips are healthy and provide the best entry points. Stay patient, wait for price action to confirm at key support, and let the market pay you.

Gold (XAUUSD) 4H AnalysisPrice tapped into the supply zone and showed rejection.
If sellers hold this level, we can expect a sharp drop toward the previous demand area.
Watching for confirmation before execution.
I will update here exact entry and exit if Price gives me my setup

xau chart analysis Gold is consolidating within a symmetrical triangle, suggesting a breakout is imminent. If it fails to break above resistance, a bearish move toward $3,310 or even $3,260 could follow

xau/usdThis XAU/USD setup is a sell trade, reflecting a short-term bearish outlook on gold prices. The entry price is 3367, the stop-loss is 3372, and the exit price is 3356. This trade aims for an 11-point profit while risking 5 points, providing a favorable risk-to-reward ratio of better than 2:1.
Selling at 3367 suggests the trader expects downward momentum, possibly triggered by strength in the U.S. dollar, firmer Treasury yields, or reduced safe-haven demand. The level may also align with a resistance zone, where selling pressure is likely to build, signaling an opportunity to enter a short position.
The target at 3356 is strategically set near a support zone to secure profits before potential buyers step back in. On the other hand, the stop-loss at 3372 ensures losses remain limited if gold unexpectedly pushes higher.
This setup favors intraday traders seeking disciplined execution with controlled risk and strong reward potential.

Gold about To Fly! ATH soon!Gold has been In Consolidation for past 5 Months.
4 occasions when it had settled near 3300.
It's about time for Gold to take Shorts For Cleaners?
This time around it's about to Settle near 3400.
3420 3440 will be Crucial for Bears to Defend if they wish to hold grip over this Consolidation.
Longs will get aggressive above 3440 3450 Targeting 3550 3750
😲
A prolonged consolidation could continue in case 3420 shows Profit Booking
For time Being 3375 3350 looks like providing support.
If it continues to Hold then it may build the Bull Case

Gold Trading Strategy for 27th August 2025📊 Gold Trading Setup
🟢 Buy Setup
Entry: Buy above the high of the 1-hour candle that closes above 3405
Targets: 🎯 3415 → 3425 → 3435
Stop Loss (SL): Place SL below the low of the breakout candle
🔴 Sell Setup
Entry: Sell below the low of the 1-hour candle that closes below 3378
Targets: 🎯 3368 → 3358 → 3348
Stop Loss (SL): Place SL above the high of the breakdown candle
⚠️ Disclaimer:
This is for educational and informational purposes only. 📚
Trading in commodities, forex, or stocks involves significant risk. 📉📈
Please do your own analysis before entering trades. 💡
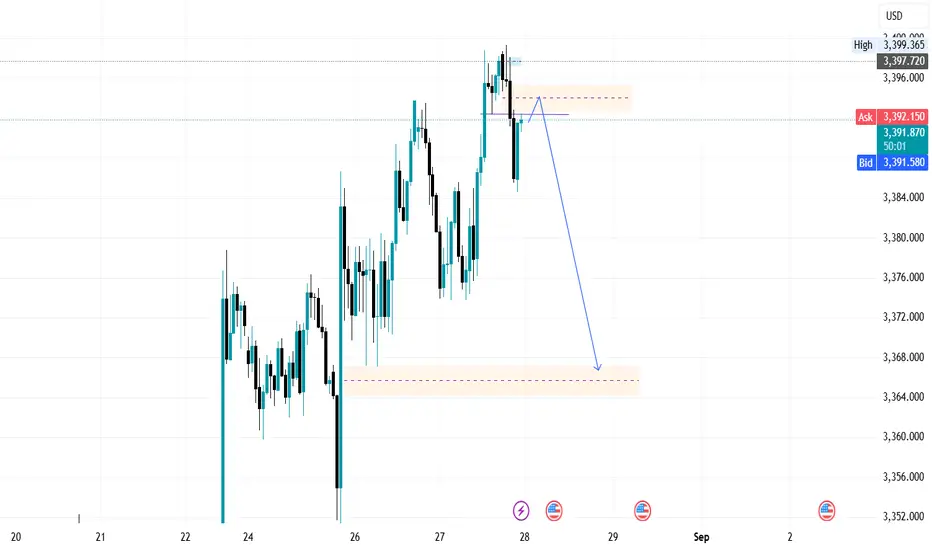
"Gold Setup: Buying Zone Rejection or Breakout Ahead?""Gold Setup: Buying Zone Rejection or Breakout Ahead?"
Gold is currently trading inside a buying zone (3380 – 3400) but facing rejection. Market structure is still holding higher lows, which keeps the bigger trend bullish, but short-term price action suggests a possible retracement move.
Resistance Zone: 3420 – 3440 (strong supply, previous rejection)
Key Support: 3330 – 3320 (major demand, higher low base)
Immediate Target: 3340 – 3360 (if rejection continues)
📉 Short-term bias: bearish correction toward 3340 – 3360
📈 Swing bias: bullish as long as 3330 – 3320 holds
🔑 My View:
I’ll be watching how price reacts around 3330 – 3320. Holding this level could trigger the next bullish leg toward 3420 – 3440. Losing it opens the door for deeper downside into 3280.
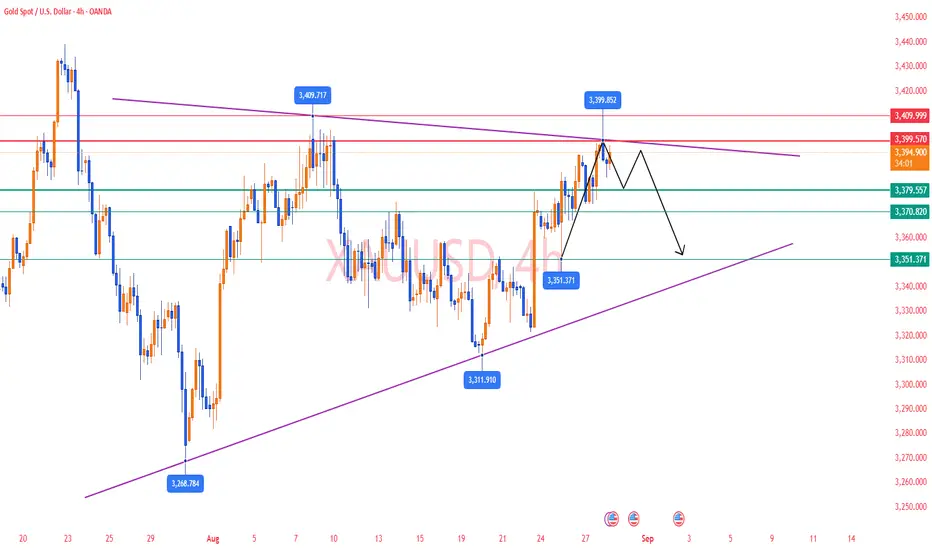
Gold Trading Strategy | August 26-27✅ 4-Hour Chart: Gold has rebounded strongly from the 3312–3315 lows, reaching as high as 3389, and is now consolidating at higher levels. Overall, it continues to move within an upward channel. The MA5, MA10, and MA20 remain in a bullish alignment, with price trading steadily above them, indicating a solid bullish trend. However, short-term consolidation is needed at higher levels. As long as 3365–3358 holds, gold still has the potential to retest the 3390–3400 zone.
🔴 Resistance Levels: 3389–3390 / 3400
🟢 Support Levels: 3365–3360 / 3355
✅ Trading Strategy Reference:
🔰 If gold pulls back to the 3365–3360 area, consider building long positions in batches, with stop-loss below 3354. Targets: 3380–3386, and if momentum is strong, look for 3395–3400.
🔰 If gold first touches the 3395–3400 zone, consider light short positions, with stop-loss above 3410. Targets: 3380–3370.
🔥Trading Reminder: Trading strategies are time-sensitive, and market conditions can change rapidly. Please adjust your trading plan based on real-time market conditions. If you have any questions or need one-on-one guidance, feel free to contact me🤝

XAU/USD - H4 Downtrend Broken – Watch Key Liquidity Zones!MMFLOW Trading Plan | 26 Aug 2025 ⚡
💰 Gold looks ready for a strong move!
Gold has smashed through the H4 downtrend line, showing strong buying pressure and clear liquidity sweeps. This signals a potential bullish continuation. ⚠️ Be aware: wide support zones below may trigger quick pullbacks as liquidity gets collected.
📊 Market Snapshot (India Focus)
USD is losing strength amid political uncertainty and Fed moves
Trump’s efforts to influence lower interest rates are indirectly supporting gold
H4 downtrend line broken → buyers are in control
Short-term: expect sideways swings + liquidity tests
Watch for fast spikes – FOMO buy zones are usually targeted
⚡ Key Levels to Watch
Resistance: 3378 → 3384 → 3400
Support: 3363 → 3354 → 3340
🔥 Trading Scenarios
BUY SCALP (Short-Term Quick Trade)
Entry: 3355 – 3353
Stop Loss: 3349
Targets: 3360 → 3365 → 3370 → 3380 → 3390 → 3400+
BUY ZONE (Swing / Longer-Term Trade)
Entry: 3341 – 3339
Stop Loss: 3335
Targets: 3345 → 3350 → 3355 → 3360 → 3365 → 3370 → 3380 → 3390 → 3400+
SELL SCALP (Quick Reversal)
Entry: 3382 – 3384
Stop Loss: 3388
Targets: 3378 → 3374 → 3370 → 3365 → 3360 → 3350
SELL ZONE (High Risk / Big Moves)
Entry: 3400 – 3402
Stop Loss: 3406
Targets: 3395 → 3390 → 3385 → 3380 → 3370 → 3360
⚠️ Risk Notes
Expect rapid drops or spikes – stops can trigger fast
Sideways movement likely during sessions + retests of highs
Only trade when price action confirms key levels
🎯 Key Takeaways for Indian Traders
Gold is poised for a strong bullish continuation, but quick pullbacks will happen to collect liquidity
Use support / liquidity zones for entries and resistance zones for exits
MMFLOW = Market Rules | Key Levels = Profit

August 26 Gold AnalysisAugust 26 Gold Analysis
The gold market is volatile but firm. Following yesterday's sharp rise, gold prices retreated slightly today, but are still holding key support levels. Spot gold is currently trading around $3,370 per ounce, down slightly from yesterday's two-week high of $3,378. Market forces are intertwined, and gold prices are expected to fluctuate around key technical levels in the short term, but the medium- to long-term bullish outlook remains unchanged.
Analysis of Influencing Factors
1. Fed Policy Expectations Dominate Market Sentiment
Federal Reserve Chairman Powell delivered a clear dovish signal at the Jackson Hole symposium, opening the door to a September rate cut. Powell focused on the "strange equilibrium" in the job market, noting that the simultaneous slowdown in labor supply and demand suggests accumulating downside risks. While he continued to warn of inflationary uncertainties, he explicitly stated that "a shift in the balance of risks may require a policy response."
This statement caused the market's probability of a 25 basis point rate cut in September to surge from 75% to 90%. Expectations for the cumulative rate cuts by year-end were also revised upward. Powell's speech placed the labor market at the center of policy decisions, downplaying the impact of recent higher-than-expected inflation data.
2. Political Pressure and Concerns About the Fed's Independence
It is worth noting that Powell's dovish stance may, in part, reflect political pressure. Given that US President Trump and the Treasury Secretary, among others, have strongly urged the Fed to cut interest rates significantly, Powell faces unprecedented pressure. Trump also reiterated his threat to fire Fed Governor Timothy Cook if she does not resign, raising concerns about the Fed's independence.
This political interference in the central bank has weakened market confidence in the US dollar as a reserve currency, becoming a key driver of the decline in the US dollar index and indirectly supporting gold prices.
3. Economic Data and Market Focus
Market focus has shifted to upcoming US economic data, which will have a significant impact on gold's short-term performance:
- Today: July durable goods orders data will be released. Following a sharp 9.3% drop in June, the market expects a further 4% drop. Positive data could boost the US dollar and weigh on gold prices.
- Thursday: Revised second-quarter GDP figures will be released, with the initial estimate of annual growth at 3%. Downward revisions are bearish for the dollar and supportive for gold, while upward revisions are the opposite.
- Friday: July's core PCE price index (the Fed's most closely watched inflation indicator) will be released. This data will directly impact the strength of expectations for a rate cut. A higher-than-expected reading will cast doubt on the urgency of rate cuts and weigh on gold prices; a lower-than-expected reading will reinforce expectations of easing and drive a rebound in gold prices.
4. The US Dollar and US Treasury Yields Decline
Following Powell's speech, the US dollar index fell sharply, 0.96%, to 97.66. US Treasury yields also fell across the board, with the two-year yield plummeting 10.2 basis points to 3.69% and the 10-year yield falling to around 4.259%. A steepening yield curve reduces the cost of holding gold, enhancing its appeal.
5. Geopolitical Risks Provide Support
Geopolitical tensions continue to provide safe-haven support for gold prices:
- Trade Tensions: Trump's tariff policy continues to escalate global trade tensions. The United States has imposed an additional 25% tariff on India, bringing the total tariff rate to 50%.
- Russia-Ukraine conflict: The escalating tensions have also provided some safe-haven support.
Trading Recommendations
- Aggressive investors: Initiate long positions in batches when gold prices fall back to the $3,360-3,368 support area, with a stop-loss below $3,350 and a target of $3,385-3,400.
- Conservative investors: Wait for gold prices to effectively break through $3,400 before entering long positions, or enter medium- to long-term long positions if they fall back to $3,340-3,350.
- Risk Management: Ensure stop-loss orders are set appropriately to avoid the risks associated with volatile market fluctuations around the release of data. Maintain position management during trading and avoid trading without risk management.
Trade with caution and manage risk effectively! Wish you good luck!