GOLD WEEKPLAN: UP FIRST DOWN AFTEROANDA:XAUUSD Footprint Analysis
The Footprint chart provides a more detailed view of the order flow. Here are some key points:
Price Pullback: The recent candles show a decrease in buying pressure (green) and an increase in selling pressure (red).
Volume Footprint: The trading volume (Total) a
About Gold
Gold price is widely followed in financial markets around the world. Gold was the basis of economic capitalism for hundreds of years until the repeal of the Gold standard, which led to the expansion of a fiat currency system in which paper money doesn't have an implied backing with any physical form of monetization. AU is the code for Gold on the Periodic table of elements, and the price above is Gold quoted in US Dollars, which is the common yardstick for measuring the value of Gold across the world.

GOLD – Breakout / Swept High – Where to BUY?1. Market Overview
Gold prices are consolidating around 3655 – 3660 after showing a short-term bearish structure.
On the H1 chart, we can see clear supply and demand zones:
• Liquidity Buy Zone near 3640 (potential demand area).
• Imbalance / Supply Zone around 3670 – 3680.
The broader higher-timefr

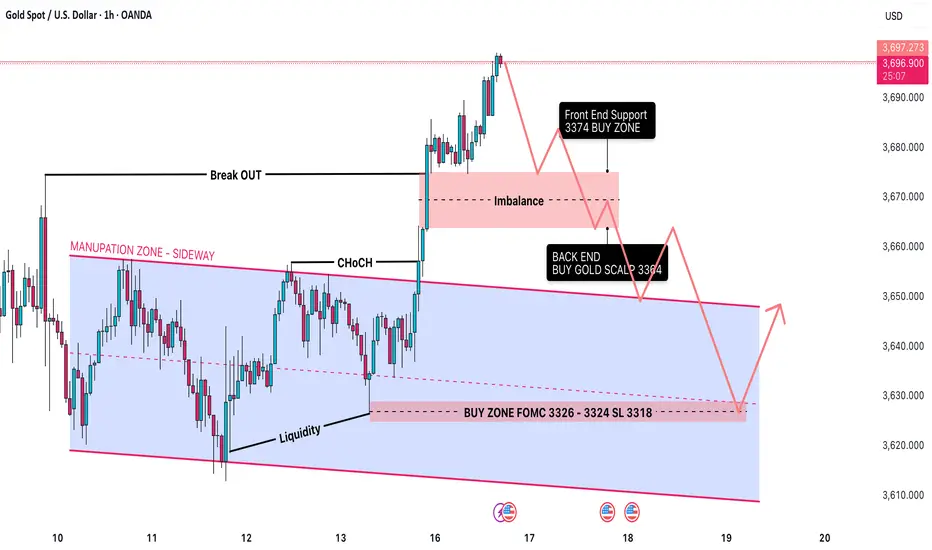
FOMC XAUUSD: Time to Hold Super SELL before FOMC🟡 XAUUSD Daily Trading Plan – Ahead of FOMC
📊 Market Context
Gold (XAUUSD) has recently moved out of its accumulation/manipulation zone and is now trading in the 3,684–3,690 range.
The market structure is bullish after a Change of Character (CHoCH) followed by a Break of Structure (BOS).
Still,
GOLD SHOWING A GOOD UP MOVE WITH 1:10 RISK REWARD GOLD SHOWING A GOOD UP MOVE WITH 1:10 RISK REWARD
DUE TO THESE REASON
A. its following a rectangle pattern that stocked the market
which preventing the market to move any one direction now it trying to break the strong resistant lable
B. after the break of this rectangle it will boost the market

Trading Analysis for Gold Spot / U.S. Dollar (15-Minute Chart)Buy XAU/USD now at 3644.00 level and hold at 3631.00 and target will be specific.
Entry Range 3642.00 to 3644.00
Take Profit 1 = 3646.00
Take Profit 2 = 3650.00
Take Profit 3 = 3654.00
Take Profit 4 = 3658.00
Stock Loss 3631.00
Key News Timings Chart Per.
i will try to update continue.

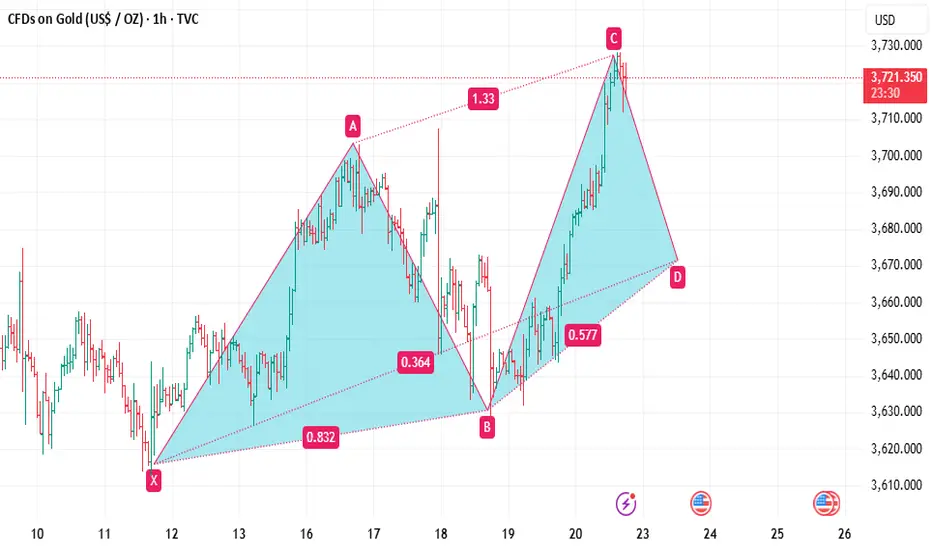
Elliott Wave Analysis XAUUSD – September 16, 2025
Momentum
• D1: Momentum is currently in an uptrend, suggesting that price may continue to rise for the next 5–6 days.
• H4: Momentum is turning downward, indicating the possibility of a correction today.
• H1: Recently showed a bullish reversal signal, but now there are signs of weakening again. Th

LONG XAUUSD📌 Trade Idea
Entry: Above 3675
Target: 3705
Potential Gain: 30 points (3705 – 3675)
Stop Loss (suggested): 3659
R:R- 1:2

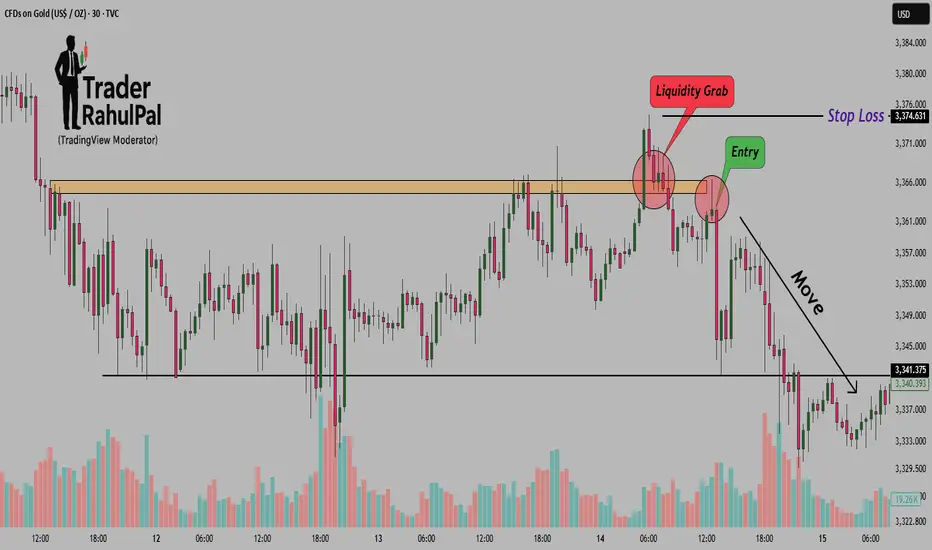
The Secret of Liquidity Grab – Why Price Hunts Highs Before FallHello Traders!
Have you ever noticed how the market first breaks a recent high, traps breakout traders, and then suddenly reverses? This is not random, it’s called a liquidity grab .
Understanding this concept can completely change how you see price action.
1. What is a Liquidity Grab?
Liquidit
BUYER FOMO: BREAK ALL THE RULES📌 GOLD – Trading Plan OANDA:XAUUSD
Follow Signals On weekend Linda published you got SELL PLAN 3720 +120PIPS
Absolutely that up first down after:
1. Market Context (H1)
Main trend: Bullish (following several upward BOS).
The price has just broken the peak and created new liquidity above th

gold spot today will down close as per chart petterngold today will close down from friday closing . as per chart pettern
See all ideas
Displays a symbol's price movements over previous years to identify recurring trends.