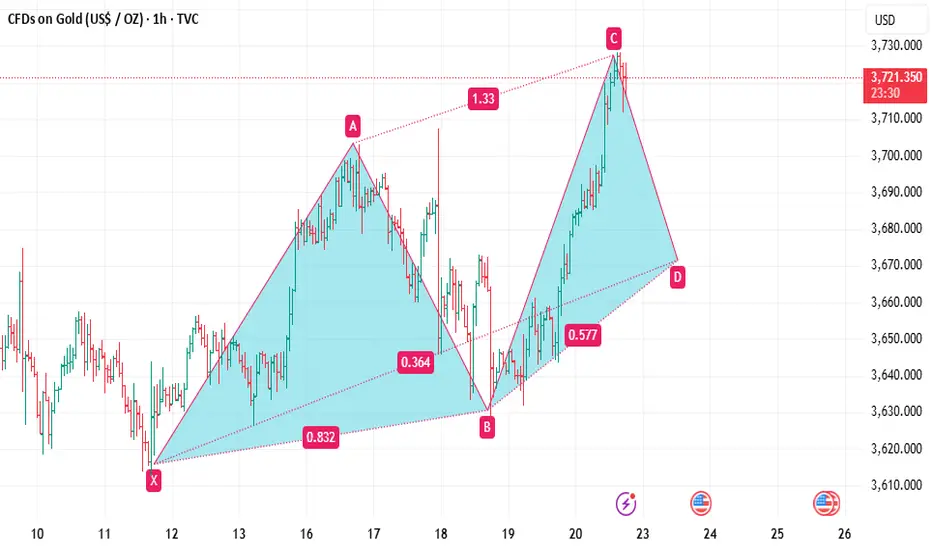
gold spot today will down close as per chart petterngold today will close down from friday closing . as per chart pettern
GOLD trade ideas
BUYER FOMO: BREAK ALL THE RULES📌 GOLD – Trading Plan OANDA:XAUUSD
Follow Signals On weekend Linda published you got SELL PLAN 3720 +120PIPS
Absolutely that up first down after:
1. Market Context (H1)
Main trend: Bullish (following several upward BOS).
The price has just broken the peak and created new liquidity above the 3715 – 3720 zone.
Below, there are CP Orders + FVG at 3693 / 3669 / 3650 → the price may retrace to test demand before continuing to rise.
Above: the 3749 – 3750 zone is a strong resistance, likely to see liquidity sweeps.
2. Main Scenario – BUY with the trend
Entry 1: CP ORDER + Trend Timing
Zone: 3693 – 3695.
Stoploss: 3685.
TP1: 3715.
TP2: 3730+.
R:R ratio: ~1:3.
Entry 2: Deeper CP ORDER
Zone: 3669 – 3670.
Stoploss: 3660.
TP1: 3710.
TP2: 3730+.
R:R: ~1:4.
Entry 3: Final FVG
Zone: 3650 – 3655.
Stoploss: 3640.
TP: 3710 – 3720.
This is the final entry; if it breaks, consider the trend reversed.
3. Alternative Scenario – SELL counter-trend (scalp)
Entry Sell
Zone: 3749 – 3750 (resistance + liquidity).
Stoploss: 3757.
TP1: 3730 – 3735.
TP2: 3695 – 3670 (if selling pressure is strong).
Confirmation required on M5/M15:
MSS down.
Bearish engulfing.
Long wick rejection.
4. Capital Management
Total risk for the day: max 3 – 4% of the account.
Each trade risk 1 – 1.5%.
Prioritize Buy, Sell is just a small scalp.
If the price hits TP1 → move SL to entry, let the rest run.
5. Notes
Main trend: Bullish, don't attempt too many counter-sells.
Only sell when clear signals appear at 3749 – 3750.
The 3693/3669 mark is a key zone → if it breaks strongly, wait for trend confirmation.

GOLD TREND TODAY - Support and Resistance - Simple Analysis📈 Trend & Market Structure
XAUUSD
Gold is still in a clear uptrend, respecting higher highs and higher lows on H4.
Recent breakout structures (BOS) confirm bullish order flow, but price is approaching a liquidity zone near $3,800.
On the downside, unmitigated Fair Value Gaps (FVG) and Order Blocks (OB) remain potential buy zones if price retraces.
🔑 Key Levels
Resistance: 3800 – 3830
Support: 3765 – 3760 – 3755
Liquidity Buy Zone: 3715 – 3712
📌 Trade Ideas
🔴 SELL Setup (Countertrend / Scalping)
Entry: 3855 – 3858
Stop Loss: 3863
Take Profit:
TP1: 3850
TP2: 3840
TP3: 3820
TP4: 3800
Open TP: 3780
🟢 BUY Setup (Trend-following / SMC zones)
Entry: 3715 – 3712 (Liquidity + Strong OB)
Stop Loss: 3705
Take Profit:
TP1: 3725
TP2: 3735
TP3: 3755
TP4: 3775
Open TP: 3800
🎯 Strategy Note
Main bias: Look for buys on retracements in line with the uptrend.
Shorts at 3855 – 3858 are countertrend scalps only; use tight stops.
Apply scalping entries once price reacts at the defined S/R levels with confirmation (candlestick rejection, BOS, or volume shift).
Always use SL/TP for risk management.
⚡ Gold remains bullish overall; the plan favors buy opportunities from demand zones, while countertrend shorts should be quick and managed tightly.

Why Gold and US Bonds Move Together!Hello Traders!
If you follow global markets, you’ll notice that Gold and US Bonds often move in the same direction.
When one rises, the other usually does too. But why does this happen? Let’s understand the link in simple words.
1. Both Are Seen as Safe Havens
In times of uncertainty, whether it’s recession fears, geopolitical tension, or market crashes, investors rush towards safety.
Gold is considered a timeless store of value.
US Bonds are backed by the US government, making them the safest fixed-income asset globally.
So, in panic situations, both attract inflows together.
2. Driven by Interest Rates & Inflation
When inflation rises or central banks cut interest rates:
Bond yields fall, but bond prices rise as investors lock in fixed returns.
At the same time, low yields make gold more attractive since the “opportunity cost” of holding it decreases.
That’s why both often rally when interest rates are falling.
3. Dollar Weakness Adds Fuel
Both gold and US bonds are influenced by the US dollar.
A weaker dollar makes gold cheaper for global buyers, pushing prices up.
Foreign investors also buy US bonds when the dollar weakens, supporting bond demand.
4. Why Traders Must Watch This Correlation
If both gold and US bonds are rising, it usually signals fear and risk-off sentiment in global markets.
If both are falling, it often reflects rising risk appetite, money moving back into equities.
This correlation can help you gauge global market mood even before equities react.
Rahul’s Tip:
Don’t just watch Nifty in isolation. Keeping an eye on gold and US bonds can give you early clues about global risk sentiment. It’s like reading the heartbeat of safe-haven flows.
Conclusion:
Gold and US bonds move together because they serve the same purpose, safety in uncertain times .
Understanding this relationship can help you read the bigger picture and prepare for market shifts more confidently.
If this post helped you connect the dots, like it, share your views in comments, and follow for more global market insights!

GOLD WEEKPLAN: UP FIRST DOWN AFTEROANDA:XAUUSD Footprint Analysis
The Footprint chart provides a more detailed view of the order flow. Here are some key points:
Price Pullback: The recent candles show a decrease in buying pressure (green) and an increase in selling pressure (red).
Volume Footprint: The trading volume (Total) and Delta (the difference between buying and selling pressure) on each candle show the order distribution.
The candle on the 19th has a negative Delta (~ -5.96 K), indicating that selling pressure is dominant, which aligns with the corrective pullback.
However, there's no major volume divergence, suggesting that this may only be a typical correction.
Detailed Footprint Analysis: The numbers within each candle show the number of buy orders (on the left) and sell orders (on the right) at each price level. When the price pulls back to the Imbalance or Strong OB zone, it's crucial to monitor the Footprint for signs of buying pressure returning (Delta turning positive or significant buying volume at key price levels), which would serve as a confirmation signal for a long entry.
OANDA:XAUUSD General Analysis
The XAUUSD market is in a strong uptrend, confirmed by the market structure:
Higher Highs (HH): Each new peak is higher than the previous one.
Higher Lows (HL): Each new trough is higher than the previous one.
Recently, the price created a Break of Structure (BOS), breaking the previous high, which indicates a continuation of the uptrend. After the BOS, the price established a new high (HH) and is now making a corrective pullback to find a strong support zone before continuing its upward momentum.
Imbalance (Fair Value Gap - FVG): This is a liquidity void created when the price moves too quickly. According to SMC theory, the market tends to return to fill this gap.
Location: The price range is from ~$3660 to ~$3670 USD.
Significance: This zone could act as a temporary support level. If the price returns to this area, it might fill the Imbalance and then continue to rise.
Strong OB (Order Block): This is a large block of orders left behind by "Smart Money" and often serves as a strong support or resistance zone.
Location: The price range is from ~$3645 to ~$3655 USD.
Significance: This is the strongest support zone to consider for a long entry. The price is likely to pull back to this area, tap into the order block, and then bounce back up to continue the trend.
Additionally, there are two important liquidity zones to note:
Buy Side Liquidity ($$$): Located above the most recent high (~$3700 USD). The price has the potential to move up to sweep this liquidity.
Sell Side Liquidity ($$$): Located below the most recent low (~$3620 USD). This zone could be swept if there is a sharp market drop, but it's highly likely that the price will respect the bullish structure and not break this low.

Part 2 Ride The Big Moves 1. Option Pricing and Valuation
Option prices are determined by two main components:
1.1 Intrinsic Value
The difference between the current price of the underlying asset and the option’s strike price.
1.2 Time Value
The remaining portion of the premium, reflecting time until expiration and volatility. Options with longer time to expiration usually have higher time value.
1.3 Factors Affecting Option Prices
Underlying Asset Price: Movement in the underlying asset directly affects the option’s value.
Strike Price: Determines whether the option is ITM, ATM, or OTM.
Time to Expiration: Longer expiration provides higher flexibility and premium.
Volatility: Higher volatility increases option premiums.
Interest Rates: Rising interest rates can increase call option values and decrease put option values.
Dividends: Expected dividends reduce the value of call options.
1.4 Option Pricing Models
Black-Scholes Model: Widely used for European options, factoring in asset price, strike price, time, volatility, and risk-free rate.
Binomial Model: Flexible and suitable for American options, where early exercise is possible.
2. Risk and Reward in Options Trading
2.1 Risk for Option Buyers
The maximum risk for buyers is limited to the premium paid. If the market moves unfavorably, the option can expire worthless, but the loss cannot exceed the initial investment.
2.2 Risk for Option Sellers (Writers)
Sellers face potentially unlimited risk:
For a call writer without owning the underlying asset (naked call), losses can be infinite if the asset price rises sharply.
For put writers, losses occur if the asset price falls significantly below the strike price.
2.3 Reward Potential
Buyers have unlimited profit potential for calls and substantial profit for puts if the market moves favorably.
Sellers earn the premium as maximum profit, regardless of market movement, assuming they manage positions correctly.
3. Hedging and Speculation Using Options
3.1 Hedging
Options are a powerful tool for risk management. For instance:
Investors holding a stock can buy put options to protect against downside risk.
Traders can use options to lock in profit targets or minimize losses.
3.2 Speculation
Speculators use options to capitalize on market movements with limited capital. Examples:
Buying calls to profit from an anticipated rise.
Buying puts to profit from an anticipated fall.
Using complex strategies to exploit volatility or time decay.
4. Options in Different Markets
4.1 Stock Options
Options on individual stocks are most popular and widely traded. They provide leverage and hedging opportunities.
4.2 Index Options
Options on market indices like Nifty or S&P 500 allow traders to speculate on broader market trends.
4.3 Commodity Options
Used in commodities markets like gold, crude oil, and agricultural products for hedging or speculation.
4.4 Currency Options
Provide protection or speculation opportunities in the forex market against currency fluctuations.

Part 2 Support and Resistance1. Who Participates in Option Markets?
There are two main participants in options trading:
Option Buyers:
Pay premium upfront.
Limited risk, unlimited profit potential (in calls).
They speculate on price movement.
Option Sellers (Writers):
Receive premium from buyers.
Limited profit (only premium collected), but potentially large risk.
Often institutions or experienced traders who use hedging.
2. Why Trade Options?
Options are not just for gambling on price. They are multipurpose:
Leverage: You control more value with less money. A small premium can give exposure to big stock moves.
Hedging: Protect your stock portfolio from market crashes.
Flexibility: You can profit whether the market goes up, down, or even stays flat.
Income: Selling options regularly earns premiums, like rental income.
3. Option Pricing (The Premium)
The premium of an option has two parts:
Intrinsic Value: The real value if exercised today.
Example: Stock price ₹1,500, Call strike ₹1,450 → Intrinsic value = ₹50.
Time Value: Extra amount based on time left until expiration and market volatility.
The longer the time, the higher the premium.
Higher volatility also increases premium because big moves are more likely.
So, Option Price = Intrinsic Value + Time Value.
4. Types of Option Trading Strategies
Options are flexible because you can combine calls, puts, buying, and selling to create different strategies. Here are some important ones:
A. Basic Strategies
Buying Calls – Bullish view. Cheap way to bet on rising prices.
Buying Puts – Bearish view. Cheap way to bet on falling prices.
Covered Call – Hold stock + sell call to earn extra income.
Protective Put – Hold stock + buy put to protect against fall.
B. Intermediate Strategies
Straddle – Buy one call and one put at the same strike. Profits from big moves in either direction.
Strangle – Similar to straddle, but with different strikes. Cheaper but needs bigger move.
Spread Strategies – Combining buying and selling options of different strikes to limit risk.
Bull Call Spread
Bear Put Spread
Iron Condor
C. Advanced Strategies
Butterfly Spread – Limited risk and reward, used when expecting no big movement.
Calendar Spread – Exploits time decay by selling short-term and buying long-term options.

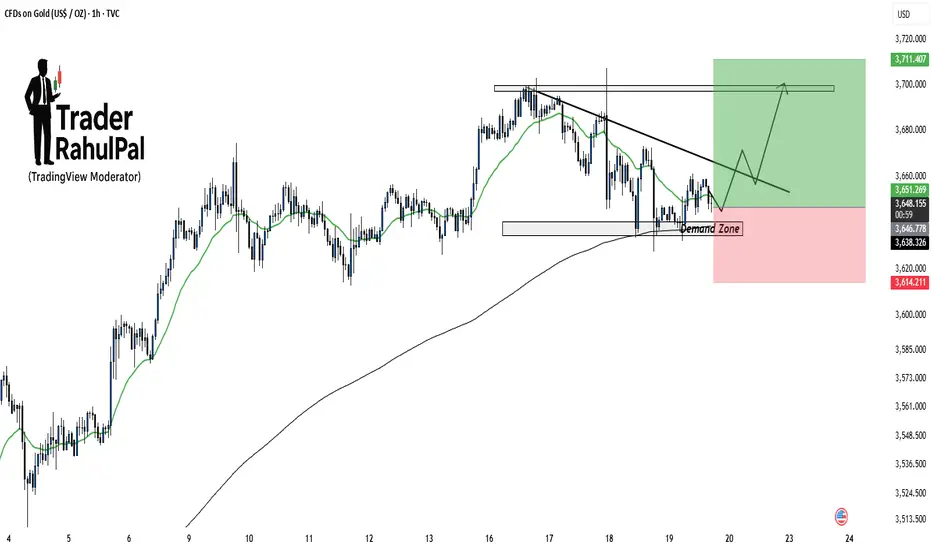
GOLD – Breakout / Swept High – Where to BUY?1. Market Overview
Gold prices are consolidating around 3655 – 3660 after showing a short-term bearish structure.
On the H1 chart, we can see clear supply and demand zones:
• Liquidity Buy Zone near 3640 (potential demand area).
• Imbalance / Supply Zone around 3670 – 3680.
The broader higher-timeframe trend is still bullish, but in the near term the market is retesting liquidity levels.
________________________________________
2. Key Levels & Zones
• Liquidity Buy Zone: 3640 – 3645 → important support.
• Sell Scalp Zone / Imbalance: 3670 – 3680 → short-term resistance.
• Higher High Target (HH): 3700 – 3710 → strong higher-timeframe resistance.
• Long-term Support: 3620 – 3630.
________________________________________
3. Main Trading Scenarios
🟢 Long Setup (with trend)
• Wait for price to revisit the Liquidity Buy Zone (3640 – 3645).
• If bullish reversal signals appear (pin bar, engulfing candle, etc.), consider entering a Long position.
🎯 Targets:
• Short-term: 3678 (trendline break retest).
• Mid-term: 3700 – 3710 (higher high).
🔴 Short Setup (scalp only)
• If price pushes into the Sell Scalp Zone (3670 – 3680) and faces strong rejection → take a Short scalp.
• 🎯 Target: 3640 – 3645.
⚠ Note: Shorts go against the main bullish trend, so they should be managed quickly and not held for long.
________________________________________
4. Trade Management Notes
• Focus on Long trades near support, as higher timeframe bias is still bullish.
• Short positions should only be taken as scalp setups near resistance.
• Risk control: limit risk to 1–2% per trade, avoid holding trades against the main trend.
________________________________________
📌 Conclusion
Gold (XAUUSD) is currently testing the descending trendline and resistance zone.
• A successful breakout may lead price towards 3700+.
• Otherwise, the market is likely to dip back into 3640 before starting the next bullish leg.

GOLD SHOWING A GOOD UP MOVE WITH 1:10 RISK REWARD GOLD SHOWING A GOOD UP MOVE WITH 1:10 RISK REWARD
DUE TO THESE REASON
A. its following a rectangle pattern that stocked the market
which preventing the market to move any one direction now it trying to break the strong resistant lable
B. after the break of this rectangle it will boost the market potential for break
C. also its resisting from a strong neckline the neckline also got weeker ald the price is ready to break in the outer region
all of these reason are indicating the same thing its ready for breakout BREAKOUT trading are follws good risk reward
please dont use more than one percentage of your capitalfollow risk reward and tradeing rules
that will help you to to become a bettertrader
thank you

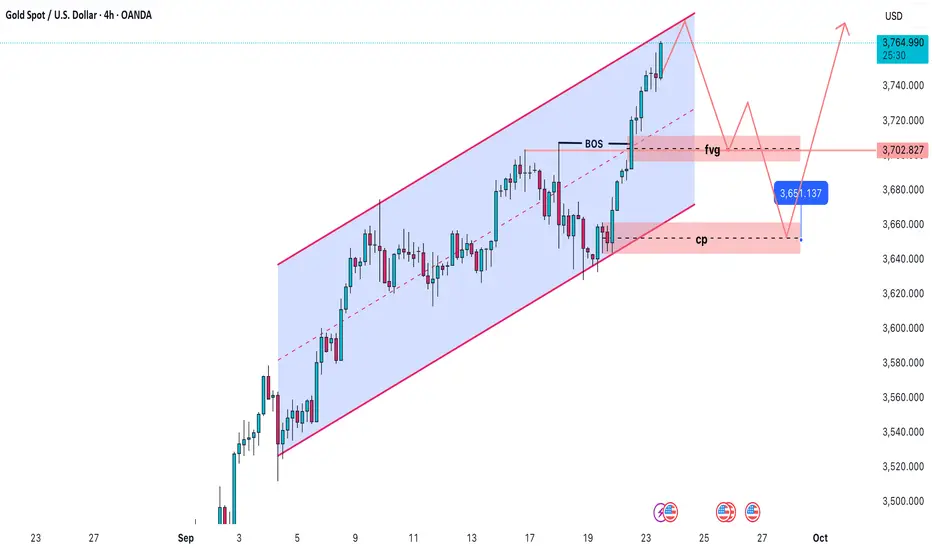
GOLD TREND 23/09 SIMPLE ANALYSIS1. Market Context
Price is currently moving within an ascending channel.
A recent BOS (Break of Structure) indicates that buyers are still in control.
There is an untested FVG (Fair Value Gap) and CP (Demand Zone) below.
2. Key Levels
Immediate resistance: around 3,758 – 3,760 USD.
FVG zone: 3,700 – 3,720 USD.
CP (strong demand): around 3,650 USD.
Mid-level of interest: 3,702.8 USD (possible retracement point).
3. Trading Scenarios
🅰️ Scenario 1 – Pullback before continuation (higher probability)
Price may touch the resistance zone at 3,758 → retrace to test the FVG (3,700 – 3,720).
If the pullback extends deeper, it could sweep into the CP zone at 3,650 before bouncing strongly upwards.
Entry: Buy around 3,700 – 3,650.
SL: Below 3,630.
TP1: 3,758 (previous high).
TP2: 3,800+.
🅱️ Scenario 2 – Strong breakout continuation
If price breaks clearly above 3,760 with high volume → possible breakout buy.
Entry: Buy above 3,765 after a retest.
SL: 3,740.
TP1: 3,800.
TP2: 3,830 – 3,850.
🅾️ Risk scenario – Reversal
If price breaks down below the channel and closes H4 candles under 3,630 → bullish structure is invalidated.
In this case, best to stay out or look for short setups towards 3,580.
4. Risk Management & Notes
Risk per trade < 1–2% of account.
Prioritise long entries from the FVG/CP zones, avoid chasing highs.
Keep an eye on USD & Gold-related news (economic calendar may cause strong volatility).
Understanding the Psychology of Trading1. The Role of Psychology in Trading
Trading is a mental battlefield. Financial markets are complex systems influenced by countless variables, from economic data and geopolitical events to investor sentiment. However, the human mind is inherently emotional, often reacting irrationally to market fluctuations.
Even the most robust trading strategies can fail if a trader cannot manage emotions such as fear, greed, overconfidence, or frustration. Psychological discipline ensures traders follow their plans consistently, avoid impulsive decisions, and maintain a long-term perspective. Studies suggest that over 80% of trading mistakes are rooted in poor psychological management rather than technical errors.
Key aspects of trading psychology include:
Emotional regulation: Maintaining composure in the face of gains and losses.
Cognitive control: Avoiding biases that cloud judgment.
Discipline: Following trading rules and strategies without deviation.
Resilience: Recovering quickly from losses and mistakes.
2. Common Emotional Traps in Trading
2.1 Fear
Fear is perhaps the most pervasive emotion in trading. Fear manifests in several ways:
Fear of losing: Traders may hesitate to enter positions, missing opportunities.
Fear of missing out (FOMO): Conversely, traders may impulsively enter trades to avoid missing profits, often at unfavorable prices.
Fear after losses: A losing streak can lead to panic and overly cautious behavior, reducing trading effectiveness.
Example: A trader sees a strong upward trend but hesitates due to fear of a sudden reversal. By the time they act, the price has already surged, causing frustration and regret. This cycle often leads to indecision and missed profits.
2.2 Greed
Greed is the desire for excessive gain, often leading to poor risk management. Traders may hold on to winning positions too long, hoping for unrealistic profits, or take excessive risks to recover previous losses.
Example: A trader makes a small profit but refuses to exit, hoping for a bigger gain. Suddenly, the market reverses, and the profit evaporates, turning into a loss.
2.3 Overconfidence
After a series of successful trades, traders may develop overconfidence, believing they are infallible. This often leads to reckless trades, ignoring risk management rules, and underestimating market volatility.
2.4 Impatience
Markets do not always move predictably. Impatience causes traders to enter or exit positions prematurely, deviating from their strategy. The result is frequent small losses that accumulate over time.
3. Cognitive Biases in Trading
Cognitive biases are systematic thinking errors that affect decision-making. Recognizing these biases is crucial for traders.
3.1 Confirmation Bias
Traders often seek information that confirms their existing beliefs while ignoring contrary evidence. This bias can lead to holding losing positions or entering trades without proper analysis.
3.2 Anchoring Bias
Anchoring occurs when traders fixate on specific price levels or past outcomes, influencing future decisions irrationally. For instance, a trader may refuse to sell a stock below their purchase price, even when fundamentals have deteriorated.
3.3 Loss Aversion
Humans are naturally more sensitive to losses than gains. In trading, loss aversion may prevent traders from cutting losses early, hoping the market will turn, which often worsens financial outcomes.
3.4 Recency Bias
Traders give undue weight to recent events, assuming trends will continue indefinitely. This bias can cause chasing performance or overreacting to short-term market moves.
4. The Importance of Discipline in Trading
Discipline is the bridge between strategy and execution. A disciplined trader follows a clear set of rules and adheres to risk management, regardless of emotional fluctuations.
4.1 Developing a Trading Plan
A trading plan is a blueprint that defines:
Entry and exit criteria
Risk-reward ratio
Position sizing
Trade management rules
Example: A trader may decide to risk only 2% of their account on a single trade and exit if losses reach that limit. Following this plan consistently prevents emotional decisions and catastrophic losses.
4.2 Sticking to Risk Management
Risk management is the cornerstone of psychological stability. Setting stop-losses, diversifying trades, and controlling leverage ensures that no single loss can devastate your account or trigger panic.
5. Emotional Control Techniques
Successful traders develop mental strategies to control emotions and maintain focus.
5.1 Mindfulness and Meditation
Mindfulness techniques improve awareness of thoughts and feelings, helping traders remain calm during volatility. Meditation has been shown to reduce stress and improve decision-making under pressure.
5.2 Journaling
Maintaining a trading journal helps identify recurring emotional patterns and mistakes. By recording each trade, the rationale behind decisions, and emotional states, traders can objectively review performance and refine their strategies.
5.3 Routine and Preparation
A structured daily routine reduces emotional fatigue. Preparation includes reviewing charts, setting alerts, and defining trading goals before market hours.
5.4 Breathing and Relaxation Techniques
Simple breathing exercises can reduce stress during high-pressure trading moments, preventing impulsive decisions.
6. Building a Resilient Trading Mindset
6.1 Accepting Losses as Part of Trading
Losses are inevitable in trading. Accepting them as a natural part of the process prevents emotional spirals and promotes learning from mistakes.
6.2 Focusing on Probabilities, Not Certainties
Markets are probabilistic. Traders must view each trade as a calculated bet, not a guaranteed outcome. Focusing on risk-reward ratios and statistical probabilities reduces emotional overreactions to individual trades.
6.3 Continuous Learning and Adaptation
Markets evolve, and so should traders. A resilient mindset embraces learning from both successes and failures, adapting strategies to changing market conditions.
7. Psychological Traits of Successful Traders
Through observation and research, several psychological traits consistently appear in successful traders:
Patience: Waiting for the right setup rather than forcing trades.
Discipline: Adhering to plans and strategies without deviation.
Emotional stability: Remaining calm under pressure.
Self-awareness: Recognizing personal biases and tendencies.
Confidence without arrogance: Trusting analysis without reckless behavior.
Adaptability: Adjusting strategies as markets evolve.
8. Avoiding Psychological Pitfalls
8.1 Overtrading
Overtrading is driven by boredom, greed, or the desire to recover losses. It usually results in higher transaction costs and emotional exhaustion. Limiting the number of trades and focusing on quality setups can mitigate this.
8.2 Revenge Trading
After a loss, some traders attempt to “win back” money through aggressive trades. This emotional reaction often leads to larger losses. Accepting losses calmly and returning to a plan is key.
8.3 Chasing the Market
Jumping into trades based on hype or short-term trends often results in poor entries and exits. Patience and adherence to trading plans prevent this behavior.
9. Developing Mental Strength Through Simulation and Practice
Simulation trading or “paper trading” allows traders to practice strategies without financial risk. This helps build psychological resilience, test reactions to losses, and develop disciplined trading habits. Reviewing simulated trades offers insights into emotional patterns and decision-making flaws.
10. Integrating Psychology Into Strategy
Successful trading requires the integration of psychological awareness into technical and fundamental strategies. Some approaches include:
Pre-trade checklist: A psychological and analytical checklist ensures readiness for trades.
Post-trade reflection: Assessing decisions objectively to identify emotional interference.
Routine review sessions: Weekly or monthly analysis of trades to refine strategy and mindset.
11. Real-World Examples of Psychological Trading
George Soros: Known for his high-risk trades, Soros emphasizes the importance of understanding one’s own psychology and the market’s reflexive behavior. His success stemmed from disciplined risk management and emotional control, even in volatile markets.
Jesse Livermore: Despite enormous successes, Livermore’s career was marked by the dangers of emotional trading, including overconfidence and revenge trading. His life highlights the balance between psychological mastery and the destructive power of unchecked emotions.
Retail Traders: Many retail traders fail due to emotional decision-making, overtrading, and lack of risk discipline. Psychological resilience differentiates consistent winners from occasional profitable traders.
12. Conclusion
Trading is as much a psychological pursuit as it is a technical or analytical one. Emotional regulation, cognitive control, discipline, and resilience are crucial for consistent success. Understanding one’s own mind, recognizing biases, and developing a disciplined, patient approach transforms trading from a high-stress gamble into a strategic, probabilistic endeavor.
Mastering the psychology of trading is an ongoing journey. It requires self-awareness, continuous learning, and practice. By integrating psychological insights into trading strategies, traders can navigate market volatility with confidence, make rational decisions, and achieve long-term profitability.
In short, the mind is the ultimate trading tool. Sharpen it, discipline it, and respect it, and the markets become not just a place of opportunity, but a mirror reflecting your mastery over fear, greed, and uncertainty.
XAU/USD H1 – Gold at Key Resistance, Potential Pullback to 0.618
💥✅🎯On the one-hour (H1) timeframe, the price of gold (XAU/USD) has reached the key resistance level of 3,766–3,770 after a strong bullish rally. This resistance zone coincides with the upper supply area marked in red, as well as the rising orange trendline channel mid-level.
Key points:
Resistance Zone: 3,766–3,770
Support Levels: 3,740 and 3,720
Fibonacci Levels: Possible correction targets at 0.618 (~3,740) and 0.786 (~3,720).
Price action is consolidating near the resistance; watch for reversal candlestick patterns for short opportunities.
If resistance breaks, next upside target is around 3,800.
If rejection occurs, expect a corrective move down to Fibonacci levels before resuming the uptrend.
Risk Management:
For long positions: Wait for a breakout above 3,770 with sustained volume.
For short positions: Place stops above 3,780 to limit exposure.
Always use appropriate position sizing.

Part 1 Support and Resistance1. Introduction: What Are Options?
In financial markets, traders and investors use different instruments to make profits or manage risks. Among these, options are one of the most powerful yet misunderstood tools. Unlike stocks, where you directly own a share in a company, or bonds, where you lend money, options are derivative contracts — meaning their value comes from an underlying asset (like a stock, index, commodity, or currency).
An option gives its buyer a right, but not an obligation, to buy or sell the underlying asset at a fixed price within a certain period. This ability to choose, without being forced, is why it’s called an option.
Options are widely used for three reasons:
Speculation – Traders use them to bet on price movements.
Hedging – Investors use them to protect against losses in their portfolios.
Income Generation – Some traders sell options to collect premium income.
Now, let’s break it down step by step.
2. Key Terms in Option Trading
Before going deeper, you need to know the language of options:
Call Option: A contract that gives the buyer the right to buy an asset at a set price within a specific time.
Put Option: A contract that gives the buyer the right to sell an asset at a set price within a specific time.
Strike Price (Exercise Price): The price at which the option buyer can buy (call) or sell (put) the underlying.
Premium: The price you pay to buy an option. This is like a ticket fee for getting the right.
Expiration Date: The date when the option expires. After this, the contract becomes worthless if not exercised.
In the Money (ITM): An option that already has value if exercised.
Out of the Money (OTM): An option that would not make money if exercised now.
At the Money (ATM): When the stock price and strike price are nearly equal.
Example: Suppose Infosys is trading at ₹1,500.
A Call option with a strike of ₹1,450 is ITM because you can buy lower than market.
A Put option with a strike of ₹1,550 is ITM because you can sell higher than market.
3. How Options Work
Think of options like an insurance policy.
When you buy a call option, it’s like booking a movie ticket in advance. You pay a small fee (premium) to reserve the seat (stock at a certain price). If the stock rises, you use your ticket. If not, you just lose the fee, not more.
When you buy a put option, it’s like buying insurance for your car. If something bad happens (stock falls), you can still sell at a higher strike price. If nothing happens, your premium is the cost of insurance.
This is the beauty of options: limited risk (only the premium), but potentially unlimited reward (especially for calls).

A bullish outlookWaves 1, 2, and 3: The chart shows a completed impulse sequence with a long and strong Wave 3, which followed a Bull Flag continuation pattern.
Wave 4 Correction: Gold is currently believed to be in a corrective Wave 4. This correction is taking the shape of an Ascending Broadening Wedge, a pattern characterized by two upward-slanting, diverging trendlines.
Support: A key support level is marked at approximately $3,324.790, which served as the base for the recent major rally.
Price Target: The red arrow indicates an expected rally towards the region between the 2.414 ($3,818.931) and 3.0 ($3,865.262) Fibonacci levels.
Gold is poised for another significant rally to new highs, potentially reaching the $3,820 - $3,865 price range.

Gold Today Intraday TradeDear Trader I,m Analysis
Gold has recently hit fresh highs around $3,700/oz, but now there’s profit-booking and resistance in that zone.
Support is seen near $3,640–$3,630/oz, which has acted as a demand zone in recent dips.
Some indicators are overbought (like RSI / Williams %R) or showing signs that upside momentum could be weakening unless price breaks certain resistance levels.
There is a possible bearish bias now if gold fails to clear resistance—to the upside, a breakout above ~$3,700+ could trigger further gains
---
📈 Key Levels to Watch
Level Type Approximate Price ($/oz)
Strong Resistance ~ $3,700–$3,707
Near Resistance ~$3,678–$3,680
Strong Support ~$3,640–$3,630
Deeper Support ~$3,600

Gold Demand Zone Holding – Upside Potential Toward 3710!Gold is currently testing a demand zone around 3640–3650 , which aligns well with moving average support. As long as this zone holds, price action favors a potential bounce toward the falling trendline and eventually the key resistance area near 3710 . Short-term buyers may look for confirmation inside the demand zone before positioning, while a breakdown below 3614 would invalidate this setup.
Disclaimer: This analysis is for educational purposes only and should not be taken as financial advice. Please do your own research or consult your financial advisor before investing.
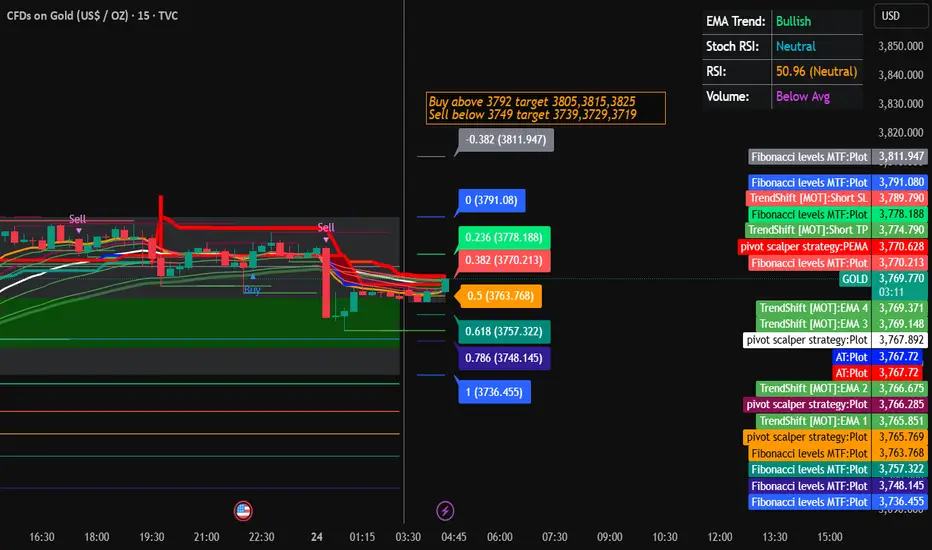
Gold Trading Strategy for 24th September 2025 (IST 0445 AM)📊 GOLD TRADING SETUP (XAU/USD)
✨ Buy Setup
🔼 Entry: Buy above the high of 1-hour candle close above 3792
🎯 Targets:
🥇 3805
🥈 3815
🥉 3825
🛡️ Stop Loss (SL): Place SL a few points below 3792 (manage according to risk appetite).
⚡ Sell Setup
🔽 Entry: Sell below the low of 15-min candle close below 3749
🎯 Targets:
🥇 3739
🥈 3729
🥉 3719
🛡️ Stop Loss (SL): Place SL a few points above 3749 (manage according to risk appetite).
📌 Key Notes
📉 Always wait for candle close confirmation before entering trade.
📈 Position sizing should match your risk tolerance.
🔍 Monitor news/events impacting gold volatility (USD data, Fed updates, geopolitical events).
⚖️ Do not over-leverage.
⚠️ Disclaimer
This analysis is for educational and informational purposes only. It is not financial advice or a buy/sell recommendation. Trading in gold and financial markets involves high risk, including possible loss of capital. Always do your own research or consult a financial advisor before making trading decisions.
XAUUSD Facing Downward PressureHello traders, XAUUSD is currently facing downward pressure following recent economic news. The lower-than-expected unemployment claims data suggests economic stability, reducing the demand for gold. The higher-than-expected PCE core index increases the likelihood that the Fed will maintain high interest rates, putting pressure on gold prices. While the US GDP remains stable , there is no strong breakthrough.
Technically, XAUUSD is in an uptrend but has encountered resistance at $3,790 . The price of gold is currently testing support at $3,700. If this level is broken, gold could fall to the $3,635 region.
Given the current fundamental and technical factors , the likelihood of XAUUSD continuing to decline is high. If support doesn't hold, gold could continue to drop.
Wishing you successful trading!

XAUUSD – Wolfe Waves continue on H4XAUUSD – Wolfe Waves continue on H4, price returns below trendline: prioritise correction scenario
Hello Trader,
Based on the Wolfe Waves structure on the H4 frame and current price behaviour, gold has returned to trading below the trendline, indicating a weakening short-term uptrend and paving the way for a downward correction before the market decides the next trend. The upper zone has created a clear “sell zone”; below, two defensive buy zones appear suitable for both scalping and medium-term.
Main Technical Picture
Wolfe Waves: wave 5 completes near resistance, then price falls back below the trendline — aligning with the correction scenario along Wolfe's target line 1–4.
Trendline & price box zone: the close below the rising trendline indicates “acceptance” below; immediate resistance lies at the 375x–376x cluster (sell zone).
Momentum: H4 MACD slows, histogram narrows → high probability of a pullback – retest before a new decision.
Detailed Trading Scenarios
1) Sell according to correction trend (priority)
Entry: 3756 – 3759
SL: 3764
TP: 3745 → 3732 → 3715 → 3690 → 3672
Reason: the 375x zone coincides with the sell zone + upper trendline; selling at retest offers a good R:R ratio.
Confirmation/Negation: if H4 closes above 3764 and holds, the short-term sell scenario weakens.
2) Buy scalping in buffer zone
Entry: 3701 – 3703
SL: 3695
TP: 3715 → 3732 → 3745 → 3766
Note: this is just a rebound in the correction phase; lock each step and move SL according to TP1.
3) Buy medium-term (strong base zone)
Entry: 3648 – 3651
SL: 3644
TP: 3672 → 3698 → 3708 → 3722 – 3727
Reason: the 365x zone coincides with the demand/accumulation volume on H4; suitable for catching a deep rebound along with the larger trend.
Management: this is a medium-term order, so divide volume, lock each step and move SL to breakeven after TP1.
Refer to my scenario if you find it reasonable, trade accordingly, and if you enjoy trading gold with high-quality scenarios, follow me.

LiamTrading – XAUUSD Trading Scenario for TodayGold continues its robust upward momentum and is now approaching the critical resistance zone around 3,697 – 3,700. This is a confluence point with the Fibonacci extension level and also a zone where sellers might re-enter strongly.
Technical Analysis
On the H1 chart, the price has tested the resistance zone multiple times but hasn't broken through decisively. This indicates that profit-taking pressure is emerging.
The sell confirmation zone will form if the price breaks below 3,685 – 3,686, at which point the correction target could be around 3,673.
The main Buy Zone is located at 3,650 – 3,645, coinciding with previous support and a strong liquidity area. This is a region where a price increase reaction is likely.
Further down, the 3,628 – 3,630 zone is considered solid support on the larger frame, and if retested, it will be a long-term buying opportunity.
Conversely, if the price decisively surpasses the strong resistance zone of 3,720 – 3,730, the upward trend will be confirmed to continue, opening up higher targets around 3,750+.
Trading Plan Reference
Short-term sell around 3,697 – 3,700, SL 3,707, TP 3,686 – 3,673.
Short-term buy around 3,650 – 3,645, SL 3,640, TP 3,673 – 3,690.
Long-term buy around 3,628 – 3,630, SL 3,620, TP 3,660 – 3,690 – 3,720.
These are my personal views on XAUUSD, and you can use them as a reference to build your own plan. If you find this useful, follow me for the latest updates on new gold trading scenarios.

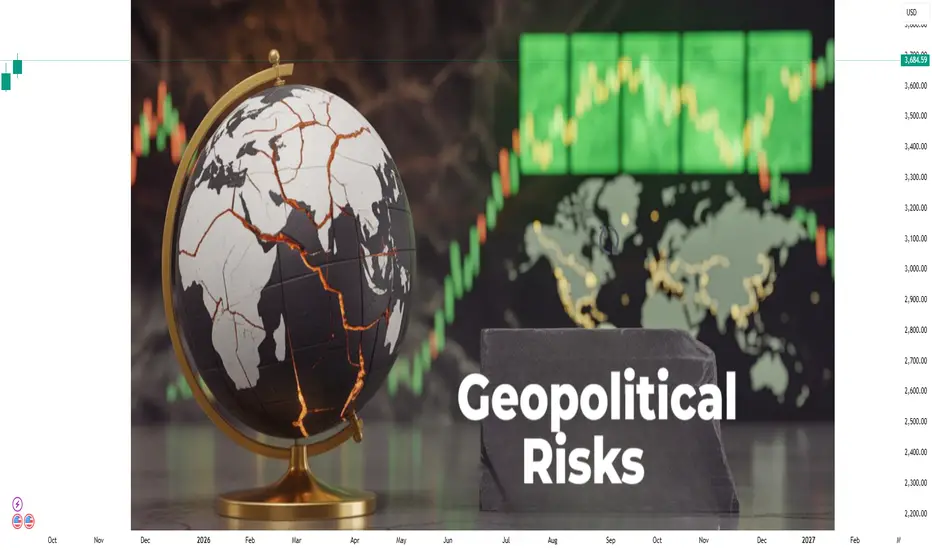
Geopolitical Risks and Their Impact on Global MarketsIntroduction
Geopolitical risks encompass a broad spectrum of political, economic, and military events that can disrupt the global economic landscape. These risks, ranging from armed conflicts and trade wars to policy shifts and regime changes, have profound implications for financial markets, investment strategies, and economic stability. Understanding the nature of these risks and their potential impacts is crucial for investors, policymakers, and businesses operating in an increasingly interconnected world.
1. Nature and Sources of Geopolitical Risks
Geopolitical risks arise from various sources, each with unique characteristics and potential consequences:
Armed Conflicts and Wars: Military engagements, such as the ongoing Russia-Ukraine conflict, can lead to significant disruptions in global supply chains, especially in energy and commodities markets. For instance, attacks on critical infrastructure can cause immediate price spikes and long-term supply shortages.
Trade Wars and Sanctions: Economic measures like tariffs, export controls, and sanctions can alter trade flows and affect the profitability of multinational corporations. The U.S.-China trade tensions are a prime example, influencing global supply chains and market sentiments.
Political Instability and Regime Changes: Shifts in political power, especially in key economies, can lead to policy uncertainties that affect investor confidence and market stability. Changes in leadership can result in abrupt policy shifts, impacting sectors such as energy, finance, and technology.
Cybersecurity Threats: Increasing reliance on digital infrastructure makes economies vulnerable to cyberattacks, which can disrupt financial systems, trade, and national security.
Environmental and Resource Conflicts: Competition for scarce resources, exacerbated by climate change, can lead to geopolitical tensions, particularly in regions dependent on natural resources.
2. Mechanisms of Market Impact
Geopolitical events influence markets through several channels:
Market Volatility: Uncertainty surrounding geopolitical events can lead to increased volatility in stock and bond markets. Investors often react swiftly to news, leading to sharp price movements.
Commodity Price Fluctuations: Conflicts in resource-rich regions can disrupt supply chains, leading to price increases in commodities like oil, gas, and metals. For example, tensions in the Middle East often result in spikes in oil prices due to concerns over supply disruptions.
Currency Instability: Geopolitical risks can affect investor confidence in a country's currency, leading to depreciation or volatility. Countries directly involved in conflicts may see their currencies weaken due to capital outflows.
Capital Flows and Investment Patterns: Heightened risks can lead to shifts in investment strategies, with investors seeking safe-haven assets like gold, government bonds, or stable currencies. Emerging markets may experience capital outflows as investors seek safer investments.
Supply Chain Disruptions: Conflicts and trade restrictions can interrupt the flow of goods and services, leading to shortages and increased costs for businesses and consumers.
3. Case Studies of Geopolitical Events and Market Reactions
Russia-Ukraine Conflict: The invasion of Ukraine by Russia in 2022 led to significant disruptions in global energy markets. Sanctions imposed on Russia resulted in soaring oil and gas prices, affecting global inflation rates and energy security.
U.S.-China Trade War: The imposition of tariffs between the U.S. and China in 2018-2019 disrupted global supply chains, affecting industries from electronics to agriculture. Markets experienced heightened volatility as investors adjusted to the changing trade landscape.
Brexit: The United Kingdom's decision to leave the European Union introduced uncertainties regarding trade agreements, regulatory standards, and economic relations, leading to fluctuations in the British pound and stock market volatility.
Middle East Tensions: Periodic conflicts and tensions in the Middle East, particularly involving Iran, have led to spikes in oil prices due to concerns over supply disruptions, impacting global markets.
4. Quantifying Geopolitical Risk
Measuring geopolitical risk is challenging due to its multifaceted nature. However, several indices and models have been developed to assess and quantify these risks:
Geopolitical Risk Index (GPR): Developed by Caldara and Iacoviello (2022), this index quantifies geopolitical tensions based on news coverage and policy uncertainty. It provides a historical perspective on the frequency and intensity of geopolitical events.
BlackRock Geopolitical Risk Indicator (BGRI): This indicator tracks market attention to geopolitical risks by analyzing brokerage reports and financial news stories. It helps investors gauge the level of concern in the market regarding specific geopolitical events.
Market-Driven Scenarios (MDS): Employed by institutions like BlackRock, MDS frameworks estimate the potential impact of geopolitical events on global assets by analyzing historical parallels and expert insights.
5. Investor Strategies in the Face of Geopolitical Risks
Investors can adopt several strategies to mitigate the impact of geopolitical risks:
Diversification: Spreading investments across various asset classes, sectors, and geographies can reduce exposure to specific geopolitical events.
Hedging: Utilizing financial instruments like options, futures, and currency swaps can help protect portfolios from adverse market movements.
Focus on Fundamentals: Investing in companies with strong fundamentals, such as robust balance sheets and resilient business models, can provide stability during turbulent times.
Monitoring Geopolitical Developments: Staying informed about global events and understanding their potential implications can help investors make timely and informed decisions.
Scenario Planning: Developing and regularly updating risk scenarios can prepare investors for potential geopolitical shocks and guide strategic responses.
6. Implications for Policymakers and Businesses
Policymakers and businesses must recognize the significance of geopolitical risks and take proactive measures:
Policy Formulation: Governments should develop policies that enhance economic resilience, promote diversification, and reduce dependence on volatile regions.
Crisis Management Plans: Establishing frameworks to respond to geopolitical crises can help mitigate their impact on national security and economic stability.
Public-Private Collaboration: Cooperation between governments and businesses can lead to more effective risk management strategies and resource allocation during crises.
Investment in Technology and Infrastructure: Strengthening digital infrastructure and cybersecurity can reduce vulnerabilities to cyber threats and enhance economic resilience.
Conclusion
Geopolitical risks are an inherent aspect of the global economic landscape, with the potential to influence markets, investment strategies, and economic policies. While these risks cannot be entirely eliminated, understanding their sources, mechanisms, and potential impacts allows investors, businesses, and policymakers to develop strategies to mitigate their effects. By adopting proactive risk management approaches and staying informed about global developments, stakeholders can navigate the complexities of geopolitical risks and maintain stability in an interconnected world.
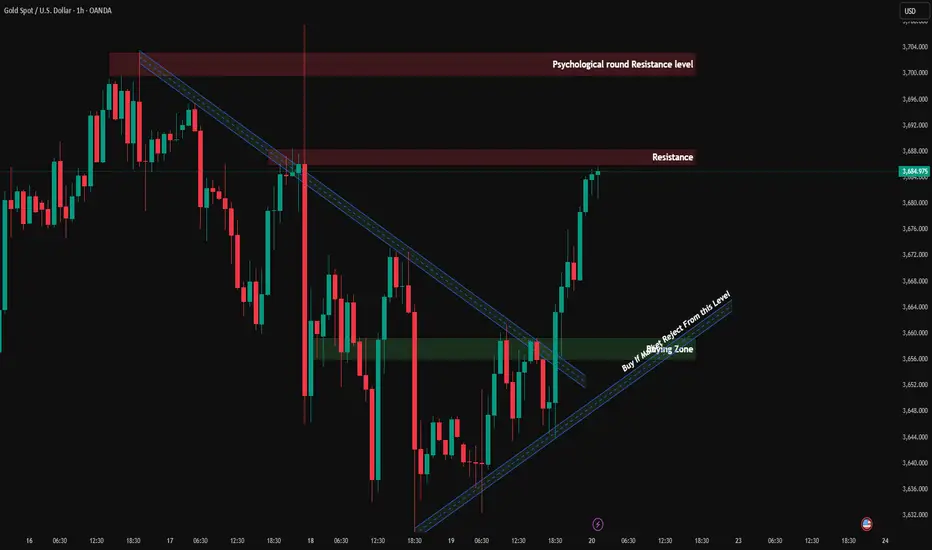
XAU/USD Technical Analysis: Major Levels, Market Structure, and 🔎 Current Snapshot
Price now: ~$3,684.98 per ounce.
Investing.com
Today’s trading range: ~$3,632.28 → $3,686.33.
Investing.com
Technical indicators (on sites like Investing.com) are showing a Strong Buy bias. Many moving averages & oscillators are in bullish territory.
⚙ Updated Key Levels (Support & Resistance)
Here are revised zones to watch, given the current price:
Immediate Resistance - $3700 Psychological round level; has been acting as near-term ceiling.
Immediate Support - $3,650 – $3,670 Zone of recent higher lows; a break below this could see more downside.
Stronger support - $3,600
Major Support Below - $3,500 – $3,550 A deeper correction zone; important in case of more aggressive downward moves.
🔄 Market Structure
Gold is in an uptrend, but there are signs of short-term weakening:
Some indicators are showing overbought conditions.
Price is consolidating just below resistance at ~$3,700 – so momentum is there, but pushing higher might require a catalyst.
On the downside, the structure holds so far — previous swings are supporting, but if support zones (like $3,650) fail, that could shift to a correction mode.
📝 Conclusion
XAU/USD is consolidating within a crucial range, balancing supply and demand forces. The dual-trendline structure signals a potential breakout in the coming sessions. Short-term traders can leverage the 5M CHoCH for early entries, while swing traders should focus on the interplay between the higher timeframe zones and trendlines.
📌 Reminder: Always wait for confirmation before entering trades and manage risk according to your trading plan.
🔔 Follow for updates! Let me know if you have any questions or want to discuss your own analysis. Happy trading! 🚀✨
Gold holds firm at 3,63x | Caution for Friday session🟡 XAU/USD – 19/09 | Captain Vincent ⚓
🔎 Captain’s Log – Market Context
FED : Probability of a 25bps cut in October is 91.9%, while holding rates is only 8.9% → almost certain FED will continue easing.
US News : No major data today, market remains quiet.
Gold : Sharp moves in Asia session, but support 3,632 – 3,630 held strong.
Yesterday’s Buy at 3,62x delivered 200 pips , confirming this zone as a “fortress” support.
Note : Today is Friday – end of the week session, unexpected volatility may occur before the weekly close → strict risk management required.
⏩ Captain’s Summary : Gold remains bullish, but caution is needed with end-of-week swings. Golden Harbor around 3,63x continues to be a solid anchor.
📈 Captain’s Chart – Technical Analysis
Storm Breaker (Resistance / Sell Zone)
3,661 – 3,663 (intraday resistance)
3,683 – 3,685 (strong OB, likely profit-taking zone)
Golden Harbor (Support / Buy Zone)
3,602 – 3,605 (FVG zone – deeper support if 3,63x breaks, waiting for strong demand)
Market Structure
After rebounding from 3,62x, Gold consolidated around 3,65x – 3,66x.
Main trend stays bullish, but needs support retest to confirm buyers’ strength.
3,66x is the pivot barrier:
• Breakout → targets 3,68x
• Rejection → retest 3,64x – 3,62x
🎯 Captain’s Map – Trade Plan
✅ Buy (priority)
Entry: 3,602 – 3,605
SL: 3,588
TP: 3,629 – 3,661 – 3,683
⚡ Sell (short scalp)
Entry: 3,683 – 3,685
SL: 3,695
TP: 3,665 – 3,645
⚓ Captain’s Note
“The 3,63x fortress continues to hold, keeping the Golden ship safe on its northward journey. Golden Harbor 🏝️ (3,602 – 3,605) remains the main dock for sailors to gather strength. Storm Breaker 🌊 (3,683 – 3,685) may raise waves, suitable for short Quick Boarding 🚤 . Today is Friday – the sea can shift unexpectedly, so keep the sails full but hands steady on the helm.”
