XAUUSD – Head & Shoulders Pattern Forming on H4 💛 XAUUSD – Head & Shoulders Pattern Forming on H4 🎯
🌤 Overview
Hello everyone, Lana here again 💬
After a strong drop, Gold is forming a clear Head & Shoulders structure on the H4 timeframe, aligned with the long-term ascending trendline. This pattern suggests the possibility of a bullish move back toward previous highs — but price may still dip lower to complete the structure first.
💹 Technical Analysis (ICT Perspective)
The Left Shoulder – Head – Right Shoulder is gradually shaping around the trendline + supporting FVG.
The upper 50% Fibonacci area is a reasonable zone for the right shoulder to form. If price breaks above the neckline, it may head toward the major liquidity zone around 4200.
In the short term, the 4118–4120 zone serves as resistance + neckline, making it suitable for a technical Sell setup.
The 4040–4042 area aligns with the trendline + Order Block, forming a strong support zone for potential Buy entries if price makes a deeper correction.
🎯 Trading Plan (For Reference Only)
💢 SELL Scenario (scalping at resistance)
Sell: 4118–4120
Stop Loss: 4125
Take Profit: 4105 → 4086 → 4060 → 4040
💖 BUY Scenario (preferred with the main pattern)
Buy: 4042–4040
Stop Loss: 4034
Take Profit: 4075 → 4090 → 4100 → 4140 → 4200
⚠️ Important Notes
Trading based on patterns is always expectation-driven, so combine it with candlestick confirmation on smaller timeframes (M15–M30) before entering.
Upcoming FOMC Meeting and NFP report, especially after the long U.S. government shutdown period, may cause unpredictable volatility.
Reduce position size and avoid holding large trades during major news events.
🌷 Final Thoughts from LanaM2
The H4 Head & Shoulders pattern on Gold is offering attractive opportunities for both short-term Sells and trend-aligned Buys 💛
Stay patient, wait for price to reach the marked zones, follow your stop-loss rules, and avoid FOMO during high-impact news.
If you found this helpful, please 💛 Like – 💬 Comment – 🔔 Follow LanaM2 for daily Gold insights!
Trade ideas

Spot goldDetails provided in the chart, gold is forming like triangle flag pattern support 4000 to 4060
Gold is stronger in longer terms short term it will move up and down
Bullish for longer term
Disclaimer:
Only for education purposes not recommendation

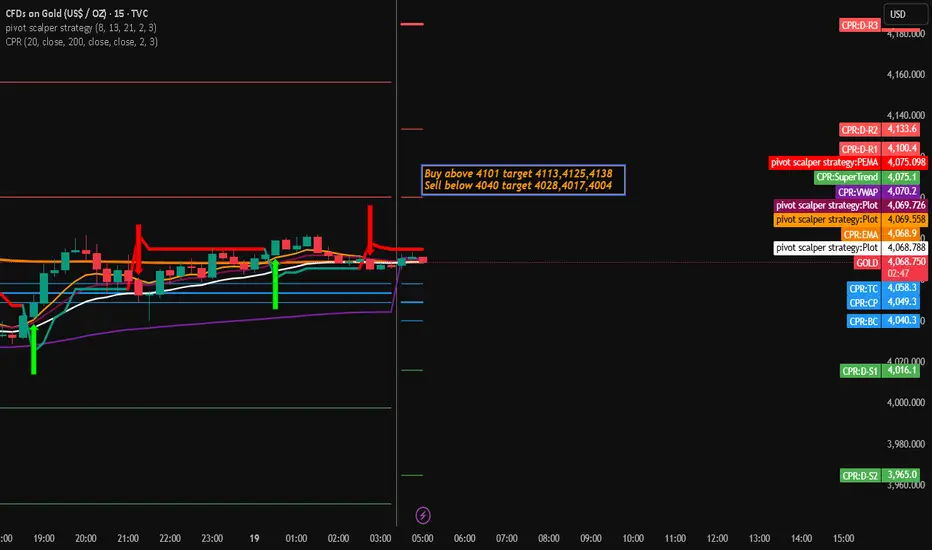
Gold Trading Stategy for 19th November 2025📈 Gold Trading Setup 💰
Buy Setup 🟢
Condition: Enter Buy if Gold (XAU/USD) closes above the high of the 15-minute candle.
Entry Level: Above 4101
Targets:
Target 1: 4113
Target 2: 4125
Target 3: 4138
Sell Setup 🔴
Condition: Enter Sell if Gold (XAU/USD) closes below the low of the 1-hour candle.
Entry Level: Below 4040
Targets:
Target 1: 4028
Target 2: 4017
Target 3: 4004
🛑 Important Disclaimer 📉
This is not financial advice. Trading involves substantial risk and may not be suitable for all investors. Only trade with capital you can afford to lose.
Do your own research (DYOR) before making any trading decisions.
Past performance is not indicative of future results.
Market conditions can change rapidly, and no strategy is foolproof.
Always use appropriate risk management, including stop-loss orders.
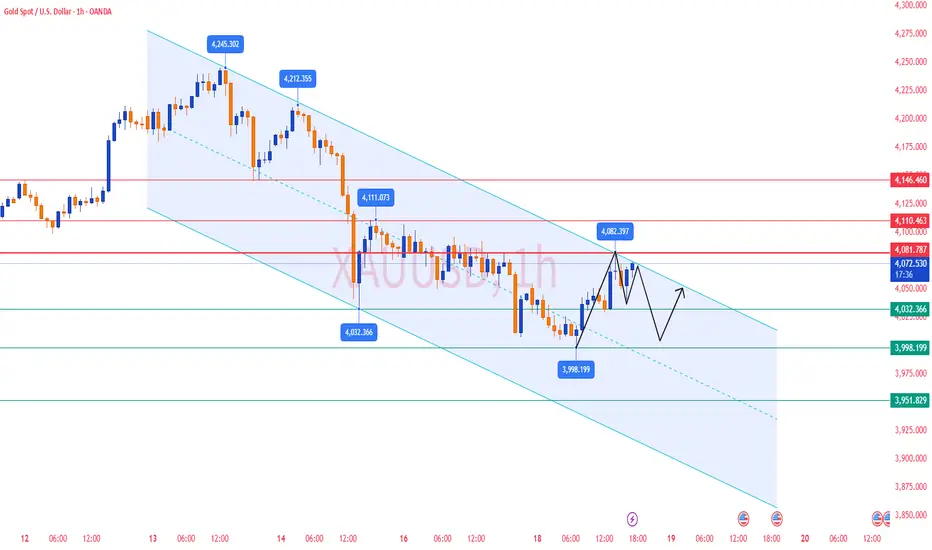
Gold Analysis & Trading Strategy | November 18-19✅ From the 4-hour chart, gold remains in an overall bearish correction structure.
MA5 and MA10 have formed a bearish crossover and continue to suppress the candlesticks, indicating that the short-term rebound is limited.
MA20 is located near 4097, acting as significant resistance. As long as the price fails to stabilize above this level, the bearish structure will not change.
The Bollinger Bands show a downward opening, reflecting a weak trend.
Price previously broke below the lower band (around 3980) and although it has since rebounded, it still remains below the middle band.
Gold has repeatedly tested the 3997–4000 support zone and formed brief rebounds, but the strength is weak — this is still technical correction rather than a trend reversal.
✅ On the 1-hour chart, gold shows a clear short-term rebound correction.
Price has broken above MA5 and MA10 and is holding above the short-term moving averages, indicating strengthening rebound momentum.
The upper resistance comes from the Bollinger upper band at 4075–4078, an area where gold has repeatedly been rejected.
MA20 (around 4036–4040) has shifted from resistance to short-term support.
As long as this level holds, the 1-hour structure still has room to extend the rebound.
Long lower wicks and concentrated trading around 4050–4060 suggest that buyers are trying to establish a short-term base.
However, the short-term rebound has not changed the bigger bearish structure.
If gold fails to break through 4075–4080, the rebound may end and the price could return to its bearish rhythm.
🔴 Resistance Levels: 4075–4080 / 4100–4108 / 4150
🟢 Support Levels: 4036–4040 / 4000–3997 / 3953
✅ Trading Strategy Reference
🔰 Strategy 1 — Look for short positions near resistance (trend-following):
If gold rebounds to 4075–4080 and shows rejection:
Consider taking light short positions
Stop Loss: above 4088
Targets: 4050 → 4035 → 4000
👉 This zone combines multiple moving-average resistance and the Bollinger upper band, making it a high-probability area for trend-following shorts.
🔰 Strategy 2 — Short-term long positions from support (countertrend, light positions):
If gold pulls back to 4035–4040 and stabilizes:
Consider a short-term long position
Stop Loss: below 4030
Targets: 4060 → 4075
👉 This is only a corrective rebound trade — not suitable for large positions.
🔰 Strategy 3 — If gold breaks below 4000, downside may accelerate:
A break below 3997–4000 could trigger a stronger sell-off, with targets toward:3953 → 3920
✅ Summary
Gold remains in a bearish, downward-dominated structure, and the current rebound is still a weak correction.
As long as the price remains suppressed below 4080–4100, the bearish trend remains intact.
Current Market Structure & Key Observations Previous Trend: The Current Market Structure & Key Observations
Previous Trend: The chart shows a strong uptrend from late October, peaking around November 14th at approximately $4,400. This peak marked a significant reversal.
Correction/Reversal: Since the peak, the price has undergone a sharp downward correction or potential reversal.
Trendline Interaction: The price has recently fallen to and is currently interacting with a major long-term ascending trendline (the solid black line).
Current Price: The price is hovering right at the trendline, indicated by the dashed pink line at approximately $4,034.
Analysis of the Projected Path (Red Lines)
The red lines drawn on the chart suggest a specific bearish scenario:
Trendline Break and Retest: The price is shown to break below the ascending trendline. This is a critical technical signal, often indicating the end of the uptrend and the start of a downtrend.
Pullback/Retest: The price then executes a pullback back up to the broken trendline (now acting as a resistance level). The projected high for this pullback is around $4,060.
Bearish Continuation: After failing to break back above the trendline, the price is projected to continue its decline, heading towards the area of $3,900 and then possibly $3,850 in the following days.
Potential Scenarios (Alternative View)
While the red lines illustrate a clear bearish path, it's important to consider an alternative:
Scenario 1: Bearish Continuation (As Projected)
Action: If the price confirms a breakout below the trendline (closes below it on multiple candles), the trendline turns into resistance.
Target: The focus shifts to lower support levels, with initial targets around $3,900 - $3,850. This confirms the end of the recent uptrend.
Scenario 2: Trendline Hold/Bounce
Action: If the trendline acts as strong support and the price fails to close significantly below it, it could lead to a bounce.
Target: A bounce would target the previous swing high before the major drop, potentially aiming back toward $4,150. This would maintain the longer-term bullish structure.

GOLD H1 – Hawkish Fed Pressure Ahead of Key NFP Data🟡 XAUUSD – Intraday Smart Money Plan | by Ryan_TitanTrader (18/11)
📈 Market Context
Gold is trading inside a bearish corrective channel as markets react to hawkish Federal Reserve commentary and positioning ahead of this week’s U.S. NFP data.
• Fed officials signaled a stronger stance against premature rate cuts, keeping USD supported and limiting gold’s upside.
• Price continues to hover near $4,080, reflecting uncertainty as traders balance Fed tone with upcoming labour-market reports.
Institutional order flow shows controlled downside pressure, with engineered liquidity sweeps forming around both channel extremes.
🔎 Technical Analysis (1H / SMC Structure)
• Structure: Price remains inside a Bearish Correction Channel, creating consecutive BOS points, confirming distribution.
• Premium Sell Zone: 4107–4105 aligns with a previous mitigation block + internal liquidity.
• Discount Buy Zone: 3983–3985 sits at the lower boundary of the channel + liquidity sweep zone.
• Liquidity:
→ Buy-side liquidity above 4107 (clean equal-high pocket).
→ Sell-side liquidity resting around 3985–3976, where prior long positions were removed.
🔴 Sell Setup (Premium Reaction Zone)
• Entry: 4,107 – 4,105
• Stop-Loss: 4,117
• Take-Profit Targets:
→ 4,060 (minor imbalance fill)
→ 4,030 (BOS retest)
→ 3,985 (discount zone)
📌 Execute only after a liquidity sweep into the zone + bearish BOS on M5–M15.
🟢 Buy Setup (Discount Reaction Zone)
• Entry: 3,983 – 3,985
• Stop-Loss: 3,976
• Take-Profit Targets:
→ 4,030 (short-term structure high)
→ 4,060 (inefficiency midpoint)
→ 4,105 (premium retest)
📌 Valid if price taps channel low + shows bullish displacement.
⚠️ Risk Management Notes
• Expect volatility as markets digest hawkish Fed remarks before NFP.
• Avoid entering trades inside the 4020–4070 chop region without clear BOS.
• Reduce position size during news hours.
• Trail stops once price clears each liquidity pocket.
📝 Summary
Gold remains pressured by Fed rhetoric, but liquidity is building at both extremes.
• Sell Zone: 4107–4105 (premium mitigation area)
• Buy Zone: 3983–3985 (discount liquidity sweep)
Price is likely to form a manipulation → reaction → continuation pattern within the channel.
📍 Follow @Ryan_TitanTrader for more Smart Money updates ⚡
🎁 More insights & gifts on my TradingView profile.

Xauusd making pennantA big move expected in NY session wait for either side to break to catch the move
Expected is Selling

Gold direction today November 17📊 Support – Resistance – Fibonacci Analysis
1. Trend Overview
Price has broken below the ascending channel, signaling a shift into a corrective downtrend phase.
2. Key Resistance Zone
4,215 – 4,230
Confluence of Fibonacci retracement 0.5 – 0.618
Overlaps with a supply zone + EMA89
→ Strong resistance, high probability of selling pressure.
This is also the expected pullback/retest area before the next bearish leg.
3. Key Support Levels
Support 1 – 4,000
Fibonacci extension 0.5
Horizontal support
→ Likely to generate a short-term reaction.
Support 2 – 3,890
Major downside target if the structure fully breaks
→ Primary bearish target for a deeper continuation.
4. Price Scenario
Price may pull back toward 4,215 – 4,230.
BUY GOLD : 4000 - 3997
Stoploss : 3987
Take Profit : 100-300-500pips
SELL GOLD : 4212 - 4215
Stoploss : 4225
Take Profit : 100-300-500pips


BUY AGAIN BREAKOUT TREND LINE🕯SELL GOLD: 4018- 4015
⚠️ SL: 4015
✔️ TP: 4024→ 4030→3934( 60- 170 pips)
The 4018–4015 zone has just been broken, and with the temporary bearish structure on M15 also violated, there is a high probability that price will pull back and retest this zone.
If that happens, we’ll have a beautiful and technically clean BUY pullback opportunity aligned with the post-breakout structure.
📌 Notes:
This is a BUY pullback setup based on the M15 break of structure
Only BUY with clear candle confirmation
Small lot size + tight SL for safety
I’ll update again when price approaches the retest zone. 🔔🔥

GOLD (XAU/USD): THE BATTLE OF NFP AND FED!1️⃣ TECHNICAL VIEW (TA): Awaiting Sell Confirmation
Structure: The short-term uptrend has ended, prices are adjusting/reversing.
Main Supply Zone (Order Block - OB): Prices are retracing to the ideal sell zone (around $4,064 - $4,081).
Strategy: Prioritise seeking SELL signals at the OB zone.
Target: $3,976 and $3,931 if the OB zone holds.
2️⃣ FUNDAMENTAL VIEW (FA): Interest Rate Pressure
Selling pressure is increasing from:**
Fed Rate Cut Expectations Dwindle: The probability of a 25bps rate cut in December has fallen below 50%. The "Higher for Longer" signal reduces Gold's appeal.
Upcoming Risks: The market awaits NFP and FOMC Minutes. Strong data will bolster USD and sink Gold.
⚠️ Opposing risk: Uncertainty from the US Government shutdown and geopolitical tensions (Russia/Ukraine) may restrain the decline.
#XAUUSD #Gold #TradingSetup #SELLZone #Fed #NFP #PriceAction #SmartMoneyConcepts #Forex

XAUUSD – TWO MAIN SCENARIOS FOR THE DAY: MONITOR REACTION AT...💛 XAUUSD – TWO MAIN SCENARIOS FOR THE DAY: MONITOR REACTION AT TRENDLINE 🎯
🌤 1. Overview
Hello everyone 💬
Gold is currently waiting at the H4 trendline, indicating the market is lacking volume to decide the next direction.
Although the price is adjusting after the drop from the 4,400 USD zone, the larger trend is still supported by strong buying flows from central banks.
💹 Market Context
According to Goldman Sachs, the current decline is only temporary, as the demand for gold as a safe haven asset remains strong:
US bond yields are falling
USD is weakening
The US economy is under pressure from unemployment and inflation
In September alone, central banks purchased 64 tonnes of gold, and forecasts suggest that November may continue this strong accumulation trend.
💹 Technical Analysis
📉 If Gold breaks below the trendline → the market will trigger strong selling pressure, pulling back to the 395x zone, where there is low liquidity and important support.
📈 Conversely, if the price holds the trendline and volume pushes up, a short-term upward structure will form.
📌 The 4068 zone is a key level — if the price retests this area and falls back, Buy will only activate when it reaches 4034.
🎯 Reference Trading Scenarios
🔻 SELL – When breaking the trendline (priority if volume is strong)
Sell 4036–4038 │ SL: 4044
TP: 4010 → 3995 → 3970 → 3945
🔹 BUY – Strong support 395x
Buy 3952–3954 │ SL: 3957
TP: 3975 → 3995 → 4030
🔸 BUY maintaining trend (if price rebounds at 4068)
Buy at 4034 after confirmation signal
⚠️ Important Note
Volume is currently low, making the market prone to stop sweeps, so enter orders with small volume.
The larger trend is still supported by flows from central banks, but in the short term, Gold may fluctuate strongly around the trendline.
Prioritize trading based on price reactions at key zones rather than predicting direction in advance.
🌷Gold is in a sensitive phase at the H4 trendline 💛
If you find this useful, please 💛 Like – 💬 Comment – 🔔 Follow LanaM2 to receive daily gold analysis ✨

GOLD H1 – Will Retail Sales Trigger Gold’s Next Big Move?🟡 XAUUSD – Intraday Smart Money Plan | by Ryan_TitanTrader (17/11)
📈 Market Context
Gold is trading inside a corrective phase as markets anticipate today’s U.S. Retail Sales data and several Fed speeches — both crucial for assessing whether inflation momentum is slowing or rebounding.
• Weak retail numbers may hint at cooling consumer strength, supporting safe-haven bids in gold.
• Strong data could revive USD demand, prompting sell-side setups from premium zones.
Institutional flows show engineered pushes into inefficiency before a directional leg unfolds.
🔎 Technical Analysis (1H / SMC Structure)
• Structure: Gold is forming a short-term accumulation at the discount range after consecutive bearish candles and a deep liquidity sweep below 4030.
• FVG Sell Zone: 4140–4138 aligns with an unmitigated FVG + internal liquidity — ideal for sell-side reactions.
• Discount Zone: 4008–4010 is the last clean demand zone + sweep area, matching the chart’s projected bullish inducement.
• Liquidity:
→ Buy-side liquidity rests above 4140.
→ Sell-side liquidity remains exposed near 4000–3995.
🔴 Sell Setup (Premium Reaction Zone)
• Entry: 4,140 – 4,138
• Stop-Loss: 4,150
• Take-Profit Targets:
→ 4,095 (intra-day imbalance fill)
→ 4,060 (previous BOS block)
→ 4,010 (discount accumulation area)
📌 Trade only after a liquidity sweep into FVG + bearish BOS on M5–M15.
🟢 Buy Setup (Discount Reaction Zone)
• Entry: 4,010 – 4,008
• Stop-Loss: 4,000
• Take-Profit Targets:
→ 4,060 (short-term structure high)
→ 4,095 (mid-range inefficiency)
→ 4,138 (final premium reaction zone)
📌 Valid if price sweeps 4008 and shows bullish BOS + displacement.
⚠️ Risk Management Notes
• Expect volatility during the U.S. Retail Sales release.
• Avoid chasing price inside the 4060–4100 chop region.
• Lock profits at each liquidity level and trail stops.
• Keep total risk under 1–2% per setup.
📝 Summary
Gold remains in a engineered pullback phase with clear liquidity pockets at both extremes.
• Sell Zone: 4140–4138 (FVG / premium reaction zone)
• Buy Zone: 4008–4010 (discount accumulation zone)
A clean manipulation–reaction–continuation pattern is likely before the next intraday move.
📍 Follow @Ryan_TitanTrader for more Smart Money updates ⚡
Check out my TradingView profile for special gifts 🎁

XAUUSDFinally the wait is over. From morning I was on sell side for gold and everyone was waiting for the breakout finally it happened booked good profit after so many fakeouts.

XAUUSD Bearish Breakout Setup from Ascending Triangle Retest1. Market Structure
The chart shows a strong downtrend, followed by a Break of Structure (BOS) to the downside.
After BOS, price formed a corrective ascending structure (an ascending triangle / rising wedge).
2. Current Pattern
Price is moving upward in a corrective manner, showing lower bullish strength.
The ascending trendline is acting as temporary support.
The horizontal resistance at the top of the triangle reflects slowing bullish momentum.
3. Short Entry Logic
The marked point (yellow circle) shows price tapping the ascending trendline.
The red arrow indicates entry short, expecting a breakdown from this rising structure.
This matches the logic:
✔ Downtrend
✔ BOS
✔ Weak bullish correction
✔ Short at trendline retest before a bearish continuation
4. Target Expectation
The “TARGET” label points upward, but based on context this seems contradictory.
Given BOS and corrective rise, the logical target is downward, toward previous liquidity levels or lows.
The triangle breakout normally aligns with continuation of the previous trend, which is bearish.
5. Trade Bias
Bias: Bearish
Reason: Structural break + corrective pullback + rising wedge = continuation pattern.
6. Risk Considerations
Stop-loss usually goes above the most recent swing high inside the correction.
Watch for any strong bullish candle breaking above the ascending structure — that invalidates the setup.

XAU/USD TRADING PLAN 17/11/20251️⃣ CONTEXT
Last Friday saw a drop of ~200 points → confirming strong selling pressure.
No major news today, expected movement:
Wide sideways 4030–4120
Sell bias (priority to sell at high zones)
The major trend remains in a down channel, any rise is mainly for unloading.
2️⃣ GENERAL RULES
SL: 10 points for all trades
TP: 10 points for all trades
3️⃣ SELL ZONES (PRIMARY)
4120–4125
4146–4148
4160–4165
4182–4185
4210–4215 (strongest resistance of the day)
4️⃣ BUY ZONES (RETRACEMENT)
4056–4050
4033–4030
3996–3994
3966
3888
5️⃣ SUMMARY
Bias: Sideways → priority to Sell.
Sell at resistance zones, Buy at strong support zones.
SL/TP adjusted according to RR ratio 1:1, 1:2
Pay attention to appropriate volume

XAU/USD – Rebalancing Structure, Support Zone Holding Steady⏰ Timeframe: 30m
📅 Update: 17/11/2025
🔍 Market Context
After the extended decline late last week, gold is gradually stabilizing around the 4,050–4,080 USD zone, showing a positive reaction at the structural support zone.
The recent Break of Structure (BOS) sequence indicates that the selling momentum is gradually weakening, while the newly formed Order Block is acting as a temporary balance for the market.
The current structure slightly leans towards a technical recovery, as buying flows are returning around the main support zone.
📊 Technical Structure
Support Zone (4,049–4,080 USD): a critical support zone, confluencing with the previous liquidity bottom.
Order Block (4,096–4,115 USD): a short-term supply-demand area, potentially a retest point before the price expands higher.
Resistance Zone (4,145 USD): the first intermediate level to overcome to confirm upward momentum.
Target Zone (4,210 USD): the upper liquidity zone, corresponding to the potential expansion mark of the recovery wave.
🎯 Market Outlook
Priority scenario for the day:
1️⃣ Gold may retest the Order Block zone 4,096–4,115 USD before forming the first push up to 4,145 USD.
2️⃣ If buying pressure is maintained and this resistance zone is broken, the expansion momentum may head towards 4,210 USD, corresponding to a higher liquidity zone.
3️⃣ Losing the 4,049 USD mark will invalidate the recovery structure and bring the market back to a lower balance zone.
🧠 Analyst’s View
The market is currently in a reaccumulation phase after a strong correction.
Buyers still maintain a technical advantage as long as the price remains above the 4,049 USD support zone.
Observing price behavior around the Order Block and the 4,145 USD zone will be key signals to confirm the strength of this recovery wave.
🛡️ Risk Note
The current phase is a “pullback phase” within the larger structure.
Traders should wait for clear price behavior confirmation at technical zones rather than predicting movements in advance.

Gold Technical Rebound to FVG, Prioritise WATCHING FOR SELL at 4📊 Market Structure
Gold has completed a strong decline from the peak of 4.21x, leaving consecutive Break of Structure (BoS), confirming a short-term bearish structure.
The drop through the Breakout zone of 4.10x indicates a dominant selling force.
Currently, the price is bouncing from the Premium Zone 4.05x, aligning with the technical rebound behaviour after a strong sell-off.
The BUY side is merely pulling the price back to the abandoned liquidity zones (FVG 4.12x – 4.15x) before the SELL side can regain control.
The upper FVG zone is where the price often returns to fill after a steep fall. This is also the confluence zone between:
FVG (Fair Value Gap)
Old candle body Breaker
Fibonacci Premium
→ The risk of selling at these zones is very high.
💎 Key Technical Zones
Rebound zone for Sell
FVG 1: 4.101 – 4.126
FVG 2 (Strong Confluence): 4.126 – 4.150
Support zone – target to hit
Premium Zone $$$: 4.050 – 4.052
Lower FVG: 4.030 – 4.035
High probability price scenario: Rebound to FVG → reaction → continue to decline to 4.03x.
🎯 Trading Plan – Prioritise SELL
1️⃣ SELL Setup – High Probability
Wait for price to rebound to the above FVG zones:
Entry SELL:
4.118 – 4.126
Can add orders at higher: 4.140 – 4.150
Stop-loss: above 4.158
TP1: 4.101
TP2: 4.050
TP3: 4.030
✔️ This is a trend-following setup, selling at premium, adhering to SMC principles.
✔️ The current price is just beginning the rebound, not yet meeting BUY conditions.
2️⃣ BUY Setup – Only activate on deep Discount
Entry BUY: 4.030 – 4.035 (Lower FVG)
SL: below 4.020
TP: 4.070 – 4.100
→ BUY is only for counter-trend traders and must wait for a clear discount.
🧠 Vincent’s View
The market is in a distribution – decline phase, every rebound aims to pull liquidity.
As long as the price does not close above 4.150, SELL remains the optimal strategy for the day.
Observe closely when the price hits 4.12x – 4.15x, this is a “high-risk” zone for the BUY side and a “great opportunity” for the SELL side.
“Sell where the liquidity lives — that’s where institutions strike.” ⚜️
⏰ Timeframe: 1H
📅 Update: 17/11/2025
✍️ Analysis by: Captain Vincent

LiamTrading – XAUUSD H1 | Continue to watch for SELL at the ...LiamTrading – XAUUSD H1 | Continue to watch for SELL at the start of the week – wait for price to retrace to the trendline & resistance for a perfect entry
Gold is experiencing a sharp decline amidst global market liquidity pressures. The simultaneous drop in gold, stocks, and Bitcoin indicates that capital is being withdrawn from risky assets and even safe havens, similar to tense periods like the 2008 crisis or the early 2020 pandemic. Investors are selling profitable assets to cover losses elsewhere.
In the long run, gold usually recovers sooner, but in the short term, the downtrend still prevails.
On H1, the price is below the descending trendline, under the 4100 resistance, and is moving in a clear Lower High – Lower Low structure. This is a good signal to continue prioritising SELL orders retracing to resistance.
🔍 Technical Analysis (Trendline • S/R • Fibonacci • Liquidity)
The descending trendline is the biggest barrier; each time the price hits the trendline, it is strongly rejected.
Main Resistance:
4098–4100: resistance area + confluence with the trendline.
4120–4130: stronger area if the price retraces deeply (close to Fibo 0.382).
Target Support:
4065: intermediate support – where the price has bounced slightly several times before.
4040 – 4025: large liquidity area – confluence with the H1 FVG bottom.
3985–3995: the end zone of the down wave if the selling force expands.
Liquidity Zone:
Many liquidity sweep bottoms continuously → indicates that the selling force still prevails.
The lower FVG area (around 4025–4040) is highly likely to be filled within the week.
📉 Trading Scenario (prioritise SELL retracement)
Scenario – SELL retracement to trendline + resistance (priority)
Entry: 4098–4100
SL: 4106
TP: 4088 → 4065 → 4040 → 4025
💡 Suggestion: Wait for M5–M15 to form a rejection candle (pin bar / bearish engulfing) before executing the order.
When to BUY?
Only BUY if:
H1 closes above 4120, breaking the descending trendline → short-term trend phase change.
If this signal is not present → do not rush to buy against the trend.
⚠️ Important Note
The phenomenon of “selling everything to hold cash” may continue → gold may remain under pressure in the short term.
Which price range are you watching for today's session?
Comment below & Follow LiamTrading channel for the fastest updates!

Part 12 Trading Master Class With Experts Types of Options
There are two primary types:
1. Call Option (CE)
A call option gives the buyer the right to buy the asset at a predetermined price (strike price).
Buyers profit when the underlying price goes up.
Sellers profit when the price stays below the strike.
2. Put Option (PE)
A put option gives the buyer the right to sell the asset at the strike price.
Buyers profit when the underlying price goes down.
Sellers profit when price stays above the strike.

GOLD (XAU/USD): 2 Crucial Orders Before the NFP Storm!📉 Technical Analysis (SMC - 2H)
Trend: Decline after a clear MSS/BOS.
Focus: Price is retracing to the Selling Zone (Premium) to fill the FVG.
⚔️ Detailed Trading Plan (R:R > 1:2)
1. Priority Strategy: SELL Limit (Trend Following)
Entry: 4,157.782 (FVG Peak - Supply Zone)
Stop Loss (SL): 4,206.895 (Safe SL above the nearest structural peak)
Take Profit 2 (TP2): 4,051.733 (Main structural target - Nearest bottom)
Objective: Participate in the ongoing price decline.
2. Counter-trend Strategy: BUY Limit (Technical Rebound)
Entry: 4,051.733 (Nearest structural bottom - Support)
Stop Loss (SL): 4,018.699 (SL below lower FVG)
Take Profit 2 (TP2): 4,126.333 (Rebound to the upper FVG bottom)
Objective: Capitalise on the technical rebound from strong support.
🚨 Basic Risk: This Week's Focus
Hawkish Fed: Officials like Schmid assert high inflation, unwilling to ease policy, maintaining high interest rates (Negative for Gold).
Major News: FOMC Minutes (Wednesday) and especially NFP (Thursday) will determine the short-term momentum of USD/Gold.
Risk Management: Gold will be highly volatile from Wednesday. Adhere to SL and manage capital under 2% per order.
#Gold #XAUUSD #Forex #TechnicalAnalysis #FVG #SmartMoney #Fed #NFP #TradingView

XAUUSD – UPDATE ON SCENARIO AFTER WEEKLY OPEN💛 XAUUSD – UPDATE ON SCENARIO AFTER WEEKLY OPEN 🎯
🌤 Overview
Hello everyone 💬
Gold prices at the start of the week are mostly unchanged, the price structure on H4 remains the same, so Lana continues to maintain the old trading strategy.
Currently, gold is weakly reacting around the medium-term resistance area, not strong enough to break through – but also no clear reversal signals.
💹 Technical Analysis
📉 Prices are moving within a narrow range between key liquidity zones:
Zone 4138–4140 is the near resistance, where the market has repeatedly reacted with declines.
Zone 4200 coincides with confluence fibo + descending trendline – strong resistance.
Zone 3990–3988 is important support, also a lower liquidity area, suitable for technical rebound Buy.
Market liquidity is weak, as shown by the pin bars and narrowing range.
🎯 Reference Trading Plan
💢 SELL (priority on correction rhythm)
4138–4140 | SL: 4146 | TP: 4120 → 4105 → 4089
4200 | SL: 4212 | TP: 4185 → 4160 → 4133
💖 BUY (strong support)
3990–3988 | SL: 3984 | TP: 4002 → 4032 → 4060
⚠️ Market Insight (Macro Insight)
Gold declines simultaneously with US stocks and Bitcoin, indicating a lack of liquidity across the market.
This behaviour is common during phases like:
Financial Crisis 2008
Early pandemic panic 2020
Investors are forced to sell even profitable assets to cover losses, causing gold – despite being a safe haven asset – to also decline. This reflects a strong increase in cash demand and widespread fear.
🌷 Conclusion with LanaM2
Gold is moving within a tight range and is heavily dependent on liquidity 💛
If you find this useful, please 💛 Like – 💬 Comment – 🔔 Follow LanaM2 for daily gold analysis ✨

Elliott Wave Analysis – XAUUSD (Week 3, November)
1. Momentum
W1 Timeframe
W1 momentum is preparing to turn upward. This suggests that within 1–2 weeks, weekly momentum may reverse, potentially starting a medium-term bullish phase lasting 4–5 weeks. It also signals that the current bearish trend may weaken next week.
D1 Timeframe
D1 momentum has already turned downward, so the primary expectation for next week remains bearish.
H4 Timeframe
H4 momentum is turning upward, meaning that on Monday we may see a corrective bounce or sideways movement before the downtrend resumes.
________________________________________
2. Wave Structure – W1
Price is still in a corrective phase, likely forming wave 4 of the larger cycle.
This wave count remains valid as long as price closes above 3746.
If price closes below 3746, the entire structure must be reassessed.
________________________________________
3. Wave Structure – D1
Wave 4 is unfolding as a W–X–Y (purple) combination.
Friday’s strong decline confirms that D1 momentum has reversed downward, suggesting that purple wave X is complete and price is now developing purple wave Y.
Targets for Wave Y (purple):
• Target 1: Equal to wave W → 3746
• Target 2: 1.618 × W, a very deep zone
o If price reaches this deeper zone, the structure may no longer represent yellow wave 4, and the count must be re-evaluated.
________________________________________
4. Wave Structure – H4
With Friday’s sharp decline, waves (1) and (2) in blue are temporarily labeled.
The decline is steep, clean, and non-overlapping — all characteristics of a 5-wave impulsive structure, supporting the expectation that purple wave Y will also unfold as a 5-wave decline rather than a triangle. Further confirmation is needed next week.
Given the target at 3746, wave (3) is expected to extend. The current pullback remains valid as long as price does not exceed 4211, which still fits as wave 2 within wave (3).
________________________________________
5. Monday Pullback Zones
H4 momentum indicates a likely bullish correction early next week. Two key resistance zones:
Zone 1 – 4096
“This zone aligns with the 0.382 retracement from blue wave (2) to the current low at 4046. It is also an ideal wave (4) zone if price peaks here before continuing downward.”
Zone 2 – 4145
“This level corresponds to the previous wave (1) in blue. If price reaches this zone, the pullback may represent wave 2 within wave (3). I will update this scenario in more detail on Monday.”
________________________________________
6. Conclusion
The main trend remains bearish.
I expect price to reach the 3746 target for purple wave Y next week, aligning with the projected timing shown by the two vertical blue lines on the H4 chart, while D1 momentum moves into oversold territory.
When price reaches this zone and W1 momentum fully turns upward, it may signal the beginning of a new medium-term bullish trend.
