Elliott Wave Analysis – XAUUSD (18 November 2025)1️⃣ Momentum
D1 Timeframe:
D1 momentum is approaching the oversold zone, signaling that a potential reversal may be forming.
Although this does not confirm a daily reversal yet, it is an early warning that bearish momentum may be weakening soon.
H4 Timeframe:
H4 momentum is also nearing the oversold zone, suggesting that a reversal or recovery bounce could appear shortly.
H1 Timeframe:
H1 momentum is beginning to turn upward, indicating that in the short term we can expect a bullish pullback on the H1 timeframe.
________________________________________
2️⃣ Wave Structure
D1 Wave Structure:
Price is currently still moving inside wave Y.
With D1 momentum entering the oversold zone, we do not have a confirmed reversal yet, but it alerts us to the rising probability of one forming soon.
Wave W previously took 8 days to complete. Since momentum cycles often form in 5–8 daily candles, this time structure can be used as a reference when observing the development of wave Y, as waves W and Y tend to share similar timing characteristics.
________________________________________
H4 Wave Structure:
On H4, a 5-wave sequence (blue) has completed, and price is currently in wave 5.
Combined with D1 momentum nearing oversold, this leads to three possible scenarios:
1️⃣ Scenario 1:
This 5-wave decline is wave (1) of a larger 5-wave structure inside purple wave Y.
If so, once wave (5) finishes, we will see a wave (2) pullback, aligning with the upcoming D1 momentum reversal.
2️⃣ Scenario 2:
Wave Y may end earlier than expected, failing to reach the 3746 target.
If this occurs, a new trend could begin sooner, coinciding with the next D1 momentum reversal.
3️⃣ Scenario 3:
D1 momentum enters the oversold zone but remains compressed there, dragging price lower for a deeper extension before any reversal happens.
These three possibilities help guide our chart observation and prepare for multiple outcomes.
________________________________________
H1 Wave Structure:
On H1, price is also forming a 5-wave decline (blue) and is currently in wave 5.
The projected target for wave 5 is around 3958, which is where we expect a Buy setup.
Additionally, RSI is showing bullish divergence across the lows, reinforcing the probability that price is completing wave 5 and preparing for a short-term bounce.
________________________________________
3️⃣ Trade Plan
• Buy Zone: 3959 – 3957
• Stop Loss: 3938
• TP1: 4000
• TP2: 4096
• TP3: 4145
Trade ideas

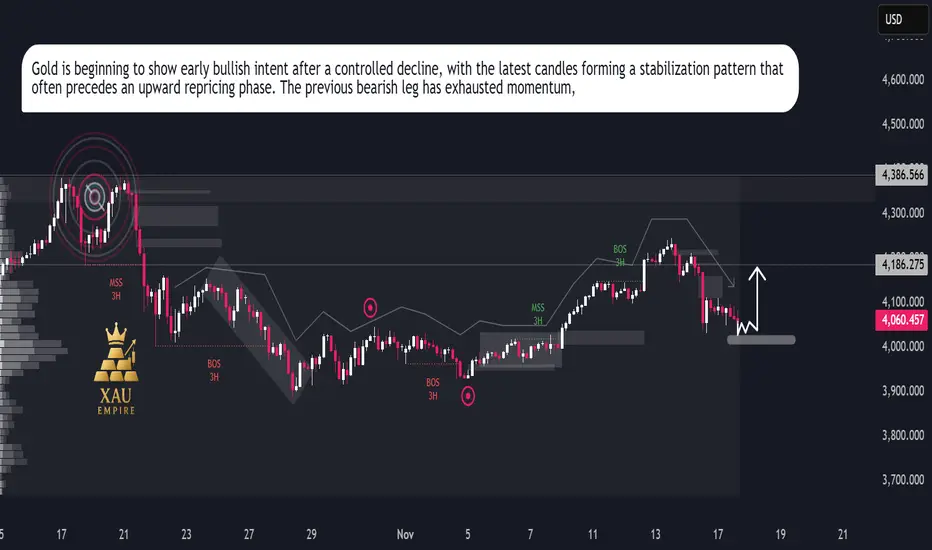
XAUUSD Repricing MoveXAUUSD Repricing Move
Gold continues to trade inside a broader corrective cycle, with price action showing a clear transition from prior strength into a short-term distribution phase. The chart highlights repeated breaks in market structure and shifts in order flow, signalling a controlled decline built on institutional rebalancing.
After the recent downside sweep, price is now hovering around a key reaction zone where liquidity has already been absorbed. Sellers dominated the previous swing, but the latest candles show a slowdown in bearish momentum, indicating that the market may be preparing for a corrective repricing attempt.
The volume footprint on the left side of the chart reflects previous heavy activity from major participants, and the current area sits beneath an inefficiency pocket that remains unmitigated. This opens the door for a short-term bullish rotation if buyers defend this accumulation region. The marked arrow in your chart aligns with a potential internal shift where gold could attempt a short retracement toward the mid-range of the prior move.
Momentum indicators embedded in the structure show reduced volatility, meaning the market may be positioning itself for a liquidity-driven bounce rather than continuing straight lower. The next sessions will reveal whether this zone becomes a launch point for a recovery leg or if the broader trend resumes its downward trajectory.
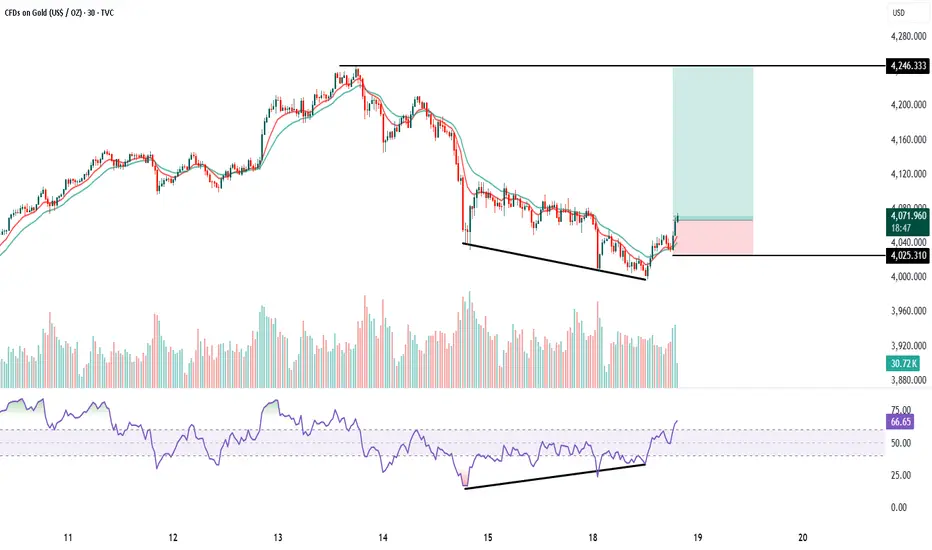
GOLD 30 Min chart analysis1. Trend : Price was in a downtrend with continuous lower highs and lower lows. Now the chart is showing a falling wedge pattern, which is a bullish reversal pattern. Breakout candle is visible with strength, indicating trend reversal from bearish to bullish on the 30-minute timeframe.
2. Volumes: Volumes remained average during the fall.
At the breakout zone, you can see volume expansion, which confirms buyers are stepping in.
This supports a valid bullish breakout.
3. Momentum (Price Action + EMAs): Price is crossing above the 10 EMA and 20 EMA, and both EMAs are starting to turn upward. This shows momentum shift from sellers to buyers. Momentum candles at breakout confirm the start of an upward move.
4. RSI Divergence: Price made lower lows, but RSI made higher lows.
This is a classic bullish divergence, indicating selling pressure is weakening. RSI has now moved above 60, confirming momentum is picking up strongly.
Buy above 4075 after the breakout candle closes above falling wedge.
This ensures confirmation and avoids a false breakout.
Keep SL just below wedge support: SL = 4025
Target : The major horizontal resistance shown on the chart is:
Target = 4246 This is also the measured move of the wedge, matching the resistance zone.
Risk–Reward: RR is approximately 1:3 to 1:3.5, which is ideal for breakout trades. This is a high-probability trend-reversal breakout setup with a clear target and safe stop loss.
XAUUSD MULTI TIMEFRAME ANALYSIS Hello traders , here is the full multi time frame analysis for this pair, let me know in the comment section below if you have any questions , the entry will be taken only if all rules of the strategies will be satisfied. wait for more price action to develop before taking any position. I suggest you keep this pair on your watchlist and see if the rules of your strategy are satisfied.

Current Market Structure & Key Observations Previous Trend: The Current Market Structure & Key Observations
Previous Trend: The chart shows a strong uptrend from late October, peaking around November 14th at approximately $4,400. This peak marked a significant reversal.
Correction/Reversal: Since the peak, the price has undergone a sharp downward correction or potential reversal.
Trendline Interaction: The price has recently fallen to and is currently interacting with a major long-term ascending trendline (the solid black line).
Current Price: The price is hovering right at the trendline, indicated by the dashed pink line at approximately $4,034.
Analysis of the Projected Path (Red Lines)
The red lines drawn on the chart suggest a specific bearish scenario:
Trendline Break and Retest: The price is shown to break below the ascending trendline. This is a critical technical signal, often indicating the end of the uptrend and the start of a downtrend.
Pullback/Retest: The price then executes a pullback back up to the broken trendline (now acting as a resistance level). The projected high for this pullback is around $4,060.
Bearish Continuation: After failing to break back above the trendline, the price is projected to continue its decline, heading towards the area of $3,900 and then possibly $3,850 in the following days.
Potential Scenarios (Alternative View)
While the red lines illustrate a clear bearish path, it's important to consider an alternative:
Scenario 1: Bearish Continuation (As Projected)
Action: If the price confirms a breakout below the trendline (closes below it on multiple candles), the trendline turns into resistance.
Target: The focus shifts to lower support levels, with initial targets around $3,900 - $3,850. This confirms the end of the recent uptrend.
Scenario 2: Trendline Hold/Bounce
Action: If the trendline acts as strong support and the price fails to close significantly below it, it could lead to a bounce.
Target: A bounce would target the previous swing high before the major drop, potentially aiming back toward $4,150. This would maintain the longer-term bullish structure.

GOLD H1 – Hawkish Fed Pressure Ahead of Key NFP Data🟡 XAUUSD – Intraday Smart Money Plan | by Ryan_TitanTrader (18/11)
📈 Market Context
Gold is trading inside a bearish corrective channel as markets react to hawkish Federal Reserve commentary and positioning ahead of this week’s U.S. NFP data.
• Fed officials signaled a stronger stance against premature rate cuts, keeping USD supported and limiting gold’s upside.
• Price continues to hover near $4,080, reflecting uncertainty as traders balance Fed tone with upcoming labour-market reports.
Institutional order flow shows controlled downside pressure, with engineered liquidity sweeps forming around both channel extremes.
🔎 Technical Analysis (1H / SMC Structure)
• Structure: Price remains inside a Bearish Correction Channel, creating consecutive BOS points, confirming distribution.
• Premium Sell Zone: 4107–4105 aligns with a previous mitigation block + internal liquidity.
• Discount Buy Zone: 3983–3985 sits at the lower boundary of the channel + liquidity sweep zone.
• Liquidity:
→ Buy-side liquidity above 4107 (clean equal-high pocket).
→ Sell-side liquidity resting around 3985–3976, where prior long positions were removed.
🔴 Sell Setup (Premium Reaction Zone)
• Entry: 4,107 – 4,105
• Stop-Loss: 4,117
• Take-Profit Targets:
→ 4,060 (minor imbalance fill)
→ 4,030 (BOS retest)
→ 3,985 (discount zone)
📌 Execute only after a liquidity sweep into the zone + bearish BOS on M5–M15.
🟢 Buy Setup (Discount Reaction Zone)
• Entry: 3,983 – 3,985
• Stop-Loss: 3,976
• Take-Profit Targets:
→ 4,030 (short-term structure high)
→ 4,060 (inefficiency midpoint)
→ 4,105 (premium retest)
📌 Valid if price taps channel low + shows bullish displacement.
⚠️ Risk Management Notes
• Expect volatility as markets digest hawkish Fed remarks before NFP.
• Avoid entering trades inside the 4020–4070 chop region without clear BOS.
• Reduce position size during news hours.
• Trail stops once price clears each liquidity pocket.
📝 Summary
Gold remains pressured by Fed rhetoric, but liquidity is building at both extremes.
• Sell Zone: 4107–4105 (premium mitigation area)
• Buy Zone: 3983–3985 (discount liquidity sweep)
Price is likely to form a manipulation → reaction → continuation pattern within the channel.
📍 Follow @Ryan_TitanTrader for more Smart Money updates ⚡
🎁 More insights & gifts on my TradingView profile.

Xauusd making pennantA big move expected in NY session wait for either side to break to catch the move
Expected is Selling

Gold direction today November 17📊 Support – Resistance – Fibonacci Analysis
1. Trend Overview
Price has broken below the ascending channel, signaling a shift into a corrective downtrend phase.
2. Key Resistance Zone
4,215 – 4,230
Confluence of Fibonacci retracement 0.5 – 0.618
Overlaps with a supply zone + EMA89
→ Strong resistance, high probability of selling pressure.
This is also the expected pullback/retest area before the next bearish leg.
3. Key Support Levels
Support 1 – 4,000
Fibonacci extension 0.5
Horizontal support
→ Likely to generate a short-term reaction.
Support 2 – 3,890
Major downside target if the structure fully breaks
→ Primary bearish target for a deeper continuation.
4. Price Scenario
Price may pull back toward 4,215 – 4,230.
BUY GOLD : 4000 - 3997
Stoploss : 3987
Take Profit : 100-300-500pips
SELL GOLD : 4212 - 4215
Stoploss : 4225
Take Profit : 100-300-500pips

Part 3 Learn Institutional Trading Option Buyers
Pay premium.
Have limited risk (premium loss).
Have unlimited profit potential (in theory).
Bet on directional moves.
Option Sellers (Writers)
Receive premium upfront.
Have limited reward (premium earned).
Can face significant or unlimited risk.
Bet on time decay, sideways markets, or low volatility.


BUY AGAIN BREAKOUT TREND LINE🕯SELL GOLD: 4018- 4015
⚠️ SL: 4015
✔️ TP: 4024→ 4030→3934( 60- 170 pips)
The 4018–4015 zone has just been broken, and with the temporary bearish structure on M15 also violated, there is a high probability that price will pull back and retest this zone.
If that happens, we’ll have a beautiful and technically clean BUY pullback opportunity aligned with the post-breakout structure.
📌 Notes:
This is a BUY pullback setup based on the M15 break of structure
Only BUY with clear candle confirmation
Small lot size + tight SL for safety
I’ll update again when price approaches the retest zone. 🔔🔥

GOLD (XAU/USD): THE BATTLE OF NFP AND FED!1️⃣ TECHNICAL VIEW (TA): Awaiting Sell Confirmation
Structure: The short-term uptrend has ended, prices are adjusting/reversing.
Main Supply Zone (Order Block - OB): Prices are retracing to the ideal sell zone (around $4,064 - $4,081).
Strategy: Prioritise seeking SELL signals at the OB zone.
Target: $3,976 and $3,931 if the OB zone holds.
2️⃣ FUNDAMENTAL VIEW (FA): Interest Rate Pressure
Selling pressure is increasing from:**
Fed Rate Cut Expectations Dwindle: The probability of a 25bps rate cut in December has fallen below 50%. The "Higher for Longer" signal reduces Gold's appeal.
Upcoming Risks: The market awaits NFP and FOMC Minutes. Strong data will bolster USD and sink Gold.
⚠️ Opposing risk: Uncertainty from the US Government shutdown and geopolitical tensions (Russia/Ukraine) may restrain the decline.
#XAUUSD #Gold #TradingSetup #SELLZone #Fed #NFP #PriceAction #SmartMoneyConcepts #Forex

PCR Trading Strategies How Option Contracts Work
Options have three crucial components:
1. Strike Price
The price at which the buyer can buy or sell the asset.
2. Expiry Date
The date when the option contract becomes invalid (weekly/monthly expiry in India).
3. Premium
The cost of buying the option.
Buyers pay the premium.
Sellers (writers) receive the premium.
Premium fluctuates based on demand, volatility, and time remaining.

OVERVIEW FOR TODAY - CHART H1 OVERVIEW
Price is currently sitting inside the POC zone – the area with the highest traded volume → the market usually consolidates here before choosing a direction.
Prior trend: Strong uptrend → distribution → correction.
The ascending trendline has been broken → short-term trend is bearish (downtrend).
Volume Profile shows the VAH above as strong resistance, and VAL below as strong support.
1: Price bounces from POC → moves up toward VAH (medium probability)
Conditions:
Price holds above the POC zone (~4000–4010).
Bullish price action appears (pin bar, engulfing, break of structure on H4).
Targets:
4120–4160 (VAH zone) → this is major resistance.
If VAH breaks → trend may resume upward with a larger target around 4300+.
Assessment:
Possible, but not the highest probability, because recent bearish momentum is still strong.
2: Price breaks below POC → retest → drops to VAL (HIGHEST PROBABILITY)
Current candles show strong rejection from VAH → falling directly into POC → bearish confirmation.
If D1 closes below the POC:
Bearish continuation becomes likely.
Targets:
3920–3950 (VAL zone) → very strong support.
Volume Profile thins out here → price tends to move quickly through this area.
Assessment:
This is the most likely scenario because:
✔ Trendline is broken.
✔ Weak bullish reaction at VAH.
✔ Volume Profile structure favors a move downward into VAL.
3: Price breaks below VAL → deeper drop toward Demand zone (low probability but dangerous)
Conditions:
D1 closes below 3920 (VAL)
Breaks the horizontal support.
Deep Targets:
3550–3600 (major Demand zone).
This is where the longer-term uptrend may recover.
Assessment:
Low probability, but if triggered → gold will make a sharp correction.
FINAL CONCLUSION
Highest probability: BEARISH continuation → drop toward VAL zone (3920–3950)
Because:
Strong rejection from VAH
Price sitting weakly on POC
Short-term structure turning bearish
[bTrading Suggestions
For short setups:
Look to sell on a retest of POC (4000–4010).
SL above VAH (4060–4080).
TP at VAL.
For long setups:
Only buy at VAL zone when clear reversals appear (pin bar, engulfing).
Avoid buying between POC → VAL.
⚠️ Disclaimer
All analyses and insights provided in this content are for informational purposes only and should not be considered financial advice. The financial market carries inherent risks, and every trader is fully responsible for their own decisions. Trade with a plan, discipline, and proper risk management.

Pressured Below 4050$ as Bears Target the 4,000$ Liquidity BreakGold continues to trade under heavy selling pressure, staying capped beneath 4,050$ and hovering just above the major liquidity floor at 4,000$.
With fading expectations for a December Fed cut and cautious global sentiment, buyers remain defensive while sellers maintain structural control.
📊 Technical Outlook (H1)
Price remains inside a tight 4,053$ → 4,000$ distribution zone, with the descending trendline keeping gold suppressed.
The POC around 4,053$ is acting as a firm ceiling; every retest so far has been rejected.
Fibonacci projections from the last drop highlight two major downside liquidity zones:
3,945$ → first liquidity cluster
3,876$ → deeper extension and key demand
Current structure resembles a bear flag, hinting that the market may be preparing for another downside expansion.
🎯 Key Scenarios
1️⃣ Bearish Breakdown (Primary Scenario)
If gold loses 4,000$, expect momentum to accelerate into:
3,945$
3,876$
This remains the most probable path while price holds below 4,053$.
2️⃣ Liquidity Sweep → Short-Covering Bounce
If price sweeps 3,945$ and forms bullish rejection wicks:
A relief bounce could develop back toward 4,000$,
Then 4,053$ (POC)
And possibly 4,098$ if buyers gain traction.
Still a corrective move unless bulls reclaim the upper structure.
❌ Invalidation (Bearish Bias Weakens)
H4 acceptance above 4,098$
→ would shift the narrative and force a reassessment of trend direction.
⚜️ MMFLOW TRADING Insight
Gold is still trading below value and below the trendline — this is not a bullish environment yet.
The market must either break 4,000$ or reclaim 4,053$–4,098$ before any stronger directional conviction returns.
“Let the market show its hand. In a downtrend, weak rallies are opportunities — not reversals.”

LiamTrading – XAUUSD H1 | Gold on a downward trend, hitting ...💛 LiamTrading – XAUUSD H1 | Gold on a downward trend, hitting strong support around 4005 🎯
Gold has plunged from its peak, currently “visiting” the 4005–3990 zone, where trendline + POC/OB + high liquidity converge. This is a zone where a technical rebound might occur, but the short-term trend remains bearish, so any BUY orders need to wait for clear confirmation.
🔍 Fundamental Analysis
Goldman Sachs forecasts that during 2025–2026, central banks will purchase an average of ~80 tons of gold per month, a significant driver that could push gold towards 4,900 USD/oz by the end of 2026.
This keeps the long-term trend of gold bullish, but in the short term, deep corrections like the current one are normal to “shake off” positions before big money returns.
📊 Technical Analysis
Current trend:
H1 is still in a short-term downtrend phase (lower high – lower low), with prices below the 4080–4100 resistance zone and below the nearest descending trendline.
Main support zones:
4005–3990: intersection of long-term rising trendline, POC – OB, old VAH/VAL zone → crucial support, potential for bottom-fishing buying force.
3975–3977: deeper support, coinciding with liquidity zone & recent low.
Key resistance zones:
4098–4100: confluence of resistance + trendline test → ideal zone to watch for SELL retracement.
Above is the cluster 4011 – 4053 – 4077 – 4098–4100 acting like “steps” for scalping orders.
Volume Profile:
Heavy trading volume around the 4000–4020 zone → prices tend to revisit this area multiple times before moving away.
🎯 Reference Trading Scenarios
SELL – following the downtrend (priority)
Entry: 4098–4100
SL: 4105
TP: 4082 → 4060 → 4035 → 4012
Price retraces to resistance + descending trendline.
Only trigger when M15–H1 shows clear rejection candles (pin bar/bearish engulfing) around 4098–4100.
BUY – catching the rebound at strong support
Entry: 3975–3977
SL: 3970
TP: 3995 → 4025 → 4050 → 4080
Confluence support zone at channel bottom + POC/OB + liquidity.
Only BUY when there is strong rejection or a clear reversal pattern (M15–H1).
⚠️ Price zones to watch for scalping
4011 – 4053 – 4077 – 3939
These zones are suitable for short scalps, prioritising the main trend (currently bearish), quick exits – do not hold positions too long.
🧠 Risks & Invalidations
H1 closes above 4105 → reduces SELL priority, wait for new structure.
H1 closes below 3970 → bad structure for BUY side, potential for further decline to lower zones.
Are you watching to BUY or SELL gold in this zone?
👉 Comment your perspective & Follow LiamTrading channel for daily XAUUSD plans.

XAUUSD – TWO MAIN SCENARIOS FOR THE DAY: MONITOR REACTION AT...💛 XAUUSD – TWO MAIN SCENARIOS FOR THE DAY: MONITOR REACTION AT TRENDLINE 🎯
🌤 1. Overview
Hello everyone 💬
Gold is currently waiting at the H4 trendline, indicating the market is lacking volume to decide the next direction.
Although the price is adjusting after the drop from the 4,400 USD zone, the larger trend is still supported by strong buying flows from central banks.
💹 Market Context
According to Goldman Sachs, the current decline is only temporary, as the demand for gold as a safe haven asset remains strong:
US bond yields are falling
USD is weakening
The US economy is under pressure from unemployment and inflation
In September alone, central banks purchased 64 tonnes of gold, and forecasts suggest that November may continue this strong accumulation trend.
💹 Technical Analysis
📉 If Gold breaks below the trendline → the market will trigger strong selling pressure, pulling back to the 395x zone, where there is low liquidity and important support.
📈 Conversely, if the price holds the trendline and volume pushes up, a short-term upward structure will form.
📌 The 4068 zone is a key level — if the price retests this area and falls back, Buy will only activate when it reaches 4034.
🎯 Reference Trading Scenarios
🔻 SELL – When breaking the trendline (priority if volume is strong)
Sell 4036–4038 │ SL: 4044
TP: 4010 → 3995 → 3970 → 3945
🔹 BUY – Strong support 395x
Buy 3952–3954 │ SL: 3957
TP: 3975 → 3995 → 4030
🔸 BUY maintaining trend (if price rebounds at 4068)
Buy at 4034 after confirmation signal
⚠️ Important Note
Volume is currently low, making the market prone to stop sweeps, so enter orders with small volume.
The larger trend is still supported by flows from central banks, but in the short term, Gold may fluctuate strongly around the trendline.
Prioritize trading based on price reactions at key zones rather than predicting direction in advance.
🌷Gold is in a sensitive phase at the H4 trendline 💛
If you find this useful, please 💛 Like – 💬 Comment – 🔔 Follow LanaM2 to receive daily gold analysis ✨

WILL GOLD CONTINUE TO DROP?1. Market Context Yesterday, gold was almost in accumulation throughout the Asian–European session and only broke out strongly in the latter half of the US session.
After breaking out of the accumulation zone, the price dropped sharply around 4006 – a crucial key level – and surged strongly from there.
However, statements from FED members remain hawkish, affirming the stance of keeping interest rates high for longer and not considering rate cuts yet.
This creates
-Downward pressure on gold
-Cash flow leaning towards USD
------>>Market sentiment prioritises SELL on price recovery
➡️ Conclusion: Today, the main scenario remains SELL following the trend, BUY is only a secondary strategy & short scalp when reaching strong support.
🎯2. Today's Trading Scenario
(SL: 10 points TP 10 points. RR ratio:1-2/1:3/1:5)
🔻 Main SELL (priority)
SELL Zones:
4050 – 4055
4075 – 4080
4105 – 4110
🟦 Secondary BUY
BUY Zones:
3996 – 3994
3965 – 3960
3935 – 3930
3895 – 3890

GOLD H1 – Will Retail Sales Trigger Gold’s Next Big Move?🟡 XAUUSD – Intraday Smart Money Plan | by Ryan_TitanTrader (17/11)
📈 Market Context
Gold is trading inside a corrective phase as markets anticipate today’s U.S. Retail Sales data and several Fed speeches — both crucial for assessing whether inflation momentum is slowing or rebounding.
• Weak retail numbers may hint at cooling consumer strength, supporting safe-haven bids in gold.
• Strong data could revive USD demand, prompting sell-side setups from premium zones.
Institutional flows show engineered pushes into inefficiency before a directional leg unfolds.
🔎 Technical Analysis (1H / SMC Structure)
• Structure: Gold is forming a short-term accumulation at the discount range after consecutive bearish candles and a deep liquidity sweep below 4030.
• FVG Sell Zone: 4140–4138 aligns with an unmitigated FVG + internal liquidity — ideal for sell-side reactions.
• Discount Zone: 4008–4010 is the last clean demand zone + sweep area, matching the chart’s projected bullish inducement.
• Liquidity:
→ Buy-side liquidity rests above 4140.
→ Sell-side liquidity remains exposed near 4000–3995.
🔴 Sell Setup (Premium Reaction Zone)
• Entry: 4,140 – 4,138
• Stop-Loss: 4,150
• Take-Profit Targets:
→ 4,095 (intra-day imbalance fill)
→ 4,060 (previous BOS block)
→ 4,010 (discount accumulation area)
📌 Trade only after a liquidity sweep into FVG + bearish BOS on M5–M15.
🟢 Buy Setup (Discount Reaction Zone)
• Entry: 4,010 – 4,008
• Stop-Loss: 4,000
• Take-Profit Targets:
→ 4,060 (short-term structure high)
→ 4,095 (mid-range inefficiency)
→ 4,138 (final premium reaction zone)
📌 Valid if price sweeps 4008 and shows bullish BOS + displacement.
⚠️ Risk Management Notes
• Expect volatility during the U.S. Retail Sales release.
• Avoid chasing price inside the 4060–4100 chop region.
• Lock profits at each liquidity level and trail stops.
• Keep total risk under 1–2% per setup.
📝 Summary
Gold remains in a engineered pullback phase with clear liquidity pockets at both extremes.
• Sell Zone: 4140–4138 (FVG / premium reaction zone)
• Buy Zone: 4008–4010 (discount accumulation zone)
A clean manipulation–reaction–continuation pattern is likely before the next intraday move.
📍 Follow @Ryan_TitanTrader for more Smart Money updates ⚡
Check out my TradingView profile for special gifts 🎁

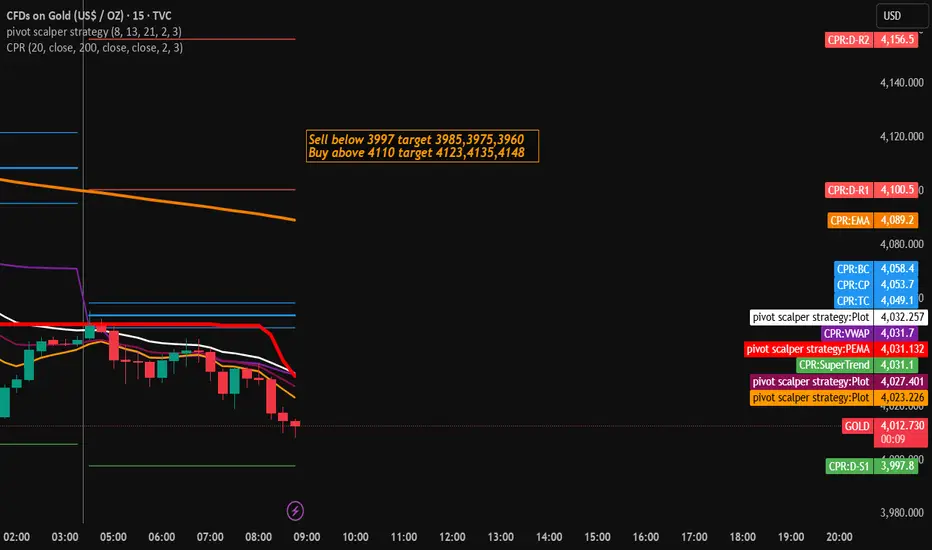
Gold Trading Strategy for 18th November 2025✨ XAUUSD (Gold) Intraday Trade Setup ✨
(Price levels based on your strategy plan)
🔻 SELL Setup (Below 5-min Candle Low)
📉 Sell Below: $3,997 (only if a 5-minute candle closes below this level)
🎯 Targets:
TP1: $3,985
TP2: $3,975
TP3: $3,960
🛡️ Suggested Stop-Loss: Above the breakdown candle high or above $4,005 (safety buffer).
📌 Trade Logic:
A 5-minute candle closing below $3,997 confirms bearish momentum and opens the path toward intraday support levels. Targets are placed at logical liquidity zones.
🔺 BUY Setup (Above 15-min Candle High)
📈 Buy Above: $4,070 (only if a 15-minute candle closes above this level)
🎯 Targets:
TP1: $4,083
TP2: $4,095
TP3: $4,110
🛡️ Suggested Stop-Loss: Below the breakout candle low or below $4,055 (safety buffer).
📌 Trade Logic:
A 15-minute candle closing above $4,070 signals bullish strength. The upside levels represent potential liquidity and resistance zones.
⚠️ Disclaimer
📜 This analysis is for educational and informational purposes only.
💼 This is not financial advice and should not be considered a buy or sell recommendation.
📊 Trading involves significant risk. Always do your own analysis and use proper risk management.
GOLD DAILY TRADING 17/11: BUY TODAY🦁 THE GOLDEN ARENA – 17 NOV, 2025
“Rebound or Trap? Let the Orderflow Decide.”
A visually striking TradingView plan – part narrative, part tactical map. This is not just a bias, it’s a battlefield strategy.
🧭 MARKET CONTEXT SNAPSHOT
Price currently consolidating around 4076 – 4084, after clean breaks of structure (BOS) and a deep retracement.
Significant supply zones confirmed at 4157 – 4180, where POC clusters, FVG imbalances, and volume absorptions align.
Orderflow on M5–M30 shows fading buy pressure and aggressive sells into lower highs.
🎯 CORE STRATEGIES FOR TODAY
🔺 Scenario 1: Breakout Trap SELL (High Conviction)
Target Zone 4178 – 4180 (Main Supply)
Stop Loss (SL) 4185
Take Profit 1 (TP1) 4155 (Low volume node)
Take Profit 2 (TP2) 4100 (Local support)
Take Profit 3 (TP3) 4040 (Structural SSL level)
🔍 Why this setup?
Clear liquidity pool above 4178 being targeted.
Volume tapering off into the move → classic reversal signal.
Footprint shows absorption candles at key supply.
🪙 Scenario 2: FVG Scalping SELL (Secondary)
Entry Zone 4157 – 4158
SL 4163
TP 4100 – 4105
✅ Perfect for short-term scalpers looking to ride the intraday rejection from the imbalance zone.
🟢 Bullish Reversal INVALIDATION (Failsafe Plan)
Trigger Break and hold above 4185
Entry Breakout Buy above 4190
SL 4175
TP 4220
Only flip bullish if aggressive buyers step in + strong delta + profile breakout.
🧱 KEY PRICE ZONES TO MONITOR
Level Description
4185 Stopline – invalidates Sell
4178 – 4180 Main SELL Zone (POC + FVG)
4157 – 4158 Minor FVG Scalping Area
4100 Micro support + Bull trap
4040 SSL – liquidity target
📊 VOLUME & ORDERFLOW INSIGHT
M5–M30 Footprints:
Massive seller imbalances from 4175+
Footprint at 4084 shows buyer exhaustion
Volume Profile:
High-volume node at 4178 acting as strong resistance
Low-volume gap below 4155 → fast price travel zone
Delta:
Negative delta buildup confirming sell bias
💡 EXECUTION CHECKLIST
✅ Wait for entry trigger at marked zones – don’t pre-empt.
🚫 Avoid FOMO buy into supply unless 4185 is cleanly broken.
🔔 Set alerts at 4157 and 4180 for rejection signs.
🧠 TRADING MANTRA OF THE DAY
"The chart speaks in structure,
The volume whispers the truth,
But the orderflow shouts the conviction."
📌 Bias: SELL on retracements toward supply → hold for 4100–4040
📌 Watchlist: Footprint aggression, absorption blocks, spoof traps

XAUUSD Double Bull Flag — Danger AheadHello my dear traders, Laura here.
This week, the market has been extremely tense, and the price action reflects it well.
As I mentioned before, we are currently seeing the formation of a large bull flag. Just above it, a smaller flag is developing, and this smaller structure is the key trigger for any potential continuation. The bullish outlook remains valid only if this smaller flag breaks cleanly.
The recent pullback dipped deeper than expected, which signals hesitation from buyers. When confidence fades, even a promising breakout can turn into a sweet trap that lifts briefly before falling sharply.
Because of this, patience becomes essential. Before entering, we need a clear and decisive breakout that confirms strength. Specifically, we should look for a candle that breaks through resistance with firmness and clarity. If such a confirmation appears, the path toward the 4,300 level becomes structurally supported.
On the other hand, if the price falls below the lower trendline, the bullish scenario is invalidated immediately. At that point, the setup no longer holds and should not be traded.
For now, the principle is straightforward.
No breakout means no entry. Stay disciplined and avoid letting the market pull you into unnecessary risk.

XAUUSDFinally the wait is over. From morning I was on sell side for gold and everyone was waiting for the breakout finally it happened booked good profit after so many fakeouts.
